
ACLU Racially Targeted Arrests in the Era of Marijuana Reform, 2020
Download original document:
Document text
Document text
This text is machine-read, and may contain errors. Check the original document to verify accuracy.
••
•
.
'
••
.
:
ACLU RESEARCH REPORT
A Tale of Two Countries
Racially Targeted Arrests in the Era of Marijuana Reform
ACLU RESEARCH REPORT
A Tale of Two Countries
Racially Targeted Arrests in the Era of Marijuana Reform
© 2020 AMERICAN CIVIL LIBERTIES UNION
Acknowledgements
The report has been a project of the American Civil
Liberties Union (ACLU). The report was developed
by Ezekiel Edwards, Director, Criminal Law Reform
Project; content was led by Brooke Madubuonwu,
Director of Legal Analytics and Quantitative
Research; and the report was overseen and managed
by Emily Greytak, Director of Research. Data
collection, analysis, and visualization was conducted
by ACLU Analytics.
The primary authors are Ezekiel Edwards, Director,
Criminal Law Reform Project; Emily Greytak,
Director of Research; Brooke Madubuonwu, Director
of Legal Analytics and Quantitative Research;
Thania Sanchez, Senior Social Scientist; Sophie
Beiers, Data Journalist; Charlotte Resing, Policy
Analyst, National Political Advocacy Department;
Paige Fernandez, Policing Policy Advisor, National
Political Advocacy Department; and Sagiv Galai,
Paralegal, Criminal Law Reform Project.
The authors thank Rebecca McCray, Editor, for
her editorial assistance; Kadiesha Weise, Legal
Administrative Assistant, for her assistance
reviewing research; Alex Yurcaba, Data Analyst, for
his assistance analyzing data; interns Sarah Sakha,
Catherine Peng, Priya Pai, and Lindsey Feingold for
their assistance in research and analysis; and Neil
Shovelin, Creative Director, for his guidance with
visual design.
We appreciate Udi Ofer, Director, Justice Division,
for his edits and strategic guidance on content and
recommendations, and Lucia Tian, Chief Analytics
Officer, for her edits and strategic guidance on data
analysis and methods. We are also very grateful to
Jeff Robinson, Director, Trone Center for Justice and
Equality; ReNika Moore, Director, Racial Justice
Project; and Carl Takei, Senior Staff Attorney, Trone
Center for Justice and Equality, for their edits and
feedback.
The authors also thank Brandon Cox,
Communications Strategist, for his assistance. We
are grateful for the support from ACLU colleagues
Sondra Goldschein, Deputy Director and Director of
Program and Strategy of the Affiliate Support and
Nationwide Initiatives Department; Danielle Silber,
Director of Strategic Partnerships; and Leila Rafei,
Content Strategist.
The authors also thank ACLU affiliates for their
invaluable feedback on the development of the
report. We extend specific thanks to Michael Perloff
and Scott Michelman at the ACLU of the District of
Columbia for their efforts to obtain data from the
D.C. Metropolitan Police Department; Daniel Tilley
of the ACLU of Florida for his efforts to obtain data
from the Florida Department of Law Enforcement;
and Michelle Shames at the New York Civil Liberties
Union for her help obtaining data from the New York
City Police Department.
Graphic design for this report was provided by
Patrick Moroney.
Contents
Executive Summary. . . . . . . . . . . . . . . . . . . . . . . . . . . . . . . . . . . . . . . . . . . . . . . . . . . . . . . . . . . . . . . . . . . . . . . . . . . . . . . . . . . . . . . . . . . . . . . . . . . . . . . . . . . . . . . . . . . . . . . . 4
Key Findings.. . . . . . . . . . . . . . . . . . . . . . . . . . . . . . . . . . . . . . . . . . . . . . . . . . . . . . . . . . . . . . . . . . . . . . . . . . . . . . . . . . . . . . . . . . . . . . . . . . . . . . . . . . . . . . . . . . . . . . . . . . . . . . . . . . . . 7
Introduction. . . . . . . . . . . . . . . . . . . . . . . . . . . . . . . . . . . . . . . . . . . . . . . . . . . . . . . . . . . . . . . . . . . . . . . . . . . . . . . . . . . . . . . . . . . . . . . . . . . . . . . . . . . . . . . . . . . . . . . . . . . . . . . . . . . . 10
Methodology and Limitations. . . . . . . . . . . . . . . . . . . . . . . . . . . . . . . . . . . . . . . . . . . . . . . . . . . . . . . . . . . . . . . . . . . . . . . . . . . . . . . . . . . . . . . . . . . . . . . . . . . . . . 15
Marijuana Arrests. . . . . . . . . . . . . . . . . . . . . . . . . . . . . . . . . . . . . . . . . . . . . . . . . . . . . . . . . . . . . . . . . . . . . . . . . . . . . . . . . . . . . . . . . . . . . . . . . . . . . . . . . . . . . . . . . . . . . . . . . 21
The National Landscape.. . . . . . . . . . . . . . . . . . . . . . . . . . . . . . . . . . . . . . . . . . . . . . . . . . . . . . . . . . . . . . . . . . . . . . . . . . . . . . . . . . . . . . . . . . . . . . . . . . . . . . . . . 21
State and County Landscape.. . . . . . . . . . . . . . . . . . . . . . . . . . . . . . . . . . . . . . . . . . . . . . . . . . . . . . . . . . . . . . . . . . . . . . . . . . . . . . . . . . . . . . . . . . . . . . . . . 22
States That Legalized or Decriminalized Marijuana Possession. . . . . . . . . . . . . . . . . . . . . . . . . . . . . . . . . . . . . 23
Racial Disparities in Marijuana Arrests.. . . . . . . . . . . . . . . . . . . . . . . . . . . . . . . . . . . . . . . . . . . . . . . . . . . . . . . . . . . . . . . . . . . . . . . . . . . . . . . . . . . . 28
The National Landscape.. . . . . . . . . . . . . . . . . . . . . . . . . . . . . . . . . . . . . . . . . . . . . . . . . . . . . . . . . . . . . . . . . . . . . . . . . . . . . . . . . . . . . . . . . . . . . . . . . . . . . . . . . 29
State and County Landscape.. . . . . . . . . . . . . . . . . . . . . . . . . . . . . . . . . . . . . . . . . . . . . . . . . . . . . . . . . . . . . . . . . . . . . . . . . . . . . . . . . . . . . . . . . . . . . . . . 30
States That Legalized or Decriminalized Marijuana Possession. . . . . . . . . . . . . . . . . . . . . . . . . . . . . . . . . . . . . 34
Conclusion.. . . . . . . . . . . . . . . . . . . . . . . . . . . . . . . . . . . . . . . . . . . . . . . . . . . . . . . . . . . . . . . . . . . . . . . . . . . . . . . . . . . . . . . . . . . . . . . . . . . . . . . . . . . . . . . . . . . . . . . . . . . . . . . . . . . . . . 37
Recommendations. . . . . . . . . . . . . . . . . . . . . . . . . . . . . . . . . . . . . . . . . . . . . . . . . . . . . . . . . . . . . . . . . . . . . . . . . . . . . . . . . . . . . . . . . . . . . . . . . . . . . . . . . . . . . . . . . . . . . . . . . 39
Federal, State, and Local Governments. . . . . . . . . . . . . . . . . . . . . . . . . . . . . . . . . . . . . . . . . . . . . . . . . . . . . . . . . . . . . . . . . . . . . . . . . . . . . . 40
Law Enforcement Agencies. . . . . . . . . . . . . . . . . . . . . . . . . . . . . . . . . . . . . . . . . . . . . . . . . . . . . . . . . . . . . . . . . . . . . . . . . . . . . . . . . . . . . . . . . . . . . . . . . . . . 43
State Profiles.. . . . . . . . . . . . . . . . . . . . . . . . . . . . . . . . . . . . . . . . . . . . . . . . . . . . . . . . . . . . . . . . . . . . . . . . . . . . . . . . . . . . . . . . . . . . . . . . . . . . . . . . . . . . . . . . . . . . . . . . . . . . . . . . . . 48
Appendices. . . . . . . . . . . . . . . . . . . . . . . . . . . . . . . . . . . . . . . . . . . . . . . . . . . . . . . . . . . . . . . . . . . . . . . . . . . . . . . . . . . . . . . . . . . . . . . . . . . . . . . . . . . . . . . . . . . . . . . . . . . . . . . . . . . . . . 98
Endnotes. . . . . . . . . . . . . . . . . . . . . . . . . . . . . . . . . . . . . . . . . . . . . . . . . . . . . . . . . . . . . . . . . . . . . . . . . . . . . . . . . . . . . . . . . . . . . . . . . . . . . . . . . . . . . . . . . . . . . . . . . . . . . . . . . . . . . . . 102
Executive Summary
In 2013, the ACLU published an
FINDING #1
unprecedented national report on marijuana
The War on Marijuana Rages on:
Marijuana Arrests Still Widespread
Across the U.S.
possession arrests, The War on Marijuana
in Black and White,1 analyzing data from
all 50 states (and the District of Columbia)
between 2001 and 2010. Over that time
period, law enforcement made millions of
marijuana arrests, the vast majority of which
were for possession, and Black people2 were
much more likely to be arrested than white
FINDING #2
Extreme Racial Disparities in
Marijuana Possession Arrests
Persist Throughout the Country,
and Have Not Improved Since 2010
people for marijuana possession despite
comparable usage rates. This report updates
our previous findings through an analysis of
marijuana possession arrests and attendant
FINDING #3
Marijuana Arrests Decreased after
Legalization or Decriminalization
racial disparities from 2010 to 2018, and
provides specific analysis on states that have
approved legalization and decriminalization
laws. The report relies on the Federal Bureau
of Investigation’s Uniform Crime Reporting
Program (UCR), supplementary data from
FINDING #4
Racial Disparities in Arrests Persist
Even in States That Legalized or
Decriminalized Marijuana
jurisdictions not included in UCR, and
the United States Census’ annual county
FINDING #5
population estimates to document arrest
Data Collection Failures Block a
Fuller Understanding of Racial
Disparities in Marijuana Arrests
rates per 100,000 for marijuana possession,
by race, at the state and county level.3
4
ACLU Research Report
Disturbingly, too much has remained unchanged
in the past decade despite several states having
reformed marijuana policy. While marijuana
arrests were down by 18% overall since 2010, law
enforcement still made more than 6.1 million such
arrests over the past eight years. In 2018, there were
almost 700,000 marijuana arrests, which accounted
for more than 43% of all drug arrests. In fact, in
2018, police made more marijuana arrests than
for all violent crimes combined, according to the
FBI. Further, it is not clear that marijuana arrests
are trending down—they have actually risen in the
past few years, with almost 100,000 more arrests
in 2018 than 2015. This rise in marijuana arrests
has been driven by states in which marijuana is still
illegal, whereas between 2010 and 2018, marijuana
arrests were significantly lower in states that had
legalized and went down modestly in states that had
decriminalized. Consistent with our previous report,
the majority of marijuana arrests — nine out of every
10 — were for possession.
Equally as troubling, this report finds that stark
racial disparities in marijuana possession arrests
have remained unchanged nationwide. On average, a
Black person is 3.64 times more likely to be arrested
for marijuana possession than a white person, even
though Black and white people use marijuana at
similar rates. Just as before, such racial disparities
in marijuana possession arrests exist across the
country, in every state, in counties large and small,
urban and rural, wealthy and poor, and with large
and small Black populations. Indeed, in every
state and in over 95% of counties with more than
Recommendations at a Glance
For Federal, State, and Local
Governments
• Legalize marijuana use and possession
• Do not replace marijuana prohibition
with a system of fines, fees, and arrests
• Grant clemency to or resentence anyone
incarcerated on a marijuana conviction
and expunge all marijuana convictions
For Law Enforcement Agencies
• End the enforcement of marijuana
possession and distribution
• End racial profiling by police
• Eliminate consent searches
• End the practice of using raw numbers of
stops, citations, summons, and arrests as a
metric to measure productivity and efficacy
• Eliminate collateral consequences
that result from marijuana arrests or
convictions
• Develop systems for the routine collection of
accurate data on a range of police practices
• Ensure new legal markets benefit and are
accessible to communities most harmed
by the War on Drugs
• Invest in nonpunitive programs and
community-based services and divest from
law enforcement
• Ensure marijuana possession and
other low-level offense arrests are not
included in performance measures for
federal funding
• Develop, secure, and implement strong,
independent, and effective oversight
mechanisms for local law enforcement
A Tale of Two Countries: Racially Targeted Arrests in the Era of Marijuana Reform
5
30,000 people in which at least 1% of the residents
are Black, Black people are arrested at higher
rates than white people for marijuana possession.
Although, on average, states that legalized marijuana
through taxation and regulation had lower rates of
racial disparities in marijuana possession arrests
(1.7x) than states where marijuana has not been
legalized (3.2x), a distressing pattern continues —
racial disparities persist in every state that has rolled
back marijuana prohibition — and in some cases,
disparities have worsened.4
This report should be the final nail in the coffin
for the inane War on Marijuana, and sound yet
another abolition knell for this country’s 45-year
drug prohibition charade. The question no longer
is whether the U.S. should legalize marijuana — it
should — or whether marijuana legalization is
about racial equity — it is. It is also no longer about
whether all levels of government should redirect
resources away from prosecution of marijuana and
toward public health investments and community
collaborations — they should. Rather, the question
is: When states legalize, how can they do so through
a racial justice lens to address the panoply of harms
that have been selectively aimed at Black and
Latinx communities for decades? These harms
include not only arrests, incarceration, and lifelong
criminal convictions, but also the loss of jobs,
housing, financial aid eligibility, child custody, and
In every state,
Black people
are arrested
at higher rates
than white people
for marijuana
possession.
6
ACLU Research Report
immigration status. This report provides a detailed
road map for ending the War on Marijuana and
ensuring legalization efforts center racial justice as
they address the widespread collateral damage.
The ACLU reaffirms its recommendation that
federal and state governments legalize marijuana
for persons 21 or older through a system of taxation,
licensing, and regulation, and urges that legalization
repair the harms that prohibition has wreaked on
communities of color.
Key Findings
FINDING #1
The War on Marijuana Rages on:
Marijuana Arrests Still Widespread
Across the U.S.
• Although marijuana arrests have decreased by
18% since 2010, that trend slowed to a halt in the
middle of the decade. There were more marijuana
arrests in 2018 than in 2015, despite the fact that
eight states legalized marijuana for recreational
use or decriminalized marijuana possession in
that timeframe.
• In general, states that have legalized or
decriminalized marijuana possession have seen
a decline in marijuana possession arrests, but in
many other states, arrest rates have increased or
remain unchanged.
• Marijuana arrests made up 43% of all drug arrests
in 2018, more than any other drug category. While
that percentage has dropped from just over 50%
in 2010, this is due in part to a steady increase in
arrests in other drug categories.
• The overwhelming majority of marijuana arrests —
89.6% — are for possession only.
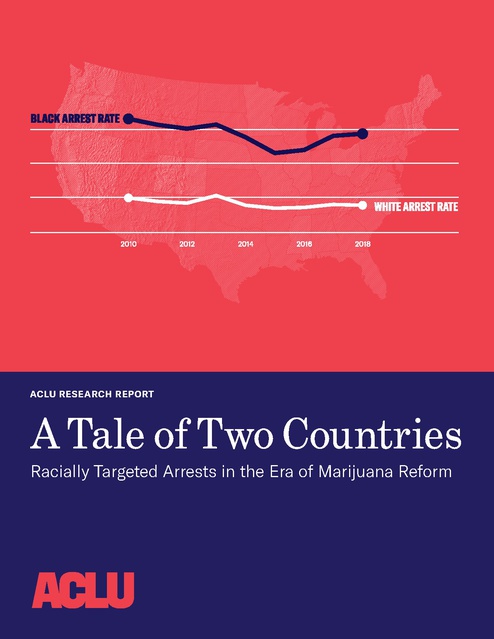
Rates of Black and White Marijuana Possession
Arrests per 100k People
Black arrest rate
600
400
White arrest rate
200
0
2010
2012
2014
2016
2018
Source: FBI/Uniform Crime Reporting Program Data
Note: Florida and Washington, D.C. did not provide data.
FINDING #2
Extreme Racial Disparities in
Marijuana Possession Arrests Persist
Throughout the Country and Have
Not Improved Since 2010.
• Black people are 3.64 times more likely than
white people to be arrested for marijuana
possession, notwithstanding comparable usage
rates. The increasing number of states legalizing
or decriminalizing marijuana has not reduced
national trends in racial disparities, which remain
unchanged since 2010.
• While national arrest rates for marijuana
possession were lower in 2018 than in 2010
for both Black and white individuals, racial
disparities in those arrests have not improved,
and in some jurisdictions, they have worsened.
A Tale of Two Countries: Racially Targeted Arrests in the Era of Marijuana Reform
7
• In every single state, Black people were more likely
to be arrested for marijuana possession, and in
some states, Black people were up to six, eight, or
almost 10 times more likely to be arrested. In 31
states, racial disparities were actually larger in
2018 than they were in 2010.
• Montana, Kentucky, Illinois, West Virginia,
and Iowa were the states with the highest racial
disparities in marijuana possession arrest rates
(9.62, 9.36, 7.51, 7.31, and 7.26 respectively).
FINDING #3
Marijuana Arrests Decreased After
Legalization or Decriminalization,
But There Was Significant
Variability Across States That Only
Decriminalized.
• Arrests for marijuana possession decreased
over time (from 2010–2018) in all states that
legalized recreational marijuana possession.
In some states, these decreases clearly began
after legalization (Colorado, Maine, Nevada). In
other legalized states, decreases continued on a
downward trend that had begun pre-legalization
(Alaska, Oregon, Washington). In two states
(California, Massachusetts), though there was
a decline in arrests from 2010–2018, there was
little change after legalization. In these states, the
decrease in arrests occurred prior to legalization
and remained low, perhaps due to earlier
decriminalization.
• Overall, arrests for marijuana possession also
fell slightly between 2010–2018 in states that
had decriminalized but not legalized recreational
marijuana. However, there is significant
variability across states — and in one state
(Missouri), arrest rates actually increased after
decriminalization. Marijuana possession arrest
rates were approximately eight times higher in
decriminalized states than in legalized states,
although lower than in states where marijuana
possession remained illegal.
8
ACLU Research Report
• In legalized states, arrests for marijuana sales also
decreased greatly from 2010 to 2018 (81.3%). Sales
arrest rates also dropped in decriminalized states,
although to a lesser degree (33.6%).
FINDING #4
Racial Disparities in Arrests Persist
Even in States That Legalized or
Decriminalized Marijuana.
• Although the total number of people arrested
for marijuana possession, and rates of arrests,
have decreased in all legalized states and most
decriminalized states for both Black and white
people, the racial disparities in arrest rates in
these states remain. Specifically, in every state
that has legalized or decriminalized marijuana
possession, Black people are still more likely to be
arrested for possession than white people.
• In some legalized states, such as Maine and
Massachusetts, the racial disparities in marijuana
possession arrests were larger in 2018 than in
2010. In other legalized states, such as California
and Nevada, the disparities narrowed, although
Black people were still more likely to be arrested
for marijuana possession than white people.
• On average, states that have legalized marijuana
possession had lower racial disparities in
possession arrests in 2018 compared both to
states that have only decriminalized and states
where marijuana remains illegal. However, it is not
clear that this difference is a result of legalization
– these states also had lower racial disparities in
2010, before any states had legalized.
FINDING #5
Data Collection Failures Block a
Fuller Understanding of Racial
Disparities in Marijuana Arrests.
• Although a great body of evidence establishes that
Latinx individuals face racial bias in policing and
discrimination in the criminal legal system writ
large, we were not able to compare marijuana
arrest rates for Latinx individuals in this report.
• The FBI’s Uniform Crime Reporting arrest
data is the most up-to-date and comprehensive
data on arrests nationally, by state, and by
county. However, similar to many federal data
collection efforts, UCR data fails to disaggregate
between Latinx individuals of different races,
making it impossible to distinguish between
Latinx and non-Latinx individuals in the Black
and white populations. Because UCR data does
not identify Latinx populations as a distinct racial
group, potential disparities in arrest rates for
Latinx populations cannot be examined. Arrests of
Latinx individuals coded as white in the data likely
artificially inflate the number of white arrests,
leading to an underestimate of the disparity
between Black and white arrest rates.5
• In addition to their impact on Black and Latinx
populations, other racial or ethnic groups may
be affected by bias in policing and marijuana
enforcement. Future research using UCR data is
warranted to examine disparities for Native and
Indigenous populations, and Asian and Pacific
Islander populations, particularly in jurisdictions
with large enough samples of these populations.
However, disparities for bi- or multiracial people
cannot be examined with UCR data because the
UCR Program employs a “check one” approach
to race, and does not allow for an individual to
be coded as more than one race. Furthermore,
disparities for Arab and Middle Eastern people
cannot be examined with UCR data as they are not
identified by the UCR Program at all.
• The variation in reporting quality across years,
agencies, and geographies also leaves some gaps
in some constituents’ ability to quantify racial
disparities at the local level.
A Tale of Two Countries: Racially Targeted Arrests in the Era of Marijuana Reform
9
Introduction
The criminalization of marijuana and the “War on Drugs” more broadly has been a
misinformed and racist government campaign that continues to result in the criminalization
of millions of Americans.6 Pursued under the guise of public safety and reducing marijuana
consumption, this decades-long debacle has been an abject failure — it has harmed
communities, needlessly derailed lives, and wasted taxpayers’ valuable dollars. Both public
opinion and sage public policy have called for an end to marijuana prohibition. In response,
several states have legalized or decriminalized marijuana use in recent years. As of March
2020, 11 states and Washington, D.C.7, have legalized the recreational consumption of
marijuana, and in 2019, Hawai‘i became the 15th state to reduce the criminal consequences of
marijuana-related offenses.8
A growing body of research has sought to explore the
impact of these reforms, finding that these reforms
led to a reduction in marijuana-related arrests and
the myriad harmful consequences associated with
a criminal conviction.9 However, research suggests
that racial disparities in marijuana arrests persist
in several of those states, remaining as sharp a
thorn in the nation’s side as they were a decade ago.10
Moreover, according to the FBI, after an overall dip in
the number of marijuana arrests between 2010–2014,
such arrests began to increase again, and there were
roughly 100,000 more marijuana arrests in 2018 than
in 2015.11 This report seeks to build on this existing
research — as well as our 2013 report The War on
Marijuana in Black and White12 — to document the
national, state, and local landscape; to assess our
progress; and to examine the potential promise of
reforms. As this report will demonstrate, much of this
country has yet to start on the road toward equitable,
smart, reparative marijuana policy, and for those
that have, the journey is not complete.
10
ACLU Research Report
The War on Marijuana
In our 2013 report The War on Marijuana in Black
and White, we documented the national scope of our
country’s decades-long, multibillion-dollar, racist war
against people who use marijuana. We found that, in
2010, despite the fact that Black and white people13
use marijuana at similar rates, Black people were
arrested at over three times the rate of white people,
and up to eight times as often in some states. Further,
such racial disparities increased between 2001 and
2010, as did marijuana possession arrests overall.
Such wasteful and race-driven enforcement of
marijuana laws did not occur overnight. Since
the early decades of the 20th century, the
criminalization of marijuana has been a pretext
for the criminalization of Black and Brown people.14
Taking advantage of several decades of Reefer
Madness propaganda, in 1970, President Richard
Nixon signed the Controlled Substances Act and
classified marijuana under Schedule I — reserved
for the most dangerous class of drugs with
the highest potential for abuse and little to no
medical value, a designation shared by drugs like
heroin, methamphetamines, and PCP. But such
classification — like the drug war generally — had
nothing to do with marijuana or science, and
everything to do with criminalizing and controlling
certain communities. As John Ehrlichman, counsel
to Nixon and assistant to the president for domestic
affairs, said over two decades later:
“We knew we couldn’t make it illegal to be
against the war (Vietnam) or Black, but by
getting the public to associate the hippies with
marijuana and the Blacks with heroin, and
then criminalizing both heavily, we could
disrupt those communities. We could arrest
their leaders, raid their homes, break up their
meetings, and vilify them night after night on
the evening news. Did we know we were lying
about the drugs? Of course we did.”15
This war on people who use drugs has since been
declared a failure by countless public health
officials and advocacy organizations, the World
Health Organization, and the United Nations.16 In
response, certain countries have pursued nationwide
legalization of marijuana, while many jurisdictions
across the U.S. have decriminalized or legalized
marijuana for both recreational and medicinal use.17
Despite the often bipartisan groundswell to legalize
marijuana use, and the fact that two in every three
Americans support legalizing marijuana,18 marijuana
remains illegal in a majority of states.
Inconsistency at the
Federal Level
At the federal level, marijuana remains a Schedule I
substance, subjecting people involved in marijuana
activities to harsh penalties and preventing a range
of scientific research that could upend decades of
propagandized misinformation driven by racism
and fear.
Much of this
country has yet to
start on the road
toward equitable,
smart, reparative
marijuana policy.
Making matters worse, the Trump administration
has sought to abandon the Obama administration’s
more sensible approach to marijuana policy
by resurrecting the saber-rattling of bygone
anti-marijuana crusaders. Under the Obama
administration, local jurisdictions enjoyed
substantial deference with regard to setting
marijuana policy. In 2013, Deputy Attorney
General James Cole issued a guideline (“The
Cole Memorandum”) significantly limiting the
enforcement of federal marijuana laws in states that
had legalized.19 Such deference to states that were
experimenting with legalization was crucial for the
vitality of the newly legalized markets. Consumers
needed to feel safe participating in marijuana
activities, and entrepreneurs needed to know that
the federal government was not about to shut down
their ventures or prosecute them for engaging in
business that was legal in their state. The Obama
administration’s approach reassured states that the
federal government would not interfere with states’
legalization efforts as long as those efforts did not
implicate federal enforcement priorities, such as
interstate drug trafficking and drug cartels.20
Rather than respecting the will of the voters in states
that legalized marijuana, the Trump administration
and its first attorney general, Jeff Sessions (who,
when he was a U.S. Senator, famously proclaimed,
“Good people don’t smoke marijuana”), promptly
rescinded this policy. The same week that California
began selling and taxing marijuana for recreational
A Tale of Two Countries: Racially Targeted Arrests in the Era of Marijuana Reform
11
use21 and Vermont’s legislature called for a formal
vote on its own legalization bill,22 the Department
of Justice announced that the Cole Memorandum
was no longer in effect. Instead, Attorney General
Sessions, echoing discredited alarmists of yesterday,
asserted that “marijuana is a dangerous drug and
that marijuana activity is a serious crime”23 and
instructed federal prosecutors “to use previously
established prosecutorial principles that provide
them all the necessary tools to disrupt criminal
organizations, tackle the growing drug crisis, and
thwart violent crime across our country.”
Notwithstanding Sessions’ peddling of prohibitionist,
time-worn rhetoric, most Americans support
legalizing marijuana. Furthermore, state-level
efforts to get smart on marijuana continue, and
federal marijuana prosecutions are declining.24
Even Sessions’ replacement, Attorney General
William Barr, recently communicated to members
of Congress that he would support a carve-out
exemption that would protect states from federal
prosecution if they legalized recreational marijuana
consumption.25
In spite of this ongoing sea change, law enforcement
in the U.S. continues to make hundreds of thousands
of marijuana arrests every year, and Black people
continue to bear the disproportionate brunt of those
arrests. Marijuana legalization should be — and
indeed is — a racial justice issue. But thus far, racial
justice has largely been a peripheral or incidental
goal of legalization, resulting in continued racist
enforcement of marijuana laws, the exclusion of
Thus far, racial
justice has largely
been a peripheral
or incidental goal of
legalization.
12
ACLU Research Report
people of color from participating in, leading, and
building wealth from the marijuana industry, and the
failure to repair the harms done to communities of
color by the drug war. 26
Centering Racial Justice
Marijuana legalization has always been a racial
justice issue.27 Whereas marijuana use by white
people has been de facto legal in much of the country,
in Black and Brown communities, police have
routinely stopped people, particularly youth — at
the park, on the street, in the train, on the bus, at
school, near school, by the community center, on the
porch, or while driving — searching (usually in vain)
for something illegal, and, if they found marijuana,
arresting and hauling people to jail.28 Such police
harassment not only criminalizes people of color for
engaging in an activity that white people participate
in with relative impunity, it is a means of surveillance
and social control29 counterproductive to public
safety and community health. Indeed, repeated police
encounters prove traumatic and dehumanizing for
those who endure them.30
Simply put, marijuana is used at similar rates by
Black and white people across America,31 yet Black
and Brown people are disproportionately targeted
for and harmed by its criminalization, subjected to
stops, frisks, arrests, and convictions of marijuanarelated offenses because of their race. This is true
for drug enforcement generally (see crack versus
cocaine enforcement and sentencing) but perhaps
no more starkly than when it comes to marijuana
enforcement.32
While some states that have legalized marijuana
built expungement, resentencing, and
reclassification mechanisms into their reforms
to ensure that people previously convicted of
marijuana violations benefit retroactively from
marijuana’s legal status, their effectiveness in
reducing the disparate harm on people of color
remains unclear. Furthermore, other states
have not centered racial equity in their reforms,
and much more can be done to guarantee that
drug reform laws repair the harms suffered by
communities of color as a result of racially biased
enforcement and criminalization. Precisely because
of this history, racial justice remains a critical
prism through which drug reform policies should be
evaluated.33
Reforms Beyond Legislation:
The Role of Prosecutors and
Police
To be sure, while legalization is the most powerful
step toward reducing the damage of marijuana
criminalization, there are other steps that can
be taken in the meantime. For example, local
prosecutors have the power to end prosecution for
marijuana violations. Cyrus Vance, the district
attorney for Manhattan, instituted a Decline-toProsecute policy on marijuana possession and
consumption cases, reportedly resulting in a
substantial reduction of such cases in the first 90 days
of the policy taking effect.34 District Attorney Larry
Krasner of Philadelphia, State’s Attorney Marilyn
Mosby of Baltimore, Fairfax County Commonwealth
Attorney Steve Descano of Virginia, Cook County
State’s Attorney Kim Foxx of Illinois, and a growing
list of prosecutors have launched similar efforts in
order to discontinue the harmful approaches of their
predecessors on marijuana policy.
While they ameliorate the harm of criminal
prosecutions, such approaches cannot be successful
in reducing the harm caused to individuals subject
to marijuana arrests if police departments are not
partners in the prosecutors’ efforts. For example,
after the Austin, Texas, City Council passed a
resolution to reduce arrests for low-level marijuana
violations, the local police chief quickly rebuffed
legislators and vowed to continue to enforce the police
department’s policy of arresting or issuing citations
for marijuana violations.35 Conversely, in Seattle, the
police department played a critical role in minimizing
the harms of marijuana criminalization.36
Of course, progressive policies toward marijuana
enforcement can only be effective if they are part
of a broader effort by prosecutors and police to end
selective enforcement of all criminal laws against
Black and Brown people. After all, marijuana
prohibition is simply one tool in governments’
criminal law arsenal — albeit a very effective and
ubiquitous one — to marginalize and disempower
people of color.
Criminal consequences is not the only harm
of marijuana prohibition. There is a range of
potentially debilitating collateral consequences as
well, many of which persist even after marijuana is
decriminalized or even legalized. These can further
erode people’s civil rights by impacting housing
rights, parental rights, the administration of public
benefits, access to education, and immigration
status. For example, families who live in federally
subsidized public housing face eviction or family
separation if someone is accused of using marijuana
on their premises. Parents may lose their children
in family court proceedings if accused of using
marijuana. Disabled and poor recipients of public
benefits still face the threat of losing their benefits
for marijuana use. Immigrants can face deportation
for marijuana use. Because of the race-driven way in
which marijuana criminal laws have been enforced,
each of these potentially life-altering consequences of
criminalization has been borne disproportionately by
communities of color.
Conclusion
In 2020, we enter a decade marked by confusion
and contradictions when it comes to marijuana
policies. Today, marijuana is still categorized by
the federal government among the most dangerous
drugs with no medicinal value, and yet 37 states
have rolled back prohibitionist laws (11 states and
the District of Columbia have legalized recreational
use, 15 other states have decriminalized use, and
11 additional states have legalized it for medical
use only).37 People in neighboring states, such as
A Tale of Two Countries: Racially Targeted Arrests in the Era of Marijuana Reform
13
Illinois and Wisconsin, enjoy markedly different
rights given the conflicting legal status of marijuana
across their borders.38 Traveling from Illinois to
Wisconsin, someone who uses marijuana goes from
being a casual consumer protected by local law to
a potential target of criminal laws subject to lifealtering prosecution. And the injustice of the past
is a harbinger for today’s marijuana market. While
corporations, entrepreneurs, and governments in
some jurisdictions are making millions of dollars
in profits and revenues in the legal marijuana
industry, poor people in other jurisdictions are stuck
in handcuffs or jail cells, or with lifelong criminal
records for possessing or selling miniscule fractions
of what these powerful companies move daily. In
some states, there are even people serving sentences
of life without parole for marijuana convictions.39
Clearly, there is a long way to go to end the harms
of marijuana prohibition and ensure that racial
equity guides the implementation of legalization and
decriminalization efforts.
As we begin a new decade, it is time to assess the
progress and failures of this country’s marijuana
policies at the state and county level with regard
to racial justice. This report provides a new,
unprecedented examination of the state of marijuana
enforcement in the U.S. and the ramifications of
decriminalization and legalization efforts — on overall
arrests, and specifically on the racial inequities
perpetuated by this war. Using data on marijuana
arrests that local police departments provide the
FBI under the Uniform Crime Reporting Program,
alongside supplemented data obtained directly from
unreported jurisdictions, this report examines
nationwide and state trends in both arrests and
Black/white racial disparities. Keenly aware of the
consequential policy decisions made at local levels,
this report also examines how different counties
behave with respect to marijuana arrests and racial
disparities in such arrests. And as the number of
states implementing reforms in marijuana laws
has increased since our last report, we are able
to examine the potential impact legalization or
14
ACLU Research Report
This report
provides a new,
unprecedented
examination of the
state of marijuana
enforcement in
the U.S.
decriminalization policies have had on such arrests
and racial disparities.
Indeed, while there is some existing research
examining the potential fiscal and public safety
impacts of marijuana law reforms in select states
or jurisdictions, there is considerably less empirical
research on the impact of these reforms on people
of color. The scope of this report not only allows
for an examination of the national, state, and
local landscapes, it will provide new information
on the success — or failure — of these current laws
to address the racial inequities perpetuated by
marijuana prohibitions. As such, these findings offer
direction for policymakers, criminal justice leaders,
and advocates who seek not only to end the war on
marijuana, but to ensure that we do so in reparative
ways that allow us to confront the racial injustice
of the past by building a path forward with and for
the people and communities most deeply harmed by
marijuana prohibition.
Methodology and
Limitations
To document the incidence of marijuana and other drug arrests, this report uses data from
the FBI’s Uniform Crime Reporting (UCR) Program, supplemented by data obtained directly
from states, when necessary (i.e., Illinois, New York). The data is used descriptively to better
understand marijuana arrest patterns over time. In this section we describe our data sources,
usage, and limitations.
Data
• Uniform Crime Reporting Data [United
States]: Summarized Agency Data, 20172018. These datasets are publicly available
through the FBI’s Crime Data API.
Sources
The marijuana possession arrest data presented
in this report was obtained from the FBI’s Uniform
Crime Reporting Program (UCR) Program. For the
years 2010–2016, the data was obtained through the
National Archive of Criminal Justice Data (NACJD).
We downloaded tables of data that included monthly
counts of each offense type for each agency that
reports to the UCR Program, for each racial group.
For the years 2017 and 2018, data was not available
through NACJD at the time of analysis. For these
years, we used the FBI’s Automated Programming
Interface (API) to retrieve the data. Data for
years 2017 and 2018 was last retrieved via API on
November 22, 2019.
• Uniform Crime Reporting Data [United
States]: Arrests by Age, Sex, and Race
[Alternative Title: ASR], 2011-2016. These
datasets are publicly available through the NACJD
and stored at the Inter-university Consortium for
Political and Social Research at the University of
Michigan.
In addition, population estimates for each county for
each year were obtained from:
• U.S. Census Bureau, “Annual County
Resident Population Estimates by Age, Sex,
Race, and Hispanic Origin,” April 1, 2010,
to July 1, 2018. This data was released in
June 2019 by the population division of the U.S.
Census Bureau. Raw data is available in CSV
format here, and a data dictionary describing the
variable definitions is available here. This dataset
estimates the population of each racial group of
each county on July 1 of the corresponding year.
While most states report to the UCR Program, some
do not, and thus data for Illinois and New York City
were obtained separately. We obtained arrest data for
New York City from “NYPD Arrests Data” (Historic),
published by the New York Police Department online
at NYC OpenData. This data was last updated on
May 16, 2019. Data for Illinois was obtained through
a Freedom of Information Act, 5 ILCS 140 (“FOIA”)
request submitted to the Illinois Department of
A Tale of Two Countries: Racially Targeted Arrests in the Era of Marijuana Reform
15
State Police, which acts as the central repository and
custodian for crime statistics from every policing
body in Illinois.
We also submitted FOIA requests to Washington,
D.C.’s Metropolitan Police Department (MPD),
as well as to the Florida Department of Law
Enforcement, in November 2019. In December 2019,
Washington, D.C.’s Mayor’s Office of Legal Counsel
ruled in favor of a legal appeal submitted by the ACLU
and ordered MPD to begin producing responsive
records within five business days. Nevertheless,
the District of Columbia did not provide data in an
appropriate, timely manner for analysis in this report,
and Florida refused to provide any data at all.
Counting and Classifying Marijuana Arrests
The data used in this report (both UCR data and
supplementary state data) count one arrest for each
separate instance in which a person is arrested,
cited, or summoned for an offense. Because a person
may be arrested more than once in a year, the arrest
numbers used in this report do not reflect the actual
number of individuals who have been arrested; rather,
the arrest data shows the total number of times
that persons have been arrested, as reported by law
enforcement agencies to the UCR Program.
When someone is arrested for multiple crimes arising
from a single police interaction, the UCR Program
calls it a “multiple-offense situation.” As a general
rule, a multiple-offense situation requires classifying
each of the offenses committed into “Part I” and
“non-Part I” offenses. Part I offenses are the following:
Murder, Rape, Robbery, Aggravated Assault,
Burglary, Larceny (theft), Motor Vehicle Theft, and
Arson (fire). Marijuana possession is defined as a nonPart I offense, as are all drug offenses. The Hierarchy
Rule, as described in the FBI/UCR Handbook,
requires that in a multiple-offense situation involving
both Part I (e.g., Robbery — Other Dangerous
Weapon) and non-Part I offenses (e.g., Marijuana —
Possession), only the Part I offense, Robbery — Other
Dangerous Weapon, is classified and reported.
16
ACLU Research Report
The arrest for marijuana possession would not be
reported in this situation. Additionally, if a person is
arrested for multiple Part II offenses, the reporting
agency determines which offense is the most serious
and scores only that arrest. Thus, any marijuana
possession arrest recorded in the UCR data is an
arrest in which marijuana possession is the highest
charge for which that individual was arrested during
that police interaction. Any racial disparity observed
in marijuana arrests recorded in UCR data is thus not
a product of differential arrest rates for Part I crimes
or crimes that agencies deem more serious than
marijuana possession. According to the FBI, more
than 85% of all arrests are for a single offense.
It should be noted that for data obtained from New
York City, the New York Police Department publishes
a data footnote that states, “Only valid arrests are
included in this release. Arrests that were voided
when further investigation reveals person did not
commit offense or it is determined no offense has
been committed are excluded from the data set.” As
such, NYC data may not be directly comparable to
other agencies that include arrests that were not
excluded from the dataset. Individual nuances in the
way police departments categorize arrests, due to
differences in state law, enforcement priorities, and
reporting capacity, are inherent in any interpretation
of UCR data, and will be discussed more in the
limitations section below.
Coverage
The UCR Arrests by Age, Sex, and Race dataset and
the Summarized Agency Data from the UCR API
include variables that indicate the population covered
by a particular agency. The FBI also provides an
“Agency Crosswalk file,” which shows which agencies
correspond to each county. To find each county total,
we summarized the total number of arrests and
the total population within each county. We then
compared the population of all the agencies reporting
data in a particular county to the total population of
that county to identify a coverage indicator.
The coverage indicator is a measure of how
completely the agencies within a given county have
reported their arrests to the UCR Program. For
each agency, we multiply the population covered by
that agency by the number of months reported, and
divide by 12. For example, if an agency that covered
50,000 people reported data for 12 out of 12 months,
the “reported population” of that agency is 50,000 *
12 / 12, or 50,000. However, if that same agency only
reported data for 10 out of 12 months of the year, its
reported population is 50,000 * 10 / 12, or 41,667.
Participation in the UCR Program varies widely.
Many counties have full participation, with all
local enforcement agencies in the county reporting
to the UCR Program, but some agencies within
some counties do not report data, or do not report
every month, due at times to budget and capacity
constraints. If an agency reports data for fewer than
12 months, we used the FBI’s methodology, described
below, to impute the missing arrest counts.
We impute data at the agency level, and summarize
coverage at the county level to get a coverage
indicator, or a measure of the countywide data
quality. While many counties have a coverage
indicator of 100%, some counties have missing
data, and the more data a county is missing, the less
confidence we can have in our estimates. If a county is
less than 50% covered, meaning that more than half
of its data is imputed, we do not report its individual
arrest counts or arrest rate estimates.
Imputation
The National Archive of Criminal Justice Data
(NACJD), part of the Inter-university Consortium
for Political and Social Research, imputes data for
missing agencies to aggregate to the county level.
We use the same procedure but also aggregate by
race to be able to examine racial disparities. Their
imputation procedure is described in full here, but
in brief, the following steps are used to estimate the
number of arrests for agencies with various types
of reporting procedures. First, data for any agency
reporting 12 full months is submitted as-is. Second,
data for an agency reporting three to 11 months is
multiplied by a weight of [12/months reported]. For
example, if an agency reports 50 arrests over six
months of data, 50 is multiplied by 12/6 (or 2) to
estimate that 100 arrests would have occurred over
a similar 12-month period. For agencies reporting
zero to two months, data is too sparse to be reliable.
These are first set to zero, and then data is estimated
using rates calculated from fully reporting agencies
located in the missing agency’s state and geographic
stratum. More about defining the geographic strata
is described by the NACJD, but, briefly, if an agency
covering a population of 15,000 fails to report data
to the UCR, then the arrest total for that agency is
imputed using the average number of arrests among
similarly sized agencies in the same state and year.
Finally, that agency-level data is aggregated to
the county level using the crosswalk file. The total
county-level reported population is aggregated and
divided by the county-level total population, including
nonreporting agencies, to arrive at the county-level
coverage indicator. Throughout this analysis, when
highlighting individual counties, we exclude counties
with a coverage of less than 50% — that is, counties
where arrests were imputed for more than 50% of
the population covered in that county. For example,
in 2018, 12.6% (381) of counties had less than 50%
coverage and were thus excluded from these analyses.
Though analysis of raw data undercounts the total
arrest counts because of agencies that do not report,
the results on the impacts of racial disparities
do not substantially vary from the results using
the methodology from our 2013 report. Thus,
for consistency with NACJD, we use the UCR’s
imputation methodology for this report.
Calculating Rate Ratios
Racial disparities in policing and enforcement of
marijuana possession laws can be quantified by
comparing arrest rates in the Black population to
arrest rates in the white population. By dividing the
A Tale of Two Countries: Racially Targeted Arrests in the Era of Marijuana Reform
17
rate in the Black population by the rate in the white
population, we can estimate if Black people are more
likely than white people to be arrested for marijuana
possession, and, if so, how much more likely. Below is
the formula used to calculate the rate ratio:
RR=Ba/Bp / Wa/Wp
Where RR is the Black-to-white rate ratio of arrests
for marijuana possession; Ba/Bp is the rate of arrest
in the Black population, and Wa/Wp is the rate of
arrest in the white population.
State Profiles
We used the following additional methods for the 49
state profile sheets included at the end of this report.
When identifying the top counties with the largest
racial disparities per state, we generally only included
counties with: a population of at least 30,000, a Black
population of at least 1%, a data coverage ratio of
at least 50%, and at least 25 arrests for marijuana
possession. We applied this inclusion criteria to
avoid highlighting counties with outlier rates due
to very small populations and numbers of arrests.
Because states vary widely in their demographics, it
was imperative to modify the inclusion criteria in
select cases, which are also noted in each state profile
sheet. For states with less than a 1% Black population
overall, we included counties for the ranking if they
met all criteria outside of the Black population
criterion. We extended this rule to Hawai‘i, where
we only obtained data for two counties. In Vermont,
very few counties made more than 25 marijuana
possession arrests in 2018, so we lowered that cutoff
to 10 marijuana possession arrests. Additionally,
because Alaska is less densely populated, we
broadened the population criteria to include counties
in Alaska with a population of at least 20,000 and
at least 10 marijuana possession arrests. Those
counties were excluded from consideration when
identifying the top counties per state with largest
racial disparities, but were included in other aspects
of analyses for the state profiles and the entire report.
18
ACLU Research Report
Each state profile includes a county-level map.
On that map, counties for which we received no
data (roughly 50 counties across all 49 states) are
indicated by stripes. In addition, there were five
counties that arrested multiple Black people for
marijuana possession and zero white people. The
measure of racial disparities in these counties is
mathematically infinite, so while we do not report
numeric rate ratios for these counties, they are
colored in red in the county-level maps, indicating
racial disparities above the national average.
Similarly, the counties that reported zero Black and
white possession arrests (roughly 125 counties) are
colored in grey, indicating racial disparities below the
national average.
Limitations and Considerations
This report, which analyzes data from 2010–2018,
in combination with our previous report assessing
data from 2000–2010, offers an unprecedented
look at the national, state, and county landscape
of marijuana enforcement over the past nearly two
decades. However, as with all research, there are
some limitations to the data. Here we present those
limitations, along with a few key areas to consider
when interpreting the findings of this report.
Limitations of Missing Data
The ambition of the FBI’s Uniform Crime Reporting
Program in attempting to harmonize arrest data
from more than 18,000 agencies across the country
makes it the most comprehensive data source for
understanding arrests in the U.S., but gaps remain.
This section describes our attempts to deal with
those gaps, their comparability to UCR data, and the
extensibility of this analysis to previous work.
As mentioned previously, not every agency reports
data for each month. The imputation method
described previously is used by the FBI to fill in
gaps in county-level crime data, but these methods
are simple and do not account for fundamental
differences between reporting agencies and
nonreporting agencies. Though a majority of the
FBI’s agencies and an even larger majority of the
agencies covering large populations like cities
had 100% coverage in the years we analyzed, we
were unable to determine whether systematic
biases existed between reporting agencies and
nonreporting agencies with regard to population
demographics. The lowest unit of measurement at
which demographic data by race was available was
the county level, not the agency level. It is conceivable
that the demographics of agencies with full UCR
reporting are different from those with little or no
UCR reporting. If arrest rates in populations in
these nonreporting agencies differ systematically
from arrest rates in reporting agencies, it is likely
that our estimates are imprecise. Systematic
differences could bias the results of our analysis in
either direction. However, given the consistency
of the racial disparities in every state and nearly
every county in the nation, we feel that despite this
variation in agency reporting, additional data is
unlikely to change the direction of the findings — that
is, to remove the measured effect of racial disparities.
Nevertheless, we do not report estimates for counties
in which less than 50% of the population is covered by
a reporting agency.
We use a different imputation methodology in this
report than was used in our previous report, which
was published in 2013. Our imputation procedure
follows the FBI’s procedure exactly, while the
previous study used a weighting procedure at the
county level rather than imputation at the agency
level to account for missing data. The outcomes do
not change substantially whether one uses countylevel weighting or agency-level imputation, so we
selected the better-known procedure for this report
to ensure our methodology is more transparent and
replicable. For the same reasons, we provide access
to the data and code with this updated report. This
report’s methodology differs only in minor ways from
those of the earlier report, but we present 2010 data
here for comparison in the states and counties where
the methodology implemented here results in slightly
different values than in our previous report. For the
purposes of examining trends between 2000 and 2018,
these two reports can go hand-in-hand, but it is not a
goal for our 2010 estimates of racial disparities in this
report to perfectly match those used with a different
imputation methodology. Rather, the consistent
overall findings between the two reports, despite
the slight variations in methodology, are a signal
that these findings are robust to multiple different
imputation methods.
Despite our repeated attempts (as detailed
previously) to obtain data from every jurisdiction for
this report, including those that do not report to the
FBI’s UCR program, we were unable to do so. The
District of Columbia refused to provide data in an
appropriate, timely manner for analysis in this report,
and Florida refused to provide any data at all. Thus,
findings from this report are limited to 49 of the 50
U.S. states.
Race and Ethnicity Data Limitations
Although nationwide the criminalization of
marijuana has been largely targeted at Black and
Latinx individuals, UCR data only allows for an
exploration of disparities between Black and white
people, and not between Latinx and white people.
Similar to many federal data collection efforts,
UCR data does not identify Latinx individuals as a
distinct racial group, but as an ethnicity. “Ethnicity”
variables are available in UCR data codebooks,
ostensibly to distinguish between Hispanic and nonHispanic individuals of each race, but these variables
are missing so frequently that we were unable
to employ them in this analysis. As such, Latinx
individuals of all races are likely miscoded in various
ways. While Afro-Latinx people are likely to be coded
as Black in policing data and treated as Black by
police, non-Black Latinx people may often be counted
as white by reporting agencies. This miscoding
likely leads to an underestimation of the true rate
of racial disparities experienced by people of color
at the hands of police. Arrests of Latinx individuals
coded as white in the data likely artificially
inflate the number of white arrests, leading to an
A Tale of Two Countries: Racially Targeted Arrests in the Era of Marijuana Reform
19
underestimation of the disparity between Black and
white arrest rates.
We are mindful that in addition to Black and Latinx
groups, racial bias in policing and drug enforcement
may negatively affect other racial or ethnic groups,
such as Native and Indigenous populations, Arab
and Middle Eastern populations, Asian populations,
Pacific Islander populations, and those with multiple
racial/ethnic identities (e.g., biracial), among others.
The UCR data classifies individuals’ race as “Black,”
“white,” “Asian,” “American Indian or Alaska Native,”
“Native Hawaiian,” or “unknown.” As such, future
research using UCR data could examine racial
disparities beyond just Black and white populations,
and such analysis might be particularly warranted
in jurisdictions with significantly large populations
of those who have experienced racially biased
policing — for example, examination of disparities in
arrest rates between Native Americans and whites
in Montana. Disparities for bi- or multiracial people
cannot be examined with UCR data, however. The
UCR Program employs a “check one” approach
to race, and does not allow for an individual to be
coded as more than one race. Furthermore, Arab
and Middle Eastern people are not identified by the
UCR Program. Thus, researchers must turn to other
data sources in order to examine arrest rates for
multiracial and Arab or Middle Eastern individuals.
Considerations about Causality
This report presents descriptive statistics, providing
information about numbers of arrests, rates of
arrests, and racial disparities in those rates. Though
we provide this information for states that have
legalized and decriminalized marijuana — both before
and after these reforms were enacted — we have not
performed the requisite statistical controls that
would be required to establish a causal link between
these laws and the subsequent changes in arrest
rates and racial disparities. Indeed, in many states
and counties, arrest rates dropped between 2010
and 2018 despite the fact that marijuana possession
remained illegal in these localities, demonstrating
that many other factors besides legalization drive
20
ACLU Research Report
arrest rates. Further research, both quantitative and
qualitative, is warranted to more clearly understand
and document the effects of marijuana reforms, and
may be best done at the individual state and/or
county level.
Considerations about Timeframe
This report examines arrest rates from 2010
through 2018. Although 2018 was the most recent
year in which data was available, it still did not
allow for an examination of the present state of
marijuana enforcement. Inevitably, data analyses
and reporting must always lag somewhat behind,
preventing any research from being as current as
desired; as such, the findings provided in this report
can only reflect practices as of 2018. In 2018 and
2019, three states (Vermont, Michigan, and Illinois)
legalized marijuana possession, and three others
(Hawai‘i, New York, and New Mexico) decriminalized
possession. As data is made available for 2019 and
subsequent years, future analysis is warranted to
explore the potential effects of the more recent laws
as well as the longer-term impacts of pre-2018 laws.
Marijuana Arrests
Despite an increasing number of states legalizing or decriminalizing marijuana, law
enforcement made well over half a million marijuana arrests in 2018, more than for any
other drug, and more than for all violent crimes combined as reported by the FBI.40 As
expected, states that have legalized or decriminalized marijuana possession have seen
a decline in marijuana possession arrests. However, as of 2018, the national downward
trend appears to have leveled off, even as the number of states that have legalized or
decriminalized marijuana has increased.
The National Landscape
As indicated in Figure 1, between 2010 and 2018,
marijuana arrests in the U.S. trended weakly
downward, with rebounds in 2013, 2016, and
2017. By 2018, arrest rates were higher than in
2015, despite additional states having legalized
and decriminalized during that timeframe. In
no year did they drop below 500,000. In 2018
alone, there were an estimated 692,965 marijuana
arrests — the vast majority of which (89.6%) were
for possession (see Figure 2). As shown in Figure
3, marijuana possession arrest rates have dropped
by approximately 15% from 2010 to 2018, resulting
in a decrease in the national arrest possession
rate, from 250.52 per 100,000 in 2010 to 203.88 per
FIGURE 1
National Arrests for Marijuana and All Other
Drugs (2010–2018)
All other drug arrests
900,000
800,000
700,000
600,000
2010
2012
2014
2016
2018
Source: FBI/Uniform Crime Reporting Program Data
Note: Florida and Washington, D.C. did not provide data.
FIGURE 2
National Arrests for Marijuana Possession and
Sales (2010–2018)
100,000 people in 2018.
As shown in Figure 4, marijuana arrests still
account for more drug arrests in the U.S. than
any other drug class.41 Marijuana arrests also
accounts for more arrests than for all violent crime
combined.42 In 2018, 43.2% of all drug arrests were
for marijuana offenses (see Table 1).
600,000
400,000
200,000
Marijuana sales
2010
2012
2014
2016
2018
Source: FBI/Uniform Crime Reporting Program Data
Note: Florida and Washington, D.C. did not provide data.
A Tale of Two Countries: Racially Targeted Arrests in the Era of Marijuana Reform
21
State and County Landscape
FIGURE 3
Marijuana Possession Arrest Rate per 100k
People (2010–2018)
Since most drug law enforcement occurs at the state
and local level, it is crucial that an examination of
marijuana possession arrests focus on state and
county data.
400
300
200
States
100
0
2010
2012
2014
2016
2018
Source: FBI/Uniform Crime Reporting Program Data and U.S. Census Data
Note: Florida and Washington, D.C. did not provide data.
FIGURE 4
Number of Arrests by Drug Type (2000–2016)
1,000,000
Marijuana
750,000
Opium and Cocaine
500,000
250,000
Synthetic Narcotics
0
2000
2005
2010
2015
Source: FBI/Uniform Crime Reporting Program Data
Note: This graph excludes data from New York City, Illinois, Florida, and Washington,
D.C., which were not available at time of this analysis.
TABLE 1
National Arrests for Marijuana and All Drugs
Year
Total
Marijuana
Arrests
All Drug
Arrests
% All Drug
Arrests That
Were for
Marijuana
2010
831,849
1,556,916
53.4%
2011
768,390
1,488,628
51.6%
2012
734,019
1,469,273
50.0%
2013
856,263
1,702,249
50.3%
2014
679,188
1,453,543
46.7%
2015
595,127
1,369,543
43.5%
2016
611,026
1,445,215
42.3%
2017
702,778
1,613,926
43.5%
2018
692,965
1,603,316
43.2%
Source: FBI/Uniform Crime Reporting Program Data
22
ACLU Research Report
Not surprisingly, arrest rates vary greatly between
states. Here, we provide a comparative assessment;
specific profile sheets for every state are available in
the State Profiles section of this report.43
The national marijuana possession arrest rate in
2018 was 203.88 per 100,000. State arrest rates
ranged from 707.34 arrests per 100,000, in South
Dakota, to 4.52 arrests per 100,000 people, in
Massachusetts (see Appendix, Table A for data for all
states). Not only did South Dakota have the highest
arrest rate in 2018 (see Figure 5), it also had the
greatest growth, with a 176% increase in marijuana
possession arrests from 2010. Although nationally
there was a decline in marijuana possession arrests,
arrest rates actually increased in 17 states (see Table
2).
In terms of total raw numbers of arrests, Texas had
the highest total number of marijuana possession
arrests, with an estimated 70,017 arrests in the year
2018 alone (see Appendix, Table B). In 12 states,
marijuana arrests accounted for more than half
of all drug arrests in 2018, with Wyoming having
the highest percent of all drug arrests that were
for marijuana possession, at 58.6% (see Appendix,
Table B for total number of all drug arrests and total
number of marijuana possession arrests by state).
Counties
Not only do states vary widely in marijuana
enforcement, but even within states there remains
a range in how marijuana offenses are treated at
the county level. Individual district attorneys and
police departments have a substantial amount of
discretion in deciding who gets arrested, charged,
FIGURE 5
States With Highest Marijuana Possession Arrest Rates per 100k (2018)
South Dakota
South Carolina
Wyoming
West Virginia
Georgia
Louisiana
Nebraska
New Jersey
Tennessee
Utah
Missouri
North Dakota
Idaho
Wisconsin
Arkansas
0
100
200
300
400
500
600
700
Source: FBI/Uniform Crime Reporting Program Data and U.S. Census Data
and convicted for drug possession. In some cases,
municipalities have passed their own ordinances
related to marijuana use and enforcement.
Table 3 lists the 20 counties with the highest
marijuana possession arrest rates in 2018. Four
of the top five counties are in South Carolina, the
state with the second highest arrest rates for
marijuana possession. Less predictably, three
Maryland counties are represented in the top 10,
even though Maryland decriminalized certain
amounts of possession in 2014. Although these
counties had the highest arrest rates in 2018,
other counties have had greater increases in
their rates over time, such as Prince George and
Charlottesville City in Virginia and Lawrence,
Alabama. See Table 4 for a list of the 20 counties
with the greatest increases since 2010.
States That Legalized or
Decriminalized Marijuana
Possession
Since our last report in 2013, several states have
legalized or decriminalized marijuana offenses.
Although these laws vary in their specific elements
and implementation, we examine if — and how
TABLE 2
States With Increases in Marijuana Possession
Arrest Rates (2010–2018)
Arrest Rates per 100k
State
% Change
Total Arrest Total Arrest in Total
Rate (2010) Rate (2018) Arrest Rate
South Dakota
256.17
707.34
176.1%
Utah
150.64
343.37
127.9%
North Dakota
180.64
332.52
84.1%
Wyoming
384.56
592.89
54.2%
South Carolina
440.57
673.26
52.8%
Arkansas
215.85
322.12
49.2%
West Virginia
299.85
447.32
49.2%
Idaho
225.02
332.16
47.6%
New Jersey
253.75
369.54
45.6%
Ohio
184.03
248.68
35.1%
New Mexico
168.15
225.71
34.2%
Virginia
236.12
314.33
33.1%
Pennsylvania
180.45
226.52
25.5%
Tennessee
283.50
343.94
21.3%
Georgia
361.87
428.81
18.5%
Louisiana
349.32
412.48
18.1%
Wisconsin
289.37
324.37
12.1%
Source: FBI/Uniform Crime Reporting Program Data and U.S. Census Data
A Tale of Two Countries: Racially Targeted Arrests in the Era of Marijuana Reform
23
— these laws have affected arrest rates and, in a
subsequent section, racial disparities in arrests.
As of March 2020, 11 states and Washington,
D.C. had legalized marijuana possession and an
additional 15 states had decriminalized marijuana
possession (see Appendix, Table C). At the time
of this report, however, the most current data
available was from 2018, and thus, for the following
analyses, we considered only states that legalized or
decriminalized before 2018. See Table 5 for the listing
of such states.44 We also provide a full listing of the
legal status of marijuana possession for all states and
D.C. as of March 2020 in the Appendix (Table C).
Legalized States
In 2018, on average, legalized states had the lowest
arrest rates for marijuana possession compared
to other states.45 Although legalized states also
had lower rates of possession arrests even before
legalization, the over-time trends make it clear that
legalization has made a difference overall. Figure
TABLE 3
TABLE 4
Top 20 Counties for Marijuana Possession
Arrest Rates per 100k people (2018)
Top 20 Counties for Largest Increases in
Marijuana Possession Arrest Rates per 100k
people (2010-2018)
Possession
Arrest Rates
County
County
2010
Rate
2018
Rate
%
Increase
Chester, South Carolina
2,000.72
Prince George, Virginia
61.72
1090.14 1666.3%
Columbia, New York
1,794.25
Lawrence, Alabama
5.82
60.45
938.7%
Newberry, South Carolina
1,610.30
Charlottesville City, Virginia
41.41
371.13
796.2%
Worcester, Maryland
1,391.27
Franklin, North Carolina
37.27
241.05
546.8%
Darlington, South Carolina
1,370.12
Bossier, Louisiana
51.18
316.86
519.1%
Greene, New York
1,315.23
Augusta, Virginia
8.15
46.38
469.1%
Marion, South Carolina
1,258.89
Isle of Wight, Virginia
50.97
286.85
462.8%
Dorchester, Maryland
1,203.20
Somerset, Pennsylvania
97.51
530.36
444.0%
Calvert, Maryland
1,144.53
Franklin, Virginia
92.55
489.37
428.8%
Dodge, Nebraska
1,138.31
Angelina, Texas
77.75
408.73
425.7%
Prince George, Virginia
1,090.14
Haywood, North Carolina
62.78
314.15
400.4%
Spalding, Georgia
1,084.48
Pike, Pennsylvania
137.56
669.40
386.6%
Laurens, South Carolina
1,083.89
Vermilion, Louisiana
65.41
308.47
371.6%
Kershaw, South Carolina
1,075.21
Culpeper, Virginia
219.90
1035.79 371.0%
Culpeper, Virginia
1,035.79
Jefferson, Ohio
144.08
663.78
360.7%
Washington, New York
1,000.11
Nassau, New York
60.50
275.49
355.4%
Colleton, South Carolina
973.88
Marshall, Tennessee
61.92
277.70
348.5%
St. Mary, Louisiana
966.93
Henderson, Kentucky
43.23
193.02
346.5%
Erie, Ohio
963.47
Robertson, Tennessee
94.98
409.14
330.8%
Perry, Pennsylvania
956.17
Chester, South Carolina
478.57
2000.72 318.1%
Source: FBI/Uniform Crime Reporting Program Data and U.S. Census Data
Note: Includes counties with > 30,000 population, > 1% Black population and > 50%
UCR coverage.
24
ACLU Research Report
Source: FBI/Uniform Crime Reporting Program Data and U.S. Census Data
Note: Includes counties with > 30,000 population, > 1% Black population and > 50%
UCR coverage.
6 illustrates the changes from 2010 to 2018 in
marijuana possession arrest rates for states that had
legalized before 2018, states that had decriminalized
before 2018, and states where marijuana possession
remained fully illegal in 2018.46 The rates fall
precipitously in legalized states, indicating that,
as expected, legalization of marijuana possession
reduces overall arrest rates for marijuana possession.
Overall, arrests for marijuana possession decreased
over time in all states that had legalized. However,
when disaggregating legalized states, we see some
interesting differences (see Figure 7; note that
the red line on the state graphs indicates when
legalization occurred). In some states, the decreases
in arrests clearly began after legalization (Colorado,
Maine, and Nevada). In other legalized states,
decreases continued on a downward trend that had
already begun pre-legalization (Alaska, Oregon,
and Washington). In Massachusetts and California,
perhaps due to earlier decriminalization, the
decline in arrest rates occurred several years before
legalization, and remained relatively flat in the years
just before legalization and through 2018 (see also
Figure 7).
Marijuana sales make up a small proportion of
marijuana arrests — only 10.4% of all marijuana
arrests in 2018. Decreases in arrest rates for
marijuana sale were far greater in legalized states
than in other states, dropping from 36.1 arrests per
100,000 in 2010 to 6.27 arrests per 100,000 in 2018,
an 82.7% decrease in the arrest rate. In comparison,
over the same time period, sales arrest rates
decreased by 35.1% in states that had decriminalized
and 13.2% in states where marijuana remained fully
illegal.
While marijuana possession and sales arrests
consistently fell following legalization, the impact of
marijuana legalization on other drug arrests is less
clear. As shown in Figure 7, in some states, such as
Alaska, other drug arrest trends appear unassociated
with marijuana. In others, such as Colorado, other
drug arrests climb following legalization. This is not
necessarily the result of marijuana legalization, and
TABLE 5
States That Legalized or Decriminalized
Marijuana Possession (Before 2018)
Eight States and District of Columbia Legalized
Colorado (2012)
Washington (2012)
Alaska (2014)
District of Columbia (2014)
Oregon (2014)
California (2016)
Maine (2016)
Massachusetts (2016)
Nevada (2016)
Five States Decriminalized Before 2010
Ohio (1975)
Minnesota (1976)
North Carolina (1977)
Mississippi (1978)
Nebraska (1979)
Eight States Decriminalized Between 2010-2017
Connecticut (2011)
Rhode Island (2012)
Vermont (2013)
Maryland (2014)
Missouri (2014)
Delaware (2015)
Illinois (2016)
New Hampshire (2017)
FIGURE 6
Marijuana Possession Arrest Rates Per 100k
People by Legal Status (2010–2018)
Fully Illegal Before 2018
Decrlmlnallzed Before 2018
Legal Before 2018
24.5
2010
2018
2010
2018
2010
2018
Source: FBI/Uniform Crime Reporting Program Data and U.S. Census Data
A Tale of Two Countries: Racially Targeted Arrests in the Era of Marijuana Reform
25
FIGURE 7
Drug Arrests in States With Legalized Marijuana (Before 2018)
...
All Other Drugs
+ Marijuana Possession
Alaska
California
1,600
200,000
150,000
100,000
50,000
1,200
800
400
0
Maine
3,000
2,500
2,000
1,500
1,000
Colorado
~
'
'
•
Massachusetts
Nevada
9,000 ~
6,000
3,000
0
...
Oregon
12,000
10,000
8,000
6,000
•
25,000
20,000
15,000
10,000
5,000
2010
2012
2014
2016
2018
Washington
12,500
10,000
7,500
5,000
2,500
16,000
12,000
8,000
4,000
2010
2012
2014
2016
2018
2010
2012
2014
2016
2018
Source: FBI/Uniform Crime Reporting Program Data
additional research is warranted to understand how,
if at all, marijuana legalization impacts enforcement
of other drugs.
Decriminalized States
Decriminalization also appears to be associated with
a reduction in the rate of marijuana arrests, though
it is less dramatically related than legalization (see
Figure 6). Overall, arrests for possession fell slightly
between 2010–2018 in states that had decriminalized
marijuana possession, but possession arrest
rates remain approximately eight times higher in
decriminalized states than in legalized states.
As illustrated in Figure 8, there was also significant
variability across decriminalized states (the red line
on state graphs indicates when decriminalization
occurred).47 Whereas Maryland and Rhode Island
26
ACLU Research Report
evidenced sharp declines immediately following
decriminalization, a number of other states
continued a downward trend in arrests that began
pre-decriminalization (Connecticut, Delaware,
Illinois, New Hampshire, and Vermont). In one
state, Missouri, arrest rates actually increased after
decriminalization.
Marijuana sales arrests also dropped in
decriminalized states from 2010 to 2018, although
to a much lesser extent than in legalized states. In
states that decriminalized marijuana between the
years of 2010 and 2018, sales arrest rates went from
37.8 per 100,000 people down to 24.5 per 100,000 by
2018 — a 35.1% drop. For comparison, even in states
where marijuana remained fully illegal, there was on
average a 13.2% decrease in marijuana sales arrests
from 2010 to 2018. Similar to legalized states, arrest
rates of all other drugs appear generally unassociated
FIGURE 8
Drug Arrests in All States that Decriminalized Marijuana (between 2010–2017)
...
All Other Drugs +
Marijuana Possession
Connecticut
8,000
Delaware
3,000
2,500
2,000
1,500
1,000
6,000
4,000
2,000
Maryland
24,000
22,000
20,000
18,000
16,000
14,000
Illinois
25,000
20,000
15,000
10,000
5,000
New Hampshire
Missouri
24,000
4,000
21,000
3,000
18,000
2,000
15,000
2010 2012 2014 2016 2018
Rhode Island
Vermont
1,200
2,000
900
1,500
600
1,000
300
500
2010 2012 2014 2016 2018
2010 2012 2014 2016 2018
Source: FBI/Uniform Crime Reporting Program Data
with the decriminalization of marijuana possession
(see also Figure 8).
Across the country, considering both possession and
sale offenses, states that legalized marijuana have
seen larger average decreases in marijuana arrest
rates than states that only decriminalized marijuana.
A Tale of Two Countries: Racially Targeted Arrests in the Era of Marijuana Reform
27
Racial Disparities in
Marijuana Arrests
As legalization efforts take hold in states across the nation, it is critical to continue
examining the extent of racial bias in the enforcement of marijuana laws, specifically
against Black and Latinx populations.48 In order to ground legalization efforts in
racial justice, we must understand the impact of reforms on racial inequities in drug
enforcement. Thus, in this report, we examine racial disparities not only at the national,
state, and county level, as we did in our 2013 report,49 but also specifically among states
that have legalized or decriminalized marijuana.
Because the FBI’s Uniform Crime Reporting (UCR)
Program data, like many federal data collection
efforts, treats Latinx as an ethnicity rather than
a distinct racial group, Latinx individuals are
incorporated into both white and Black arrest rates.
Thus, because the UCR data used for this report does
not identify Latinx populations as a distinct racial
group, potential disparities in arrest rates for Latinx
populations cannot be examined (see Methodology
and Limitations section for more information).
We are mindful that in addition to Latinx groups,
racial bias in policing and drug enforcement may
negatively affect other racial or ethnic groups, such
as Native and Indigenous populations, Arab and
Middle Eastern populations, Asian populations,
Pacific Islander populations, and those with multiple
racial/ethnic identities (e.g., biracial populations),
among others. Improved data collection tools and
more in-depth research into the specific experiences
of these groups as related to drug enforcement is
clearly necessary. However, given the focus of this
report and the limitations of the most current and
comprehensive available data (UCR), we provide data
28
ACLU Research Report
FIGURE 9
Usage of Marijuana For Ages 12+ (2018)
Lifetime use
Past year use
Past month use
50.7%
.
Black
White
■
Black
16.5%
White
•
Black
10.3%
White
Source: SAMHSA, U.S. Department of Health and Human Services
explicitly on Black-white disparities in marijuana
possession arrests.
For this report, racial disparities in policing and
enforcement of marijuana possession laws were
quantified by comparing arrest rates in the Black
population to arrest rates in the white population.
By dividing the arrest rate in the Black population
by the arrest rate in the white population, we can
estimate how much more likely Black people are than
white people to be arrested for marijuana possession,
known as the “rate ratio” (see the Methodology and
Limitations section for more details on how the rate
ratio was calculated). A rate ratio of one indicates
that Black individuals and white individuals are
arrested at the same rate. A rate ratio greater than one
indicates how much more likely Black populations are
than white populations to be arrested for marijuana
possession — for example, a rate ratio of three
indicates that Black people are three times more
likely than white people to be arrested for marijuana
possession. A rate ratio of less than one indicates
that white people are more likely than Black people in
a given state or county to be arrested for marijuana
possession.
Despite the pronounced disparities in arrest rates
for marijuana possession between Black and
white people demonstrated in this report, rates
of marijuana use are roughly equal between Black
and white people. The Substance Abuse and Mental
Health Services Administration (SAMHSA), a
federal branch of the U.S. Department of Health and
Human Services, conducts nationally representative
FIGURE 10
Rates of Black and White Marijuana Possession
Arrests per 100k people
Black arrest rate
600
400
White arrest rate
200
0
2010
2012
2014
2016
2018
Source: FBI/Uniform Crime Reporting Program Data and U.S. Census Data
Note: Florida and Washington, D.C. did not provide data.
annual surveys of marijuana use over respondents’
lifetime, over the past year, and over the past month.50
SAMSHA survey data consistently finds that rates
of ever use and recent use by race do not significantly
differ between Black and white populations (see
Figure 9 for 2018 usage rates). Therefore, the wide
racial disparities in marijuana possession arrest
rates cannot be explained by differences in marijuana
usage rates between Black and white people.
TABLE 6
Black and White Marijuana Possession Rates
(2010-2018)
Arrest Rates per 100k
Year
Marijuana
Possession
Arrest Rate
Black
Arrest
Rate
White
Arrest
Rate
Black/
White
Rate
Ratio
2010
250.52
659.06
199.19
3.31
2011
229.69
624.43
178.43
3.50
2012
217.79
601.68
168.75
3.57
2013
253.51
625.68
212.55
2.94
2014
199.40
552.13
155.80
3.54
2015
174.06
459.89
138.90
3.31
2016
179.99
477.64
143.42
3.33
2017
207.44
560.08
160.60
3.49
2018
203.88
567.51
156.06
3.64
The National Landscape
Enormous disparities exist nationwide between
arrest rates of Blacks and whites for marijuana
possession. Despite using marijuana at similar rates
(see Figure 9), Black people are 3.64 times more
likely than white people to be arrested for marijuana
possession. In 2018, 567 Black people per 100,000
were arrested for marijuana possession, compared to
156 white people per 100,000 (see Figure 10). While
national arrest rates for marijuana possession have
fallen for both Black and white individuals since 2010,
the rate ratio has not improved at all. As detailed in
Table 6, in 2010, Black people were 3.31 times more
likely to be arrested for marijuana possession than
whites, and in 2018, they were 3.64 times more likely —
the greatest disparity of the past nine years.
Source: FBI/Uniform Crime Reporting Program Data and U.S. Census Data
A Tale of Two Countries: Racially Targeted Arrests in the Era of Marijuana Reform
29
State and County Landscape
States
Although overall arrest rates and the extent of
racial disparities in arrests varied across states, in
every single state, Black people were more likely to
be arrested for marijuana possession than white
people. Figure 11 displays a map of racial disparities
in marijuana possession arrests by state — darker
red states have higher arrest rate ratios between
Black and white individuals than lighter red states.
The darkest red states (Montana, Kentucky, Illinois,
West Virginia, and Iowa) had the highest racial
disparities in marijuana possession arrest rates in
2018 (9.62, 9.36, 7.51, 7.31, and 7.26, respectively).
Table 7 provides the overall marijuana possession
arrest rate, the arrest rates for the Black and white
populations, and the rate ratios between Black and
white arrests, a measure of the disparity between the
two populations, for each state. States are ordered by
their rate ratio. In 2018, Montana was the state with
the highest rate of racial disparities between Black
and white people, with a rate ratio of 9.62, indicating
that Black people in that state were 9.62 times more
likely to be arrested for marijuana possession than
white people.
Although Montana had the greatest racial disparities,
Wyoming had the highest arrest rate for Black people
specifically (see Figure 12 for the 20 states with
the highest Black arrest rates). In 2018, Wyoming
arrested 2,677 Black people out of every 100,000.
Georgia was the state with the highest overall number
of Black arrests for marijuana possession, with
27,381 arrests in the year 2018 alone (see Appendix,
Table B for total number of Black marijuana
possession arrests, by state).
Although racial disparities have decreased in some
states since 2010, they have actually worsened in a
FIGURE 11
Black-to-White Rate Ratios for Marijuana Possession Arrests by State (2018)
Darker red states have higher rate ratios of arrest between Black and
white individuals than lighter red states
AK
HI
Ox
30
2x
4x
6x
Bx
ACLU Research Report
10x
Source: FBI/Uniform Crime Reporting Program Data and U.S. Census Data
Note: Florida and Washington, D.C. did not provide data.
majority of states. In 31 states, racial disparities
were larger in 2018 than in 2010; in 18 states, racial
disparities were narrower than in 2010.51 In 20 states,
racial disparities in marijuana possession arrests
increased by 25% or more (see Figure 13). As shown
in Figure 13, the states with the greatest growth
FIGURE 12
States With Highest Black Arrest Rates for Marijuana Possession (2018)
Per 100k Black people
Wyoming
West Virginia
South Dakota
Utah
North Dakota
South Carolina
Nebraska
Wisconsin
Montana
Idaho
New Jersey
New Mexico
Tennessee
Georgia
New Hampshire
Louisiana
Kentucky
Missouri
Iowa
Virginia
Source: FBI/Uniform Crime Reporting Program Data and U.S. Census Data
FIGURE 13
States With Largest Increases in Racial Disparities (Since 2010)
Montana
New Mexico
Illinois
Maine
Hawai'i
New Hampshire
Wyoming
Kentucky
West Virginia
Vermont
Oklahoma
Delaware
Idaho
Arizona
Rhode Island
Utah
North Dakota
South Carolina
New Jersey
Virginia
0%
25%
50%
75%
100%
125%
150%
175%
200%
Source: FBI/Uniform Crime Reporting Program Data and U.S. Census Data
A Tale of Two Countries: Racially Targeted Arrests in the Era of Marijuana Reform
31
TABLE 7
Black and White
Marijuana Possession
Arrests Rates and
Disparities by State
(2018)
Source: FBI/Uniform Crime Reporting
Program Data and U.S. Census Data
Note: Florida and Washington, D.C. did
not provide data.
32
ACLU Research Report
Arrest Rates per 100k
State
Montana
Kentucky
Illinois
West Virginia
Iowa
Vermont
North Dakota
Minnesota
Wyoming
South Dakota
Utah
Kansas
Oklahoma
Wisconsin
Delaware
Alabama
New Hampshire
Massachusetts
Connecticut
Maine
New Mexico
Idaho
Michigan
Indiana
New Jersey
South Carolina
Virginia
Ohio
Louisiana
Rhode Island
North Carolina
Tennessee
Nebraska
Arizona
Nevada
Pennsylvania
Georgia
Mississippi
Missouri
New York
Texas
Arkansas
Washington
Maryland
Oregon
California
Hawai‘i
Alaska
Colorado
Marijuana
Possession
Arrest Rate
Black Arrest
Rate
White Arrest
Rate
Black/White
Rate Ratio
127.62
141.72
43.01
447.32
133.82
21.54
332.52
126.71
592.89
707.34
343.37
80.56
199.25
324.37
89.33
55.82
202.10
4.52
49.85
54.99
225.71
332.16
140.95
247.61
369.54
673.26
314.33
248.68
412.48
37.80
234.85
343.94
409.42
208.75
76.65
226.52
428.81
294.78
340.28
287.76
244.12
322.12
25.90
279.40
69.54
9.14
55.78
53.35
82.20
1064.23
788.34
137.84
2516.95
776.28
126.26
1437.25
536.94
2677.27
2151.53
1526.97
323.84
719.47
1125.85
222.45
128.03
803.40
14.76
152.57
214.84
837.21
1026.94
373.80
712.06
1007.96
1420.68
768.01
526.73
795.52
110.17
528.27
820.16
1163.94
580.65
212.26
577.96
804.32
478.88
780.94
597.59
561.60
648.46
52.18
470.16
130.90
18.12
130.90
70.82
130.51
110.60
84.19
18.36
344.26
106.90
20.83
260.99
100.02
515.27
426.79
310.43
66.94
169.62
265.58
53.57
31.01
195.28
3.65
37.91
53.89
210.54
263.83
104.06
204.01
292.49
412.27
223.37
153.48
237.31
33.17
162.03
255.09
379.73
190.90
69.72
190.40
271.82
176.39
296.38
227.53
213.99
271.21
24.44
220.74
71.74
10.00
73.42
45.40
84.90
9.62
9.36
7.51
7.31
7.26
6.06
5.51
5.37
5.20
5.04
4.92
4.84
4.24
4.24
4.15
4.13
4.11
4.04
4.02
3.99
3.98
3.89
3.59
3.49
3.45
3.45
3.44
3.43
3.35
3.32
3.26
3.22
3.07
3.04
3.04
3.04
2.96
2.71
2.63
2.63
2.62
2.39
2.14
2.13
1.82
1.81
1.78
1.56
1.54
in racial disparities — Montana, New Mexico, and
Illinois — each had an increase in Black-white arrest
disparities of more than 100% (increases of 175.6%,
118.7%, and 118.3%, respectively).
Counties
In 2018, 96.1% of these counties (1,081 counties total)
had a rate ratio greater than one, indicating a higher
likelihood of arrest for Black people than white
people. Put another way, in less than 5% of these
counties was the rate ratio equal to or lower than one —
i.e., white people were as likely as or more likely than
Black people to be arrested for marijuana possession.
Figure 14 displays the range of disparities by county —
in almost all counties (96.1%), Black people were more
likely than white people to be arrested for marijuana
possession. In a sizable proportion of these counties,
Black people were between two and 10 times more
likely than whites to be arrested for marijuana. They
were up to 20 times more likely to be arrested in a
small number of other counties (see also Figure 14).
The racial disparities found at the state level exist
at the county level, as well. In the overwhelming
majority of counties across the U.S., Black people
were more likely to be arrested for marijuana
possession than white people. When ranking countylevel racial disparities, we considered counties with
populations greater than 30,000, greater than 1%
Black population, and more than 50% data coverage,52
which contain 81% of the U.S. population.
Table 8 lists the 20 counties with the highest racial
disparities, or rate ratios, between Black and white
arrests for marijuana possession. The highest
racial disparities can be found in Franklin County,
Massachusetts, where Black people were more than
100 times more likely to be arrested for marijuana
possession than white people (rate ratio of 116.5).
Franklin County had also had sharpest increase in
disparities from 2010–2018 — 1,476% (see Table 9). In
These findings, combined with findings on changes
in arrest rates from 2010–2018, demonstrate that
falling arrest rates do not automatically lead to a
reduction in racial disparities — in fact, in some
states, racial disparities rose even as arrest rates
fell (see Appendix, Table A for changes in racial
disparities and arrest rates, over time by state).
FIGURE 14
Distribution of County-Level Black-to-White Rates of Racial Disparities (2018)
Most counties arrested Black people for marijuana possession at 3 to 5 times the rate of white people
200 counties
150
100
50
111 ......... __ _-------
0
1x
10x
20x
30x
Source: FBI/Uniform Crime Reporting Program Data and U.S. Census Data
Note: Includes counties with > 30,000 population, > 1% Black population and > 50% UCR coverage.
An additional 8 counties with rate ratios above 30x were removed.
A Tale of Two Countries: Racially Targeted Arrests in the Era of Marijuana Reform
33
TABLE 8
Top 20 Counties for Racial Disparities in Marijuana Possession Arrests (2018)
Arrest Rates per 100k
County
State
Black Arrest Rate
White Arrest Rate
Black/White
Rate Ratio
Franklin
Massachusetts
489.94
4.21
116.50
Pickens
Georgia
31,243.16
321.38
97.22
DeKalb
Alabama
1,159.80
25.57
45.35
Tazewell
Illinois
682.21
15.76
43.30
Blount
Alabama
267.21
7.35
36.35
Ozaukee
Wisconsin
5,548.04
158.98
34.90
Ogle
Illinois
635.93
18.38
34.60
Henry
Illinois
838.57
25.57
32.80
Manitowoc
Wisconsin
7,862.33
263.44
29.85
Perry
Pennsylvania
21,158.65
746.03
28.36
Washington
Wisconsin
6,164.84
227.70
27.07
Washington
Ohio
4,477.05
166.34
26.91
Clarion
Pennsylvania
4,651.16
181.54
25.62
Medina
Ohio
3,166.91
125.82
25.17
Preston
West Virginia
11,558.56
463.02
24.96
Putnam
West Virginia
5,284.23
213.36
24.77
Peoria
Illinois
326.50
13.52
24.16
Adams
Illinois
118.20
4.92
24.03
Waukesha
Wisconsin
3,314.30
138.78
23.88
Douglas
Nevada
4,969.82
226.80
21.91
Source: FBI/Uniform Crime Reporting Program Data and U.S. Census Data
Note: Includes counties with > 30,000 population, > 1% Black population and > 50% UCR coverage.
terms of highest overall rate of Black people arrested
in 2018, Pickens County, Georgia, leads the counties
with a rate of 31,243.16 per 100,000, followed by
Perry County, Pennsylvania, with 21,158.65 per
100,000. Lastly, a full one-fourth (5) of the top 20
counties for racial disparities in 2018 were located in
Illinois (see also Table 8).
States That Legalized or
Decriminalized Marijuana
Possession
As reported in the previous section, the total number
of people arrested for marijuana possession, and
rates of arrests, have decreased in all legalized
states and most decriminalized states. These rates
34
ACLU Research Report
decreased for both Black and white populations, yet
the racial disparities in arrest rates persist. In every
state that has legalized or decriminalized marijuana
possession, Black people are still more likely to be
arrested for possession than white people.
As shown in Figure 15, on average, states that
legalized marijuana possession had lower racial
disparities in possession arrests in 2018 than
states where marijuana remained fully illegal, as
well as states that decriminalized. However, it is
not clear that these lower racial disparities are a
result of legalization, given the fact that the states
that legalized also had lower racial disparities in
the years prior to legalization. It is worth noting
that, on average, racial disparities in states that
decriminalized were relatively similar to disparities
in states that were fully illegal (see also Figure 15).
TABLE 9
20 Counties With Largest Increases in Racial Disparities in Marijuana Possession Arrests
(2010–2018)
County
State
2010
2018
Percent Increase
Franklin
Carter
Massachusetts
7.39
116.50
1,476.5%
Tennessee
1.29
13.89
976.7%
Washington
Virginia
1.34
12.22
811.9%
Hampshire
Massachusetts
2.32
18.28
687.9%
Shelby
Kentucky
1.76
11.99
581.2%
Mason
Washington
1.26
8.57
580.2%
Marion
Illinois
2.69
18.03
570.3%
Berkshire
Massachusetts
1.99
12.97
551.8%
Isabella
Michigan
2.36
14.90
531.4%
Ozaukee
Wisconsin
6.20
34.90
462.9%
Clark
Kentucky
1.14
6.41
462.3%
Santa Fe
New Mexico
2.51
13.65
443.8%
Hanover
Virginia
3.92
20.74
429.1%
Rogers
Oklahoma
1.75
9.13
421.7%
Catoosa
Georgia
2.56
13.25
417.6%
Granville
North Carolina
2.31
11.69
406.1%
Frederick
Virginia
1.37
6.92
405.1%
Schoharie
New York
2.44
11.99
391.4%
DeKalb
Alabama
9.23
45.35
391.3%
Alexander
North Carolina
2.61
12.53
380.1%
Source: FBI/Uniform Crime Reporting Program Data and U.S. Census Data
Note: Includes counties with > 30,000 population, > 1% Black population and > 50% UCR coverage.
The absolute difference between Black and white
arrest rates was narrower in legalized states at
the end of the decade than at the beginning, but
racial disparities remain in every legalized state
and every decriminalized state (see Figures 16
and 17; the red line on state graphs indicates when
legalization or decriminalization occurred). In
some legalized states, the disparities actually got
worse. For example, Maine went from a disparity of
2.1 in 2010 to 4.0 in 2018. In other legalized states,
the disparities did improve, dropping from 4.0
to 3.0 in Nevada and from 2.2 to 1.8 in California,
for example. These results clearly indicate that
neither decriminalization nor legalization of
marijuana possession alone eliminates the
disproportionate criminalization of Black people
in marijuana regulation and enforcement. Further
FIGURE 15
Times More Likely Black People Arrested for
Marijuana Possession by Legal Status (2010–2018)
Fully Illegal Before 2018
2010
2018
Decriminalized Before 2018
2010
2018
Legal Before 2018
2010
2018
Source: FBI/Uniform Crime Reporting Program Data and U.S. Census Data
research is warranted to better understand why
these disparities narrowed in some states and
widened in others.
A Tale of Two Countries: Racially Targeted Arrests in the Era of Marijuana Reform
35
FIGURE 16
Racial Disparities in States With Legalized Marijuana (Before 2018)
Ala ka
California
Colorado
3.5x
3x
2x
2.25x
2.5x
1.75x
2x
1.5x
1.75x
2x
1.5x
1.5x
Maine
Massachusetts
4x
3.5x
3x
Nevada
4x
5x
3.5x
4.5x
4x
3x
2.5x
3.5x
2x
2.5x
3x
2010
Oregon
2012
2014
2016
2018
Washington
2x
2.4x
1.75x
2.2x
1.5x
2x
1.25x
2010
2012
2014
2016
2018
2010
2012
2014
2016
Source: FBI/Uniform Crime Reporting
Program Data and U.S. Census Data
2018
FIGURE 17
Racial Disparities in States That Decriminalized Marijuana (Between 2010–2017)
Connecticut
Delaware
Illinois
4.1x
4x
4x
3.9x
7x
6x
3.6x
3.8x
5x
3.2x
3.7x
4x
3.6x
Maryland
Missouri
New Hampshire
3x
3x
4x
2.8x
3.5x
2.6x
2.5x
3x
2.4x
2x
2.5x
2.2x
2010
Rhode Island
2012
2014
2016
2018
Vermont
3.4x
10x
3.2x
Bx
3x
6x
2.8x
4x
2.6x
2010
36
2012
2014
2016
ACLU Research Report
2018
2010
2012
2014
2016
2018
Source: FBI/Uniform Crime Reporting
Program Data and U.S. Census Data
Conclusion
Findings detailed in this report reveal an uncomfortable truth: While there has been some
progress in scaling back the war on people who use marijuana, it is still wreaking havoc in
much of the U.S. Despite decades of failure, prohibition and punitiveness generally remain
the centerpiece of governments’ approach to drug use. Law enforcement continues to
make hundreds of thousands of marijuana possession arrests every year, accounting for
almost half of all drug arrests nationwide. Furthermore, although marijuana possession
arrest rates were lower nationally in 2018 than in 2010, the initial decline of the first part
of the decade appears to have stagnated, or even reversed. As disturbingly, this report also
finds that marijuana enforcement remains as racialized as ever, notwithstanding similar
underlying usage rates. In 2018 — unchanged from 2010 — Black people were still nearly
4 times more likely than white people to get arrested for marijuana possession, despite
similar usage rates.
Our findings indicate that states that legalized or
decriminalized marijuana have enjoyed a reduction
of marijuana possession arrests between 2010 and
2018, and a significantly greater reduction than in
states where marijuana remains illegal. Arrests for
marijuana sales also decreased greatly from 2010 to
2018 in states that legalized marijuana. However, it
is also clear from the findings that most jurisdictions
that have enacted progressive marijuana policy have
failed to do so from a foundation of racial justice. As
such, though legalization and decriminalization
appear to reduce the overall number of marijuana
possession arrests for Black and white people alike,
such laws have not substantially reduced, let alone
eliminated, the significantly larger arrest rates of
Black people.
States that legalized
or decriminalized
marijuana have
have enjoyed
a reduction
of marijuana
possession arrests.
A Tale of Two Countries: Racially Targeted Arrests in the Era of Marijuana Reform
37
This report also finds that there is wide variation in
marijuana enforcement not only between states, but
also within states, as measured by both the number
of arrests and the attendant racial disparities.
Progress reducing such arrests and disparities over
the past decade also varies significantly. The one
common finding across every state and the vast
majority of counties is that Black people are more
likely to be arrested for possessing marijuana than
white people, regardless of whether possession is
illegal, legal, or decriminalized in their state.
The U.S. has waged a failed, devastating, decadeslong war on drugs, including marijuana, in specific
communities. Rounding up hundreds of thousands
of people every year — millions every decade — for
marijuana offenses, this racist campaign has
caused profound and far-reaching harm on the
people arrested, convicted, and/or incarcerated
for marijuana offenses. It has been a colossal waste
of money and law enforcement resources that has
only deepened the divide between communities and
their governments and increased public hurt rather
than safety. Such harm cannot be undone, but as a
country we can acknowledge, repair, and rebuild so
that our future looks nothing like our prohibitionist
past. It is long past due for the U.S. to end marijuana
prohibition, and to do so in a way that confronts
head-on the stark racial inequities in marijuana
enforcement and grounds legalization in racial
justice.
38
ACLU Research Report
Recommendations
As the ACLU recommended in our original report in 2013, the most effective way to eliminate
arrests for marijuana use and possession, and the racial disparities that plague such arrests, is
through marijuana legalization.53 If legalization is not yet achievable, states should, at a minimum,
decriminalize marijuana offenses. Based on the findings from this report, racial equity should
be centered in every aspect of the legalization and decriminalization process. States must also
improve their data collection practices and policies with regard to arrests by race. We cannot
undo the harms perpetuated by marijuana prohibition, but we can chart a smarter, fairer future
that uplifts and repairs the people and communities most harmed by criminalization.
Recommendations at a Glance
For Federal, State, and Local
Governments
• Legalize marijuana use and possession
For Law Enforcement Agencies
• End the enforcement of marijuana
possession and distribution
• Do not replace marijuana prohibition
with a system of fines, fees, and arrests
• End racial profiling by police
• Grant clemency to or resentence anyone
incarcerated on a marijuana conviction
and expunge all marijuana convictions
• End the practice of using raw numbers of
stops, citations, summons, and arrests as a
metric to measure productivity and efficacy
• Eliminate collateral consequences
that result from marijuana arrests or
convictions
• Develop systems for the routine collection
of accurate data on a range of police
practices
• Ensure new legal markets benefit and
are accessible to communities most
harmed by the War on Drugs
• Invest in nonpunitive programs and
community-based services and divest from
law enforcement
• Ensure marijuana possession and
other low-level offense arrests are not
included in performance measures for
federal funding
• Develop, secure, and implement strong,
independent, and effective oversight
mechanisms for local law enforcement
• Eliminate consent searches
A Tale of Two Countries: Racially Targeted Arrests in the Era of Marijuana Reform
39
Federal, State, and Local
Governments
1. Legalize marijuana use and
possession.
The federal government should remove marijuana
from the Controlled Substances Act; until it does, it
should not enforce marijuana offenses.
States should legalize marijuana through a system
of taxation, licensing, and regulation under which
private businesses licensed and regulated by the
state can sell marijuana. This mode of legalization
offers numerous benefits; it would largely address
the arrests epidemic and — if centered in racial
equity — its attendant racial disparities by removing
marijuana possession and use from the criminal
justice system. Further, it would save cash-strapped
state and local governments millions of dollars in
decreased police, jail, and court costs that could be
redirected toward repairing the harms of the War on
Drugs.
As a society, we permit the controlled use of alcohol
and tobacco, substances that can be dangerous to
health and, at times, public safety. We educate society
about those dangers and have constructed a system
of laws that allow for the use and possession of these
substances while seeking to protect the public from
their dangers. Particularly given the findings of this
report, states that have not legalized should create
similar systems for legalizing marijuana use and
possession.54
In addition, while legalization and decriminalization
significantly lower the overall numbers of marijuana
arrests, some states have seen an even steeper rise
in the proportion of Black people whose lives are
impacted by a marijuana arrest.55 This indicates
that it is critical that states’ legalization schemes
must be equitable and grounded in racial justice.
The recommendations in this report are vital to
instill equity into the legalization process and to
40
ACLU Research Report
It is critical that
states’ legalization
schemes must
be equitable and
grounded in racial
justice.
help ensure that racial disparities do not continue
post-legalization.
Further, some states have seen a rise in youth arrests
for marijuana.56 It is vital that when states legalize
for adults, they do not continue to criminalize
youth. They should also decriminalize marijuanarelated activities for youth. Instead of the continued
criminalization of young people, jurisdictions that
legalize, decriminalize, or depenalize youth offenses
should provide alternatives to criminal intervention
such as drug education programs or community
service. If drug education programs are provided as
an alternative, they should be scientifically accurate
about the harms of drugs and sympathetic toward the
young people in the program who may have used and/
or sold drugs.
2. Do not replace marijuana
prohibition with a system of fines,
fees, and arrests.
We should not replace a criminal system with fines
and fees that create a modern-day debtors’ prison. It
is important to recognize that replacing marijuana
arrests with fees, fines, or tickets is not an ideal
solution for a number of reasons. First, the same
racial disparities that exist nationwide in arrests for
marijuana possession would likely be replicated in
citations for civil offenses for marijuana possession.
Second, the monetary fines that accompany civil
offenses can place a substantial burden on those fined,
particularly the young, poor, and people of color — all
of whom are disproportionately targeted by police.
Third, individuals who are unable to make payments
in a timely fashion, or at all, or who do not appear
in court to answer to the civil charge, are subject to
arrest — often by a warrant squad — which results
in individuals being brought to court and in some
cases jailed for failing to pay the fines or to appear. In
addition to placing significant personal and financial
burdens on the individual, this imposes significant
costs on the state, possibly exceeding the original
fine imposed. All fees, taxes, and surcharges that are
imposed for the purpose of recouping operating costs
should be repealed.
While fees should never be implemented, if fines
must be, they should be proportionate, both in terms
of individual income and severity of the offense,
and they should impose an equitable burden on
people regardless of income level. In the case of
nonpayment, there should be limited penalties for
failure to pay. At a bare minimum, “ability to pay”
hearings should be required before the imposition
of any fines or fees, and any preexisting laws that
tie the hands of judges who wish to reduce or waive
fines should be repealed.57 For those who cannot pay,
there should be mechanisms in place for proactively
requesting a reduction or waiver based on financial
circumstances prior to default.58 In the case of
Legalization must
come with processes
for clemency,
resentencing, and
expungement to
reflect the change
in law.
nonpayment, penalties should be limited and under
no circumstances should they result in incarceration,
suspension or revocation of driver’s licenses,
disenfranchisement, extension or revocation of
probation, parole or any other form of supervision, or
additional monetary penalties.59 Finally, because of
the discriminatory impact of fines and fees and their
massive impact, outstanding debt for marijuana fines
and fees should be forgiven with legalization.
3. Include clemency, resentencing,
and expungement processes in
legalization efforts.
While progress in reforming our nation’s drug laws is
vital, we must remember that if we legalize marijuana
without righting the wrongs of past enforcement,
we risk reinforcing the decades of disproportionate
harm communities of color have endured. That is why
legalization must come with processes for clemency,
resentencing, and expungement to reflect the change
in law. No one should be incarcerated on a marijuana
offense. And having a marijuana conviction on your
record can make it difficult to secure and maintain
employment, housing, or secure government
assistance for the rest of your life.60 If we believe that
marijuana is not worthy of criminal intervention,
then it is only right we stop the suffering inflicted on
people by marijuana prosecution, especially since
we know it disproportionately falls on the shoulders
of low-income communities and communities of
color. Clemency, resentencing, and expungement
processes should be speedy, automatic, and provided
at no cost to the person who is being granted
clemency or resentencing or whose record is being
expunged.
Illinois, California, and others have instituted
expungement and resentencing processes
concurrently with or following legalization, giving us
a model of successful tactics as well as roadblocks to
clearing people’s records. The categories of offenses
eligible for automatic clemency, resentencing,
or expungement should be wide, and include as
many people and types of offense as possible. This
A Tale of Two Countries: Racially Targeted Arrests in the Era of Marijuana Reform
41
means ensuring that the burden is placed on the
government, not the people, to begin the process of
expunging marijuana records and granting clemency
and resentencing to people incarcerated or being
punished for marijuana offenses. This process should
be as quick as possible. Every day, week, month,
or year that people spend incarcerated or being
punished for marijuana offenses or that marijuana
records are maintained is a day, week, month, or
year that large numbers of people will struggle to
gain employment, housing, education loans, and
others. An expedient process is burdensome but also
tremendously beneficial. Some localities have found
creative ways to ensure that people are resentenced
or have their records expunged in a timely manner.
Cook County, for example, is using Code for America
to assist in analyzing conviction data to autopopulate
forms for expungement.61 For all those who are not
automatically expunged, the process should be as
quick and cheap as possible.
4. Eliminate collateral
consequences that result from
marijuana arrests or convictions.
No person should be denied public benefits or
suffer other collateral consequences due to
marijuana use, arrest, or conviction. Collateral
consequences can significantly derail many
aspects of a person’s life post arrest, conviction, or
incarceration. As enforcement of marijuana offenses
disproportionately falls on communities of color, so
too does the brunt of collateral consequences and
discrimination on the basis of marijuana use, arrests,
and conviction.
The following collateral consequences and
discriminatory measures should be eliminated with
legalization:
• Denial of public benefits based on use, arrests, or
convictions for marijuana
• Drug tests for benefit eligibility
• Separation of families in the child welfare system
42
ACLU Research Report
• Loss of driver’s licenses
• Deportation
• Loss of federal financial aid
• Bans on participation in the marijuana industry
for those with drug arrests
• Felony disenfranchisement
5. Implement new legal markets to
benefit communities most harmed
by the War on Drugs.
The benefits reaped from emerging legal
marketplaces for marijuana should be shared with
the communities most harmed by the War on Drugs.
We have seen multiple states that prevent those with
drug convictions on their record from participating
in the legal marijuana marketplace, therefore
preventing those most harmed by marijuana
legalization from the profits and employment
that these new markets bring.62 If legislatures
or residents determine that we should no longer
criminalize marijuana because it is ineffective and
disproportionately impacts people of color, then those
most harmed by criminalization should be able to
access the industry.
In addition, legalization should include licensing for
consumption spaces that are open to the public in
order to provide space for legal consumption for those
who live in public housing or rental units that do not
allow consumption or smoking. This is important,
because if legalization occurs without providing
consumption spaces (such as cafes) open to the public,
people who live in rental or public housing have no
place to consume marijuana without risking eviction
or criminalization for public consumption.
Given the history of the War on Drugs and the
devastating harm it has caused communities of
color, it is only just that the tax revenue raised by
the new legal market be put toward repairing these
harms. Revenue can be invested in communities
most harmed by the drug war through programming
The benefits reaped
from emerging legal
marketplaces should
be shared with the
communities most
harmed by the War
on Drugs.
that helps to end the collateral harms of marijuana
prohibition, including barriers to employment, and
supports small businesses owned and/or run by
communities directly impacted by the War on Drugs.
Finally, it is important to create fair licensing
structures in which the cost of obtaining a license is
reasonable and accessible to small business owners
and to the communities most impacted by the War
on Drugs. It should not take an exorbitant amount of
money to be able to profit from the new legal market,
and the communities most impacted by the failed
War on Drugs should be able to participate in and
profit from the emerging industry.
6. Ensure marijuana possession
and other low-level offense arrests
are not included in performance
measures of law enforcement
agencies for federal funding.
Federal government grants, including the Byrne
Justice Assistance Grants (or Byrne JAG), should
not include arrest numbers in their performance
measures. As long as arrest statistics — which include
any arrest, including any drug arrest — are included
in law enforcement’s performance measures, police
departments are likely encouraged to increase
their arrest numbers by targeting their resources
on people who commit low-level offenses, including
low-level drug users, possessors, and distributors.
By including marijuana possession arrests and
other low-level offense arrests in performance
assessments of a state’s use of federal funds, the
federal government is relying upon an unreliable
measure of law enforcement’s ability to increase
public safety and reduce the exploitative trafficking
of drugs. Indeed, such arrests reduce neither the use
nor availability of marijuana.
Law Enforcement Agencies
1. End the enforcement of laws
criminalizing marijuana possession
and distribution.
Aggressive enforcement of low-level offenses such
as marijuana possession unnecessarily funnels
hundreds of thousands of people into the criminal
legal system — primarily young people of color
and particularly Black people. Therefore, police
departments and municipal government entities
should end police enforcement of marijuana
possession and marijuana distribution, as well as
a range of other low-level offenses, such as traffic
infractions and “quality of life” offenses, and work
to address these issues through measures that do
not employ the criminal legal system. If this is not
possible, police departments and local government
entities should make these offenses a low priority for
enforcement.
Over the past decade, certain cities, including Seattle
and San Francisco (prior to legalization), made
marijuana possession their lowest enforcement
priority.63 Such a policy provides local governments
with additional resources to fund public health,
economic, and education initiatives that address the
social challenges at the root of most criminal offenses.
2. End racial profiling.
A Tale of Two Countries: Racially Targeted Arrests in the Era of Marijuana Reform
43
Racial profiling refers to the act of selecting or
targeting a person(s) for law enforcement contact
(including stop, frisk, search, and arrest) based on
the individual’s actual or perceived race, ethnicity, or
national origin rather than a reasonable suspicion
that the individual has or is engaged in criminal
activity. Racial profiling includes policies or
practices (such as broken windows policing) that
have a disparate impact on certain communities —
specifically those of color.
Police interactions with people should be directed
only toward investigating actual threats to public
safety. However, too often, police stop and search
people of color without substantial evidence of
wrongdoing, based on explicit and implicit biases.
Such racial profiling can lead to the aggressive
enforcement of minor offenses in communities of
color, disproportionately and needlessly entangling
people — particularly young people — in the criminal
legal system for offenses that are rarely, if ever,
enforced in more affluent, predominantly white
communities. Police departments should adopt
model racial profiling policies that define racial
profiling, prohibit law enforcement from engaging in
it, and make clear that it is unconstitutional under the
Fourth Amendment.64
A further step that courts and state legislatures
should take is to raise the level of suspicion required
to stop and briefly detain a person against their will
for investigative purposes. The current constitutional
baseline requires a relatively low bar — reasonable
suspicion of criminal activity — for such stops.65
Raising this standard to the same standard as a
regular arrest — probable cause to believe the person
is engaged in criminal activity — would significantly
reduce the number of innocent people detained
and reduce the risks of racial profiling. For similar
reasons, courts and state legislatures should consider
raising the standard for “frisk” searches during
investigative stops by requiring more than mere
“reasonable belief” that someone is armed to carry out
a search of their person.
44
ACLU Research Report
Racial profiling
can lead to the
aggressive
enforcement of
minor offenses
in communities
of color.
Further, police departments as well as local and state
governments should ban pretextual stops, where
police stop someone — often because of the person’s
race or ethnicity — for a minor infraction, such as
a traffic offense, as a pretext to investigate other
possible crimes. Indeed, marijuana possession is
often used as such a pretext.
Police departments should investigate all complaints
in a thorough and timely manner using their
existing resources, if they are not already being
handled by a more effective independent oversight
body (more discussion in the later sections), and
implement appropriate and proportionate discipline
for noncompliance with such policies (including
dismissal).
3. End the use of consent searches.
Consent searches are defined as searches made
by law enforcement based on the consent of the
individual whose person or property is being
searched. Because the legality of the search depends
on the fact of consent rather than any particular
evidentiary showing by the police, police officers use
consent searches to circumvent legal standards that
require most searches to be based on probable cause.
However, the environment in which they seek consent
is inherently coercive, and most policies do not even
require officers to notify the person that it is possible
to refuse consent. They are used overwhelmingly
against people of color, in circumstances where it
is doubtful that the officers would have been able to
justify the search without the legal fiction of consent.
As such, local governments should ban the use of
consent searches through policies and legislation.
and harassment of police; justified frustration and
anger toward our criminal legal system, particularly
policing practices; a de-emphasis on true justice and
healing, including restorative justice and traumainformed responses to harms in communities; and
the funneling of people of color into our criminal legal
system at immense personal cost to individuals and
their families as well as pecuniary cost to taxpayers.
4. End the practice of using raw
numbers of stops, citations,
summons, and arrests as a metric
to measure productivity and
effectiveness.
To move away from evaluating public safety and
police efficacy through arrest numbers, police
departments should reduce the reliance on stops,
citations, summons, and arrests and broaden
their benchmarks of success, relying instead on
measurements such as community satisfaction with
law enforcement; number of complaints filed against
law enforcement; rate of racial disparities in arrests;
and number of serious crimes solved.
Evaluating law enforcement agencies and individual
officers based on the numbers of stops, citations,
summons, and arrests does not properly measure
public safety and health; it also exerts additional
pressure on police officers and departments
to aggressively enforce criminal laws for lowlevel offenses. Including arrests as a measure of
effectiveness and productivity, through COMPSTAT
and similar programs, creates an incentive for
police to selectively target and harass poor and
marginalized communities for enforcement of lowlevel offenses, as such offenses are committed more
frequently than serious, harmful crimes.
When officers are subject to arrest goals or quotas,
making arrests for low-level offenses is the easiest
way to meet these requirements because they are lowresource and less time-intensive than investigating
serious crimes. By relying heavily on numbers
of stops, citations, summons, and arrests, police
departments squander their resources on low-level
offenses. This increases arrest statistics and can
make departments appear productive and highly
active, while discouraging police from reporting and
solving more serious crimes. Further, the pressure
on police officers to “make their numbers” results in
aggressive stops and searches that often fail to meet
constitutional requirements and lead to arrests for
minor offenses, including marijuana possession. The
end results are that overpoliced communities are not
made safer but rather harmed by the routine presence
5. Develop systems for the
routine collection of accurate
data regarding a range of police
practices.
Police should prioritize accountability and
transparency by collecting stop, frisk, search,
citation, and arrest data; making the aggregate data
publicly available and easily accessible; creating
evaluation systems to analyze such data to identify
and address racially biased and harmful practices
and policies; and developing strategies and tactics
that eliminate any form of racial disparities in
enforcement practices.
Whether or not a citation is issued or an arrest is
made, the police officer must document the following
information (in addition to providing the data, time,
and location of the stop as a “receipt” to anyone they
stop or search):
• The demographic information of the individual
stopped (including race, national origin, ethnicity,
age, disability, and gender) and the date, time, and
location of the stop
• The duration and reason for the stop
A Tale of Two Countries: Racially Targeted Arrests in the Era of Marijuana Reform
45
• Whether a search was conducted and for what
reason
• Whether and what type of contraband was
recovered
• The outcome of the encounter (summons, citation,
warning, arrest, no action)
• The identification of the officers involved
To guarantee statewide uniform arrest and citation
documentation, state legislatures should require
all police departments (municipal and state) to
electronically record information regarding stops,
frisks, searches, citations, and arrests by locality,
race, national origin, ethnicity, age, and gender,
share the information with a central state agency,
and publish the data in quarterly reports (on their
website and in print so it is accessible to everyone in
the community). Personally identifiable information
about the individual stopped should not be recorded,
so as not to violate the individual’s right to privacy.
The reports should be easily searchable. Such
transparency will provide the public — community
members, activists, local and state policymakers,
criminologists, lawyers, academics, the media, etc. —
with a meaningful empirical basis for determining
whether any demographics have been targeted and
to raise concerns and propose policy solutions. This
would provide more objective and understandable
information for assessing public safety; inform
discussions about the nature and appropriateness
of police practices and police resources; promote
community safety, trust, and autonomy; and better
ensure accountability of police departments and
individual officers.
6. Invest in nonpunitive programs
and community-based services
rather than the criminal legal
system.
Since the 1980s, the amount of money spent on the
criminal legal system has dramatically outpaced
expenditures on community services (such as
46
ACLU Research Report
housing, schools, jobs, public health, and violence
prevention programs) that help build stable, safe
communities rather than furthering harm by
relying on punitive interventions. State and local
governments spend over $100 billion a year on their
law enforcement agencies. The federal government
supplements funding costs by giving out billions of
dollars’ worth of grants to law enforcement agencies
through DOJ programs such as Byrne JAG.66 Police
should not be given unfettered discretion to redirect
the money saved from halting the enforcement of
low-level offenses toward other types of enforcement;
instead, DOJ should mandate that local governments
and the police put such resources toward nonpunitive
and public health programs that benefit public
safety through measures unrelated to the criminal
legal system. As such, local, state, and federal
governments should work with community members
to limit the role of police in communities of color and
redirect these funds to other services so jurisdictions
can appropriately and adequately address economic,
health, and social problems at their root in ways
that strengthen rather than sabotage impacted
communities.
Local, state,
and federal
governments
should work
with community
members to limit
the role of police
in communities
of color.
7. Implement strong, independent,
and effective oversight mechanisms
for local law enforcement.
A range of government entities on the municipal,
state, and federal levels should work to develop
external oversight agencies that conduct regular
audits and review of police departments and practices,
including marijuana enforcement and racial
disparities in such enforcement and enforcement
more broadly.67 These agencies could take the form
of independent prosecutors, inspectors general,
independent and strong community oversight
boards, or some combination of the three. That
said, community oversight is especially important,
because it ensures the community has autonomy to
oversee and hold law enforcement accountable, as
is appropriate in a democratic society where public
servants serve the people. Any external oversight
agency should regularly analyze data regarding a
police department’s stops, frisks, searches, citations,
and arrests to assess whether there are any racial
disparities in enforcement practices and policies.
Their analyses and findings should be made available
to the public. They should also be given the power to
review and implement policies that are not subject to
a unilateral veto by the mayor, police commissioner,
or police chief.
A Tale of Two Countries: Racially Targeted Arrests in the Era of Marijuana Reform
47
State Profiles
ALABAMA
ACLU
2018 SUMMARY
Black people were
4.1x
Alabama ranks
16th
Arrests for the possession of
marijuana made up
20%
more likely than white
people to be arrested
for marijuana possession
in the nation for largest racial
disparities in arrests for
marijuana possession
of all drug arrests in
the state+
t
Direction of ➔ indicates increase
or decrease since 2010.
ARRESTS OVER TIME
Rates of Black arrest · compared to @5i!¥ih4R} tor
marijuana possession, per 100k people
Black people x
times more likely
to be arrested
2018
128
4.13x
31
Statewide marijuana possession arrest rates compared
to all other drug arrest rates, per 100k people
300
240
180
2010
180
200
3.54x
51
100
0
100
200
Arrests per 100k
120
60
0
2010
2012
2014
2016
2018
BY THE COUNTY
All counties with racial disparities above the
national average {3.64 x)
Counties with the largest racial disparities
Counties with a pop. of >30,000, a Black pop. of >1%, a data coverage
of >50%, and at least 25 marijuana possession arrests are included.
- White Rate
1. DeKalb
2. Lee
3. Baldwin
4. Marshall
5. Tuscaloosa
"
Black Rate
I 26
I 55
4
302
I 35
181
I 26
523
■ 75
Arrests per 100k
Black people x
times more likely
to be arrested
1,160
45.35x
12.84x
8.55x
7.03x
6.93x
ALASKA
ACLU
2018 SUMMARY
Black people were
1.6x
Alaska ranks
48th
Arrests for the possession of
marijuana made up
34%
more likely than white
people to be arrested
for marijuana possession+
in the nation for largest racial
disparities in arrests for
marijuana possession
of all drug arrests in
the state+
Direction of ➔ indicates increase
or decrease since 2010.
ARRESTS OVER TIME
Rates of Black arrest · compared to @5i!¥ih4R} tor
marijuana possession, per 100k people
Black people x
times more likely
to be arrested
2018
71
1.56x
45
Statewide marijuana possession arrest rates compared
to all other drug arrest rates, per 100k people
300
Legalized
240
180
2010
510
600
2.11x
242
300
0
300
600
Arrests per 100k
120
60
0
2010
2012
2014
2016
2018
BY THE BOROUGH
All boroughs with racial disparities above the
national average {3.64 x)
Boroughs
with the largest racial
Counties with
racial disparities
disparities
Boroughs
Counties with a pop. of >20,000,
>30,000, aaBlack
Blackpop.
pop.ofof>1%,
>1%,aadata
datacoverage
coverage
of >50%
arrests
areare
included.
>50%,and
andatatleast
least1025marijuana
marijuanapossession
possession
arrests
included.
- White Rate
1. Juneau City
& Borough
2. Anchorage
Municipality
3. Fairbanks
North Star
82
~
73
■
429
5.26x
2.03x
36
I
I
18
13
Arrests per 100k
Boroughs with missing data are striped.
Black people x
Black
x
times people
more likely
times more likely
to
be
arrested
to be arrested
Black Rate
1.39x
ARIZONA
ACLU
2018 SUMMARY
Black people were
3x
Arizona ranks
34th
Arrests for the possession of
marijuana made up
more likely than white
people to be arrested
for marijuana possession
in the nation for largest racial
disparities in arrests for
marijuana possession
43%
of all drug arrests in
the state+
t
Direction of ➔ indicates increase
or decrease since 2010.
ARRESTS OVER TIME
Rates of Black arrest · compared to @5i!¥ih4R} tor
marijuana possession, per 100k people
Black people x
times more likely
to be arrested
2018
581
3.04x
191
Statewide marijuana possession arrest rates compared
to all other drug arrest rates, per 100k people
400
320
240
2010
705
2.29x
308
160
80
500
0
500
0
Arrests per 100k
2010
2012
2014
2016
2018
BY THE COUNTY
All counties with racial disparities above the
national average {3.64 x)
Counties with the largest racial disparities
Counties with a pop. of >30,000, a Black pop. of >1%, a data coverage
of >50%, and at least 25 marijuana possession arrests are included.
- -•
White Rate
Black Rate
1. Mohave
2. Navajo
3. Maricopa
987
241
508
4. Pinal
5. Yuma
1,733
418
■ 131
518
143
•
Black people x
times more likely
to be arrested
424
119
Arrests per 100k
4.14x
4.10x
3.89x
3.63x
3.56x
ARKANSAS
ACLU
2018 SUMMARY
Black people were
2.4x
Arkansas ranks
42nd
Arrests for the possession of
marijuana made up
49%
more likely than white
people to be arrested
for marijuana possession+
in the nation for largest racial
disparities in arrests for
marijuana possession
of all drug arrests in
the state
t
Direction of ➔ indicates increase
or decrease since 2010.
ARRESTS OVER TIME
Rates of Black arrest · compared to @5i!¥ih4R} tor
marijuana possession, per 100k people
Black people x
times more likely
to be arrested
2018
648
2.39x
271
Statewide marijuana possession arrest rates compared
to all other drug arrest rates, per 100k people
400
320
240
2010
517
3.09x
167
400
0
400
Arrests per 100k
160
80
0
2010
2012
2014
2016
2018
BY THE COUNTY
All counties with racial disparities above the
national average {3.64 x)
Counties with the largest racial disparities
Counties with a pop. of >30,000, a Black pop. of >1%, a data coverage
of >50%, and at least 25 marijuana possession arrests are included.
- -White Rate
1. Crawford
2. Pope
3. Craighead
Black Rate
•
1,375
9.11x
151
1,624
1,475
4.88x
302
437
•
791
168
Arrests per 100k
Counties with missing data are striped.
5.32x
305
4. Washington
5. Lonoke
Black people x
times more likely
to be arrested
2,067
4.73x
4.72x
CALIFORNIA
ACLU
2018 SUMMARY
Black people were
1.8x
California ranks
46th
Arrests for the possession of
marijuana made up
2%
more likely than white
people to be arrested
for marijuana possession+
in the nation for largest racial
disparities in arrests for
marijuana possession
of all drug arrests in
the state+
Direction of ➔ indicates increase
or decrease since 2010.
ARRESTS OVER TIME
Rates of Black arrest · compared to @5i!¥ih4R} tor
marijuana possession, per 100k people
Black people x
times more likely
to be arrested
2018
18
1.81x
10
Statewide marijuana possession arrest rates compared
to all other drug arrest rates, per 100k people
600
Legalized
480
360
2010
370
400
2.17x
170
200
0
200
Arrests per 100k
400
240
120
0
~----•--•--•·--·--•...· --•---·
2010
2012
2014
2016
2018
BY THE COUNTY
All counties with racial disparities above the
national average {3.64 x)
Counties with the largest racial disparities
Counties with a pop. of >30,000, a Black pop. of >1%, a data coverage
of >50%, and at least 25 marijuana possession arrests are included.
- White Rate
Black Rate
1. Siskiyou
2. Shasta
3. Contra Costa
4. Humboldt
5. Alameda
56
89
I 14
•
•
32
I6
I
102
20
30
I7
Arrests per 100k
Black people x
times more likely
to be arrested
453
8.03x
6.42x
5.42x
5.05x
4.09x
COLORADO
ACLU
2018 SUMMARY
Black people were
1.5x
Colorado ranks
49th
Arrests for the possession of
marijuana made up
25%
more likely than white
people to be arrested
for marijuana possession+
in the nation for largest racial
disparities in arrests for
marijuana possession
of all drug arrests in
the state+
Direction of ➔ indicates increase
or decrease since 2010.
ARRESTS OVER TIME
Rates of Black arrest · compared to @5i!¥ih4R} tor
marijuana possession, per 100k people
Black people x
times more likely
to be arrested
2018
131
1.54x
85
Statewide marijuana possession arrest rates compared
to all other drug arrest rates, per 100k people
300
Legalized
I
240
180
2010
407
500
1.84x
221
250
0
250
500
120
60
=~ ~
---I
I
I
0
Arrests per 100k
2010
2012
2014
2016
2018
BY THE COUNTY
All counties with racial disparities above the
national average {3.64 x)
Counties with the largest racial disparities
Counties with a pop. of >30,000, a Black pop. of >1%, a data coverage
of >50%, and at least 25 marijuana possession arrests are included.
- --White Rate
·1.
I
r - ...
'
•
Black Rate
1. Jefferson
4. El Paso
5. Arapahoe
335
89
2. Douglas
3. Larimer
Black people x
times more likely
to be arrested
71
149
60
117
52
127
63
Arrests per 100k
265
3.75x
3.74x
2.49x
2.24x
2.03x
CONNECTICUT
ACLU
2018 SUMMARY
Black people were
4x
Connecticut ranks
19th
Arrests for the possession of
marijuana made up
21%
more likely than white
people to be arrested
for marijuana possession
in the nation for largest racial
disparities in arrests for
marijuana possession
of all drug arrests in
the state+
t
Direction of ➔ indicates increase
or decrease since 2010.
ARRESTS OVER TIME
Rates of Black arrest · compared to @5i!¥ih4R} tor
marijuana possession, per 100k people
Black people x
times more likely
to be arrested
2018
153
4.02x
38
Statewide marijuana possession arrest rates compared
to all other drug arrest rates, per 100k people
300
Decriminalized
240
180
2010
701
3.75x
187
500
0
500
Arrests per 100k
120
60
0
2010
2012
2014
2016
2018
BY THE COUNTY
All counties with racial disparities above the
national average {3.64 x)
Counties with the largest racial disparities
Counties with a pop. of >30,000, a Black pop. of >1%, a data coverage
of >50%, and at least 25 marijuana possession arrests are included.
- •
--White Rate
1. New London
2. Tolland
3. Litchfield
4. Middlesex
5. Fairfield
Black Rate
Black people x
times more likely
to be arrested
167
9.06x
18
229
26
145
23
123
8.78x
6.32x
4.45x
28
152
37
Arrests per 100k
4.12x
DELAWARE
ACLU
2018 SUMMARY
Black people were
4.2x
Delaware ranks
15th
Arrests for the possession of
marijuana made up
more likely than white
people to be arrested
for marijuana possession
in the nation for largest racial
disparities in arrests for
marijuana possession
23%
of all drug arrests in
the state+
t
Direction of ➔ indicates increase
or decrease since 2010.
ARRESTS OVER TIME
Rates of Black arrest · compared to @5i!¥ih4R} tor
marijuana possession, per 100k people
Black people x
times more likely
to be arrested
2018
222
54
4.15x
Statewide marijuana possession arrest rates compared
to all other drug arrest rates, per 100k people
400
Decriminalized
320
240
2010
615
3.00x
205
400
0
400
Arrests per 100k
160
80
0
2010
2012
2014
2016
2018
BY THE COUNTY
All counties with racial disparities above the
national average {3.64 x)
Counties with the largest racial disparities
Counties with a pop. of >30,000, a Black pop. of >1%, a data coverage
of >50%, and at least 25 marijuana possession arrests are included.
- White Rate
Black Rate
360
1. Kent
2. Sussex
3. New Castle
Black people x
times more likely
to be arrested
67
305
-
1111
69
162
■
41
Arrests per 100k
5.38x
4.42x
3.92x
GEORGIA
ACLU
2018 SUMMARY
Black people were
3x
Georgia ranks
37th
Arrests for the possession of
marijuana made up
more likely than white
people to be arrested
for marijuana possession
in the nation for largest racial
disparities in arrests for
marijuana possession
52%
of all drug arrests in
the state+
t
Direction of ➔ indicates increase
or decrease since 2010.
ARRESTS OVER TIME
Rates of Black arrest · compared to @5i!¥ih4R} tor
marijuana possession, per 100k people
Black people x
times more likely
to be arrested
2018
804
2.96x
272
Statewide marijuana possession arrest rates compared
to all other drug arrest rates, per 100k people
500
400
300
2010
684
2.92x
234
200
100
500
0
500
Arrests per 100k
0
2010
2012
2014
2016
2018
BY THE COUNTY
All counties with racial disparities above the
national average {3.64 x)
Counties with the largest racial disparities
Counties with a pop. of >30,000, a Black pop. of >1%, a data coverage
of >50%, and at least 25 marijuana possession arrests are included.
- -White Rate
1. Pickens
2. Walker
3. Jackson
4. Habersham
5. Catoosa
Black Rate
I 321
4,676
I 217
2,941
173
4,456
I 290
I
1,455
110
Arrests per 100k
Counties with missing data are striped.
Black people x
times more likely
to be arrested
31,243
97.22x
21.56x
16.96x
15.38x
13.25x
HAWAI‘I
ACLU
2018 SUMMARY
Black people were
1.8x
Hawai‘i ranks
47th
Arrests for the possession of
marijuana made up
more likely than white
people to be arrested
for marijuana possession
in the nation for largest racial
disparities in arrests for
marijuana possession
34%
of all drug arrests in
the state+
t
Direction of ➔ indicates increase
or decrease since 2010.
ARRESTS OVER TIME
Rates of Black arrest · compared to @5i!¥ih4R} tor
marijuana possession, per 100k people
Black people x
times more likely
to be arrested
2018
131
1.78x
73
Statewide marijuana possession arrest rates compared
to all other drug arrest rates, per 100k people
200
160
120
2010
176
200
0.98x
180
100
0
100
200
Arrests per 100k
80
40
0
2010
2012
2014
2016
2018
BY THE COUNTY
All counties with racial disparities above the
national average {3.64 x)
Counties with the largest racial disparities
Counties with a pop.
pop. of
of >30,000,
>30,000,aadata
Black
pop. of of
>1%,
a data
coverage
>50%
andcoverage
at least
of
and possession
at least 25 marijuana
25>50%,
marijuana
arrests are possession
included. arrests are included.
- White Rate
Black Rate
1. Maui
Black people x
times more likely
to be arrested
708
4.05x
175
■
104
2. Honolulu
Counties with missing data are striped.
awai‘i decriminalized marijuana possession in 2019. More recent data is
H
needed to analyze trends since the enactment of the recent law.
I
46
Arrests per 100k
2.29x
IDAHO
ACLU
2018 SUMMARY
Black people were
3.9x
Idaho ranks
22nd
Arrests for the possession of
marijuana made up
more likely than white
people to be arrested
for marijuana possession
in the nation for largest racial
disparities in arrests for
marijuana possession
49%
of all drug arrests in
the state+
t
Direction of ➔ indicates increase
or decrease since 2010.
ARRESTS OVER TIME
Rates of Black arrest · compared to @5i!¥ih4R} tor
marijuana possession, per 100k people
Black people x
times more likely
to be arrested
2018
1,027
3.89x
264
Statewide marijuana possession arrest rates compared
to all other drug arrest rates, per 100k people
400
320
240
2010
657
1,000
2.85x
230
500
0
500
1,000
Arrests per 100k
160
80
0
2010
2012
2014
2016
2018
BY THE COUNTY
All counties with racial disparities above the
national average {3.64 x)
Counties with the largest racial disparities
Counties with a pop.
pop. of
of >30,000,
>30,000,aadata
Black
pop. of of
>1%,
a data
coverage
>50%
andcoverage
at least
of
and possession
at least 25 marijuana
25>50%,
marijuana
arrests are possession
included. arrests are included.
- •
•
White Rate
1. Madison
2,721
1,439
2,041
329
725
I
13.21x
7.41x
194
3. Kootenai
5. Nez Perce
Black people x
times more likely
to be arrested
206
2. Bonner
4. Bingham
Black Rate
6.19x
5.73x
127
1,500
334
Arrests per 100k
4.50x
ILLINOIS
ACLU
2018 SUMMARY
Black people were
7.5x
Illinois ranks
3rd
Arrests for the possession of
marijuana made up
more likely than white
people to be arrested
for marijuana possession
in the nation for largest racial
disparities in arrests for
marijuana possession
16%
of all drug arrests in
the state+
t
Direction of ➔ indicates increase
or decrease since 2010.
ARRESTS OVER TIME
Rates of Black arrest · compared to @5i!¥ih4R} tor
marijuana possession, per 100k people
Black people x
times more likely
to be arrested
2018
138
7.51x
18
Statewide marijuana possession arrest rates compared
to all other drug arrest rates, per 100k people
200
Decriminalized
160
120
2010
448
500
3.44x
130
250
0
250
500
Arrests per 100k
80
40
0
2010
2012
2014
2016
2018
BY THE COUNTY
All counties with racial disparities above the
national average {3.64 x)
Counties with the largest racial disparities
Counties with a pop. of >30,000, a Black pop. of >1%, a data coverage
of >50%, and at least 25 marijuana possession arrests are included.
- White Rate
5. Kane
Counties with missing data are striped.
I llinois legalized marijuana possession in 2019. More recent data is
needed to analyze trends since the enactment of the recent law.
43.30x
16
326
2. Peoria
4. Livingston
Black people x
times more likely
to be arrested
682
1. Tazewell
3. Whiteside
Black Rate
24.16x
14
700
I
36
•
735
51
256
I 21
Arrests per 100k
19.56x
14.36x
12.45x
INDIANA
ACLU
2018 SUMMARY
Black people were
3.5x
Indiana ranks
24th
Arrests for the possession of
marijuana made up
45%
more likely than white
people to be arrested
for marijuana possession+
in the nation for largest racial
disparities in arrests for
marijuana possession
of all drug arrests in
the state+
Direction of ➔ indicates increase
or decrease since 2010.
ARRESTS OVER TIME
Rates of Black arrest · compared to @5i!¥ih4R} tor
marijuana possession, per 100k people
Black people x
times more likely
to be arrested
2018
712
204
3.49x
Statewide marijuana possession arrest rates compared
to all other drug arrest rates, per 100k people
1,300
1,040
780
2010
881
3.73x
236
500
0
500
Arrests per 100k
520
260
0
2010
2012
2014
2016
2018
BY THE COUNTY
All counties with racial disparities above the
national average {3.64 x)
Counties with the largest racial disparities
Counties with a pop. of >30,000, a Black pop. of >1%, a data coverage
of >50%, and at least 25 marijuana possession arrests are included.
- White Rate
1. Boone
2. Shelby
3. Hamilton
4. Hancock
5. Delaware
Black Rate
•
•
•
Black people x
times more likely
to be arrested
2,309
129
2,303
185
1,404
122
I
96
I
111
1,061
936
Arrests per 100k
17.96x
12.48x
11.48x
11.10x
8.44x
IOWA
ACLU
2018 SUMMARY
Black people were
7.3x
Iowa ranks
5th
Arrests for the possession of
marijuana made up
55%
more likely than white
people to be arrested
for marijuana possession+
in the nation for largest racial
disparities in arrests for
marijuana possession
of all drug arrests in
the state+
Direction of ➔ indicates increase
or decrease since 2010.
ARRESTS OVER TIME
Rates of Black arrest · compared to @5i!¥ih4R} tor
marijuana possession, per 100k people
Black people x
times more likely
to be arrested
2018
776
7.26x
107
Statewide marijuana possession arrest rates compared
to all other drug arrest rates, per 100k people
300
240
180
2010
1,458
8.45x
173
1,000
0
1,000
Arrests per 100k
120
60
0
2010
2012
2014
2016
2018
BY THE COUNTY
All counties with racial disparities above the
national average {3.64 x)
Counties with the largest racial disparities
Counties with a pop. of >30,000, a Black pop. of >1%, a data coverage
of >50%, and at least 25 marijuana possession arrests are included.
- White Rate
1. Pottawattamie
2. Dubuque
3. Scott
4. Cerro Gordo
5. Linn
Black Rate
I
I
Black people x
times more likely
to be arrested
1,874
1,530
13.22x
116
824
12.73x
I 65
2,439
215
•
1,412
146
Arrests per 100k
Counties with missing data are striped.
17.59x
107
11.33x
9.65x
KANSAS
ACLU
2018 SUMMARY
Black people were
4.8x
Kansas ranks
12th
Arrests for the possession of
marijuana made up
more likely than white
people to be arrested
for marijuana possession
in the nation for largest racial
disparities in arrests for
marijuana possession
52%
of all drug arrests in
the state
t
t
Direction of ➔ indicates increase
or decrease since 2010.
ARRESTS OVER TIME
Rates of Black arrest · compared to @5i!¥ih4R} tor
marijuana possession, per 100k people
Black people x
times more likely
to be arrested
2018
324
4.84x
67
Statewide marijuana possession arrest rates compared
to all other drug arrest rates, per 100k people
200
160
120
2010
500
500
4.32x
116
250
0
250
500
80
40
0
Arrests per 100k
2010
2012
2014
2016
2018
BY THE COUNTY
All counties with racial disparities above the
national average {3.64 x)
Counties with the largest racial disparities
Counties with a pop. of >30,000, a Black pop. of >1%, a data coverage
of >50%, and at least 25 marijuana possession arrests are included.
- •
••
,,
.
~~•~
•••••I•■
I••
-··· White Rate
■
■
1111111,
1. Lyon
2. Cowley
3. Reno
~
II
■
4. Harvey
-■•
5. Ford
Black Rate
1,129
73
1,055
116
■
735
809
9.14x
7.84x
103
122
15.38x
8.66x
85
Arrests per 100k
Counties with missing data are striped.
Black people x
times more likely
to be arrested
925
7.58x
KENTUCKY
ACLU
2018 SUMMARY
Black people were
9.4x
Kentucky ranks
2nd
Arrests for the possession of
marijuana made up
20%
more likely than white
people to be arrested
for marijuana possession
in the nation for largest racial
disparities in arrests for
marijuana possession
of all drug arrests in
the state+
t
Direction of ➔ indicates increase
or decrease since 2010.
ARRESTS OVER TIME
Rates of Black arrest · compared to @5i!¥ih4R} tor
marijuana possession, per 100k people
Black people x
times more likely
to be arrested
2018
788
9.36x
84
Statewide marijuana possession arrest rates compared
to all other drug arrest rates, per 100k people
600
480
360
2010
721
5.85x
123
500
0
500
Arrests per 100k
240
120
------·--·--·---------'--•
I
•
I
I
0
2010
2012
2014
2016
2018
BY THE COUNTY
All counties with racial disparities above the
national average {3.64 x)
Counties with the largest racial disparities
Counties with a pop. of >30,000, a Black pop. of >1%, a data coverage
of >50%, and at least 25 marijuana possession arrests are included.
- White Rate
1. Kenton
2. Graves
3. Daviess
4. Hopkins
5. McCracken
Black Rate
Black people x
times more likely
to be arrested
1,905
■
133
845
I
90
I
91
I
91
740
739
461
14.36x
9.44x
8.17x
8.10x
7.80x
I 59
Arrests per 100k
LOUISIANA
ACLU
2018 SUMMARY
Black people were
3.4x
Louisiana ranks
29th
Arrests for the possession of
marijuana made up
more likely than white
people to be arrested
for marijuana possession
in the nation for largest racial
disparities in arrests for
marijuana possession
51%
of all drug arrests in
the statet
t
Direction of ➔ indicates increase
or decrease since 2010.
ARRESTS OVER TIME
Rates of Black arrest · compared to @5i!¥ih4R} tor
marijuana possession, per 100k people
Black people x
times more likely
to be arrested
2018
796
237
3.35x
Statewide marijuana possession arrest rates compared
to all other drug arrest rates, per 100k people
500
400
300
2010
673
3.29x
205
500
0
500
Arrests per 100k
200
100
0
2010
2012
2014
2016
2018
BY THE PARISH
All parishes with racial disparities above the
national average {3.64 x)
Parishes
withthe
thelargest
largestracial
racial
disparities
Counties with
disparities
Parishes
a data
coverage
Countieswith
withaapop.
pop.ofof>30,000,
>30,000,a aBlack
Blackpop.
pop.ofof>1%,
>1%,
a data
coverage
of >50%,
>50%, and
and at
at least
least25
25marijuana
marijuanapossession
possessionarrests
arrestsare
areincluded.
included.
- --White Rate
1. East Baton
Rouge
2. Acadia
3. St. Bernard
Black Rate
1,135
•
541
6.08x
89
181
5.96x
I 30
1,297
218
810
139
Arrests per 100k
Parishes with missing data are striped.
7.01x
162
4. Natchitoches
5. Beauregard
Black people x
times more likely
to be arrested
5.94x
5.82x
MAINE
ACLU
2018 SUMMARY
Black people were
4x
Maine ranks
20th
Arrests for the possession of
marijuana made up
20%
more likely than white
people to be arrested
for marijuana possession
in the nation for largest racial
disparities in arrests for
marijuana possession
of all drug arrests in
the state+
t
Direction of ➔ indicates increase
or decrease since 2010.
ARRESTS OVER TIME
Rates of Black arrest · compared to @5i!¥ih4R} tor
marijuana possession, per 100k people
Black people x
times more likely
to be arrested
2018
215
3.99x
54
Statewide marijuana possession arrest rates compared
to all other drug arrest rates, per 100k people
300
Legalized
240
180
2010
459
500
2.09x
219
250
0
250
500
Arrests per 100k
120
60
0
2010
2012
2014
2016
2018
BY THE COUNTY
All counties with racial disparities above the
national average {3.64 x)
Counties with the largest racial disparities
Counties with a pop.
pop. of
of >30,000,
>30,000,aadata
Black
pop. of of
>1%,
a data
coverage
>50%
andcoverage
at least
of
and possession
at least 25 marijuana
25>50%,
marijuana
arrests are possession
included. arrests are included.
- •
-White Rate
Black Rate
1. York
.«
', '
• ii
2. Somerset
3. Kennebec
4. Penobscot
5. Cumberland
835
69
•
322
12.19x
6.28x
51
428
90
341
97
•
Black people x
times more likely
to be arrested
142
48
Arrests per 100k
4.77x
3.52x
2.95x
MARYLAND
ACLU
2018 SUMMARY
Black people were
2.1x
Maryland ranks
44th
Arrests for the possession of
marijuana made up
50%
more likely than white
people to be arrested
for marijuana possession+
in the nation for largest racial
disparities in arrests for
marijuana possession
of all drug arrests in
the state+
Direction of ➔ indicates increase
or decrease since 2010.
ARRESTS OVER TIME
Rates of Black arrest · compared to @5i!¥ih4R} tor
marijuana possession, per 100k people
Black people x
times more likely
to be arrested
2018
470
221
2.13x
Statewide marijuana possession arrest rates compared
to all other drug arrest rates, per 100k people
500
Decriminalized
400
300
2010
782
2.81x
278
500
0
500
Arrests per 100k
200
100
0
2010
2012
2014
2016
2018
BY THE COUNTY
All counties with racial disparities above the
national average {3.64 x)
Counties with the largest racial disparities
Counties with a pop. of >30,000, a Black pop. of >1%, a data coverage
of >50%, and at least 25 marijuana possession arrests are included.
- -••
White Rate
1. Queen
Anne's
2. Carroll
3. Cecil
4. Frederick
5. Allegany
Black Rate
Black people x
times more likely
to be arrested
5,198
594
732
8.75x
6.91x
I 106
4,080
598
1,632
272
1,651
294
Arrests per 100k
6.82x
6.01x
5.62x
MASSACHUSETTS
ACLU
2018 SUMMARY
Black people were
4x
Massachusetts ranks
18th
Arrests for the possession of
marijuana made up
more likely than white
people to be arrested
for marijuana possession
in the nation for largest racial
disparities in arrests for
marijuana possession
3%
of all drug arrests in
the state+
t
Direction of ➔ indicates increase
or decrease since 2010.
ARRESTS OVER TIME
Rates of Black arrest · compared to @5i!¥ih4R} tor
marijuana possession, per 100k people
Black people x
times more likely
to be arrested
2018
15
4.04x
4
Statewide marijuana possession arrest rates compared
to all other drug arrest rates, per 100k people
200
Legalized
160
120
2010
62
100
3.41x
18
50
0
50
Arrests per 100k
100
80
40
0
2010
2012
2014
2016
2018
BY THE COUNTY
All counties with racial disparities above the
national average {3.64 x)
Counties with the largest racial disparities
Counties with a pop. of >30,000, a Black pop. of >1%, a data coverage
of >50%, and at least 25 marijuana possession arrests are included.
- -White Rate
1. Middlesex
Black Rate
15
6.46x
2
2. Plymouth
22
4
3. Hampden
18
7
6
3
Arrests per 100k
6.27x
3.61x
5
4. Worcester
5. Essex
Black people x
times more likely
to be arrested
23
3.29x
2.01x
MICHIGAN
ACLU
2018 SUMMARY
Black people were
3.6x
Michigan ranks
23rd
Arrests for the possession of
marijuana made up
more likely than white
people to be arrested
for marijuana possession
in the nation for largest racial
disparities in arrests for
marijuana possession
47%
of all drug arrests in
the state+
t
Direction of ➔ indicates increase
or decrease since 2010.
ARRESTS OVER TIME
Rates of Black arrest · compared to @5i!¥ih4R} tor
marijuana possession, per 100k people
Black people x
times more likely
to be arrested
2018
374
3.59x
104
Statewide marijuana possession arrest rates compared
to all other drug arrest rates, per 100k people
200
160
120
2010
471
500
3.27x
144
250
0
250
500
80
40
0
Arrests per 100k
2010
2012
2014
2016
2018
BY THE COUNTY
All counties with racial disparities above the
national average {3.64 x)
•'"' :.J••~
•r•
~·····
~
II'
•
■
■ ■■
• ■■■■.:=
I
i ■■■1.,•
~.
II!
-■■■■
~
.,
Counties with the largest racial disparities
Counties with a pop. of >30,000, a Black pop. of >1%, a data coverage
of >50%, and at least 25 marijuana possession arrests are included.
- White Rate
1. Clinton
2. Bay
3. Allegan
4. Isabella
5. St. Clair
Black Rate
2,868
I
133
1,080
2,759
■
21.52x
17.40x
62
185
1,456
I 98
1,183
I 81
■■■r
ichigan legalized marijuana possession in 2018. More recent data
M
is needed to analyze trends since the enactment of the recent law.
Black people x
times more likely
to be arrested
Arrests per 100k
14.91x
14.90x
14.63x
MINNESOTA
ACLU
2018 SUMMARY
Black people were
5.4x
Minnesota ranks
8 th
Arrests for the possession of
marijuana made up
35%
more likely than white
people to be arrested
for marijuana possession+
in the nation for largest racial
disparities in arrests for
marijuana possession
of all drug arrests in
the state+
Direction of ➔ indicates increase
or decrease since 2010.
ARRESTS OVER TIME
Rates of Black arrest · compared to @5i!¥ih4R} tor
marijuana possession, per 100k people
Black people x
times more likely
to be arrested
2018
537
100
5.37x
Statewide marijuana possession arrest rates compared
to all other drug arrest rates, per 100k people
300
240
180
2010
828
7.94x
104
500
0
500
Arrests per 100k
120
:-__--=-..
-:,7""7'°"0----.........:.~:==::::::;~
60
0
2010
2012
2014
2016
2018
BY THE COUNTY
All counties with racial disparities above the
national average {3.64 x)
__
..
__.,
,. ....•,,.
■•
I
■
■■
Counties with a pop. of >30,000, a Black pop. of >1%, a data coverage
of >50%, and at least 25 marijuana possession arrests are included.
- -•
White Rate
1. Goodhue
2. Olmsted
3. St. Louis
\
·'"la•li~•
I I Iii
Counties with the largest racial disparities
4. Ramsey
5. Carver
■
Black Rate
211
773
I
91
641
I 78
377
I 53
917
130
Arrests per 100k
Minnesota decriminalized marijuana possession in 1976.
Black people x
times more likely
to be arrested
2,362
11.19x
8.47x
8.26x
7.13x
7.07x
MISSISSIPPI
ACLU
2018 SUMMARY
Black people were
2.7x
Mississippi ranks
38 th
Arrests for the possession of
marijuana made up
44%
more likely than white
people to be arrested
for marijuana possession+
in the nation for largest racial
disparities in arrests for
marijuana possession
of all drug arrests in
the state+
Direction of ➔ indicates increase
or decrease since 2010.
ARRESTS OVER TIME
Rates of Black arrest · compared to @5i!¥ih4R} tor
marijuana possession, per 100k people
Black people x
times more likely
to be arrested
2018
479
2.71x
176
Statewide marijuana possession arrest rates compared
to all other drug arrest rates, per 100k people
3,200
2,560
1,920
2010
547
600
3.09x
177
300
0
300
600
Arrests per 100k
1,280
640
0
2010
2012
2014
2016
2018
BY THE COUNTY
All counties with racial disparities above the
national average {3.64 x)
--11;1
■111■
'
'
4 ■
•
1.
■
Mississippi decriminalized marijuana possession in 1978.
Counties with the largest racial disparities
Counties with a pop. of >30,000, a Black pop. of >1%, a data coverage
of >50%, and at least 25 marijuana possession arrests are included.
- -•
-•
White Rate
1. Hancock
2. Madison
3. DeSoto
4. Rankin
5. Harrison
Black Rate
Black people x
times more likely
to be arrested
2,207
210
622
10.49x
5.21x
119
315
4.58x
I 69
488
4.51x
108
1,487
335
Arrests per 100k
4.44x
MISSOURI
ACLU
2018 SUMMARY
Black people were
2.6x
Missouri ranks
39th
Arrests for the possession of
marijuana made up
more likely than white
people to be arrested
for marijuana possession
in the nation for largest racial
disparities in arrests for
marijuana possession
50%
of all drug arrests in
the state+
t
Direction of ➔ indicates increase
or decrease since 2010.
ARRESTS OVER TIME
Rates of Black arrest · compared to @5i!¥ih4R} tor
marijuana possession, per 100k people
Black people x
times more likely
to be arrested
2018
781
296
2.63x
Statewide marijuana possession arrest rates compared
to all other drug arrest rates, per 100k people
500
Decriminalized
400
300
2010
786
2.52x
313
500
0
500
Arrests per 100k
200
100
0
2010
2012
2014
2016
2018
BY THE COUNTY
All counties with racial disparities above the
national average {3.64 x)
Counties with the largest racial disparities
Counties with a pop. of >30,000, a Black pop. of >1%, a data coverage
of >50%, and at least 25 marijuana possession arrests are included.
- -•
White Rate
1. Johnson
2. Lincoln
Black Rate
2,801
I
5. Warren
1,889
10.43x
I 181
700
1,454
I 182
3,470
503
Arrests per 100k
Counties with missing data are striped.
10.73x
261
3. Lafayette
4. Jefferson
Black people x
times more likely
to be arrested
7,237
10.33x
8.00x
6.90x
MONTANA
ACLU
2018 SUMMARY
Black people were
9.6x
Montana ranks
1st
Arrests for the possession of
marijuana made up
45%
more likely than white
people to be arrested
for marijuana possession
in the nation for largest racial
disparities in arrests for
marijuana possession
of all drug arrests in
the state+
t
Direction of ➔ indicates increase
or decrease since 2010.
ARRESTS OVER TIME
Rates of Black arrest · compared to @5i!¥ih4R} tor
marijuana possession, per 100k people
Black people x
times more likely
to be arrested
2018
1,064
9.62x
111
Statewide marijuana possession arrest rates compared
to all other drug arrest rates, per 100k people
200
160
120
2010
459
1,000
500
3.49x
131
0
500
1,000
Arrests per 100k
80
40
0
2010
2012
2014
2016
2018
BY THE COUNTY
All counties with racial disparities above the
national average {3.64 x)
Counties with the largest racial disparities
Counties with a pop.
pop. of
of >30,000,
>30,000,aadata
Black
pop. of of
>1%,
a data
coverage
>50%
andcoverage
at least
25>50%,
marijuana
arrests are possession
included. arrests are included.
of
and possession
at least 25 marijuana
- White Rate
1. Gallatin
2. Yellowstone
3. Missoula
4. Flathead
5. Ravalli
Black Rate
•
•
I
2,174
120
1,995
143
867
75
•I
993
122
568
18.15x
13.99x
11.52x
8.17x
7.34x
77
Arrests per 100k
Counties with missing data are striped.
Black people x
times more likely
to be arrested
NEBRASKA
ACLU
2018 SUMMARY
Black people were
3.1x
Nebraska ranks
33rd
Arrests for the possession of
marijuana made up
48%
more likely than white
people to be arrested
for marijuana possession+
in the nation for largest racial
disparities in arrests for
marijuana possession
of all drug arrests in
the state+
Direction of ➔ indicates increase
or decrease since 2010.
ARRESTS OVER TIME
Rates of Black arrest · compared to @5i!¥ih4R} tor
marijuana possession, per 100k people
Black people x
times more likely
to be arrested
2018
1,164
3.07x
380
Statewide marijuana possession arrest rates compared
to all other drug arrest rates, per 100k people
500
400
300
2010
1,711
4.40x
389
200
100
1,000
0
1,000
0
Arrests per 100k
2010
2012
2014
2016
2018
BY THE COUNTY
All counties with racial disparities above the
national average {3.64 x)
Counties with the largest racial disparities
Counties with a pop. of >30,000, a Black pop. of >1%, a data coverage
of >50%, and at least 25 marijuana possession arrests are included.
- -•
-White Rate
1. Buffalo
Black Rate
542
4. Sarpy
5. Lincoln
Nebraska decriminalized marijuana possession in 1979.
8.93x
I 61
2. Adams
3. Lancaster
Black people x
times more likely
to be arrested
2,040
8.51x
240
3,353
490
2,360
367
2,036
328
Arrests per 100k
6.84x
6.43x
6.21x
NEVADA
ACLU
2018 SUMMARY
Black people were
3x
Nevada ranks
35th
Arrests for the possession of
marijuana made up
20%
more likely than white
people to be arrested
for marijuana possession+
in the nation for largest racial
disparities in arrests for
marijuana possession
of all drug arrests in
the state+
Direction of ➔ indicates increase
or decrease since 2010.
ARRESTS OVER TIME
Rates of Black arrest · compared to @5i!¥ih4R} tor
marijuana possession, per 100k people
Black people x
times more likely
to be arrested
2018
212
3.04x
70
Statewide marijuana possession arrest rates compared
to all other drug arrest rates, per 100k people
900
Legalized
720
540
2010
1,408
1,000
4.00x
352
0
1,000
Arrests per 100k
360
180
0
2010
2012
2014
2016
2018
BY THE COUNTY
All counties with racial disparities above the
national average {3.64 x)
Counties with the largest racial disparities
Counties with a pop. of >30,000, a Black pop. of >1%, a data coverage
of >50%, and at least 25 marijuana possession arrests are included.
- White Rate
1. Douglas
2. Lyon
3. Elko
4. Washoe
5. Clark
Black Rate
Black people x
times more likely
to be arrested
4,970
I
227
1,944
I 147
2,148
I
190
•
416
21.91x
13.19x
11.31x
4.76x
I 87
I 188
3.50x
I 54
Arrests per 100k
NEW HAMPSHIRE
ACLU
2018 SUMMARY
Black people were
4.1x
New Hampshire ranks
17th
Arrests for the possession of
marijuana made up
more likely than white
people to be arrested
for marijuana possession
in the nation for largest racial
disparities in arrests for
marijuana possession
43%
of all drug arrests in
the state+
t
Direction of ➔ indicates increase
or decrease since 2010.
ARRESTS OVER TIME
Rates of Black arrest · compared to @5i!¥ih4R} tor
marijuana possession, per 100k people
Black people x
times more likely
to be arrested
2018
803
4.11x
195
Statewide marijuana possession arrest rates compared
to all other drug arrest rates, per 100k people
400
Decrim.
320
240
2010
549
2.49x
221
160
80
500
0
500
0
Arrests per 100k
2010
2012
2014
2016
2018
BY THE COUNTY
All counties with racial disparities above the
national average {3.64 x)
Counties with the largest racial disparities
Counties with a pop.
pop. of
of >30,000,
>30,000,aadata
Black
pop. of of
>1%,
a data
coverage
>50%
andcoverage
at least
25>50%,
marijuana
arrests are possession
included. arrests are included.
of
and possession
at least 25 marijuana
- •
•
White Rate
1. Cheshire
Black Rate
13.15x
1,293
6.70x
193
3. Coos
5. Sullivan
2,058
157
2. Merrimack
4. Strafford
Black people x
times more likely
to be arrested
483
346
I 58
734
I
139
Arrests per 100k
2,918
6.04x
5.95x
5.28x
NEW JERSEY
ACLU
2018 SUMMARY
Black people were
3.5x
New Jersey ranks
25th
Arrests for the possession of
marijuana made up
55%
more likely than white
people to be arrested
for marijuana possession t
in the nation for largest racial
disparities in arrests for
marijuana possession
of all drug arrests in
the statet
Direction of ➔ indicates increase
or decrease since 2010.
ARRESTS OVER TIME
Rates of Black arrest · compared to @5i!¥ih4R} tor
marijuana possession, per 100k people
Black people x
times more likely
to be arrested
2018
1,008
3.45x
292
Statewide marijuana possession arrest rates compared
to all other drug arrest rates, per 100k people
500
400
300
2010
606
1,000
2.81x
216
500
0
500
1,000
Arrests per 100k
:-------.
------Q
O'
200
100
0
2010
2012
2014
2016
2018
BY THE COUNTY
All counties with racial disparities above the
national average {3.64 x)
Counties with the largest racial disparities
Counties with a pop. of >30,000, a Black pop. of >1%, a data coverage
of >50%, and at least 25 marijuana possession arrests are included.
- •
White Rate
Black Rate
1. Hunterdon
2. Ocean
3. Morris
4. Warren
5. Cape May
9,218
672
1,861
2,493
322
I
341
7.74x
2,581
•
13.71x
9.34x
I 199
I
Black people x
times more likely
to be arrested
7.57x
4,679
726
Arrests per 100k
6.45x
NEW MEXICO
ACLU
2018 SUMMARY
Black people were
4x
New Mexico ranks
21st
Arrests for the possession of
marijuana made up
54%
more likely than white
people to be arrested
for marijuana possession t
in the nation for largest racial
disparities in arrests for
marijuana possession
of all drug arrests in
the state
t
Direction of ➔ indicates increase
or decrease since 2010.
ARRESTS OVER TIME
Rates of Black arrest · compared to @5i!¥ih4R} tor
marijuana possession, per 100k people
Black people x
times more likely
to be arrested
2018
837
211
3.98x
Statewide marijuana possession arrest rates compared
to all other drug arrest rates, per 100k people
300
240
180
2010
324
500
1.82x
178
0
500
Arrests per 100k
120
60
0
2010
2012
2014
2016
2018
BY THE COUNTY
All counties with racial disparities above the
national average {3.64 x)
Counties with the largest racial disparities
Counties with a pop. of >30,000, a Black pop. of >1%, a data coverage
of >50%, and at least 25 marijuana possession arrests are included.
- White Rate
1. Santa Fe
2. Eddy
3. Lea
4. Doña Ana
5. Otero
ew Mexico decriminalized marijuana possession in 2019. More recent data is
N
needed to analyze trends since the enactment of the recent law.
Black Rate
■
I
526
1,395
239
2,105
■ 531
I 251
I 103
643
I
266
Arrests per 100k
Black people x
times more likely
to be arrested
7,182
13.65x
5.84x
3.96x
2.44x
2.42x
NEW YORK
ACLU
2018 SUMMARY
Black people were
2.6x
New York ranks
40th
Arrests for the possession of
marijuana made up
54%
more likely than white
people to be arrested
for marijuana possession+
in the nation for largest racial
disparities in arrests for
marijuana possession
of all drug arrests in
the state+
Direction of ➔ indicates increase
or decrease since 2010.
ARRESTS OVER TIME
Rates of Black arrest · compared to @5i!¥ih4R} tor
marijuana possession, per 100k people
2018
598
228
Statewide marijuana possession arrest rates compared
to all other drug arrest rates, per 100k people
Black people x
times more likely
to be arrested
600
2.63x
480
360
2010
1,225
1,000
4.73x
259
500
0
500
1,000
Arrests per 100k
240
120
0
2010
2012
2014
2016
2018
BY THE COUNTY
All counties with racial disparities above the
national average {3.64 x)
Counties with the largest racial disparities
Counties with a pop. of >30,000, a Black pop. of >1%, a data coverage
of >50%, and at least 25 marijuana possession arrests are included.
- White Rate
1. Steuben
2. Richmond
3. Tioga
4. Bronx
5. New York
Black Rate
4,499
I
~
19.07x
236
•
•
•
354
18.63x
19
5,328
288
I 182
18.48x
17.47x
10
276
16.83x
16
Arrests per 100k
ew York decriminalized marijuana possession in 2019. More recent data
N
is needed to analyze trends since the enactment of the recent law.
Black people x
times more likely
to be arrested
NORTH CAROLINA
ACLU
2018 SUMMARY
Black people were
3.3x
North Carolina ranks
31st
Arrests for the possession of
marijuana made up
53%
more likely than white
people to be arrested
for marijuana possession+
in the nation for largest racial
disparities in arrests for
marijuana possession
of all drug arrests in
the state+
Direction of ➔ indicates increase
or decrease since 2010.
ARRESTS OVER TIME
Rates of Black arrest · compared to @5i!¥ih4R} tor
marijuana possession, per 100k people
Black people x
times more likely
to be arrested
2018
528
3.26x
162
Statewide marijuana possession arrest rates compared
to all other drug arrest rates, per 100k people
400
320
240
2010
533
600
3.34x
159
300
0
300
600
Arrests per 100k
160
80
0
2010
2012
2014
2016
2018
BY THE COUNTY
All counties with racial disparities above the
national average {3.64 x)
Counties with the largest racial disparities
Counties with a pop. of >30,000, a Black pop. of >1%, a data coverage
of >50%, and at least 25 marijuana possession arrests are included.
- •
-•
White Rate
Black Rate
1. Dare
2. Granville
5. Yadkin
Counties with missing data are striped.
North Carolina decriminalized marijuana possession in 1977.
4,053
344
512
3,135
278
1,075
I 96
1,892
I
11.79x
11.69x
I 44
3. Haywood
4. Watauga
Black people x
times more likely
to be arrested
198
Arrests per 100k
11.26x
11.23x
9.57x
NORTH DAKOTA
ACLU
2018 SUMMARY
Black people were
5.5x
North Dakota ranks
7th
Arrests for the possession of
marijuana made up
47%
more likely than white
people to be arrested
for marijuana possession
in the nation for largest racial
disparities in arrests for
marijuana possession
of all drug arrests in
the state+
t
Direction of ➔ indicates increase
or decrease since 2010.
ARRESTS OVER TIME
Rates of Black arrest · compared to @5i!¥ih4R} tor
marijuana possession, per 100k people
Black people x
times more likely
to be arrested
2018
1,437
5.51x
261
Statewide marijuana possession arrest rates compared
to all other drug arrest rates, per 100k people
400
320
240
2010
724
1,000
4.40x
164
0
1,000
Arrests per 100k
160
80
0
2010
2012
2014
2016
2018
BY THE COUNTY
All counties with racial disparities above the
national average {3.64 x)
Counties with the largest racial disparities
Counties with a pop. of >30,000, a Black pop. of >1%, a data coverage
of >50%, and at least 25 marijuana possession arrests are included.
- -White Rate
1. Morton
2. Cass
3. Burleigh
4. Grand Forks
5. Ward
Black Rate
•
•
•
2,059
9.57x
215
1,147
6.58x
174
I
684
1,204
245
655
165
Arrests per 100k
orth Dakota decriminalized marijuana possession in 2019. More recent
N
data is needed to analyze trends since the enactment of the recent law.
Black people x
times more likely
to be arrested
3,692
5.40x
4.91x
3.97x
OHIO
ACLU
2018 SUMMARY
Black people were
3.4x
Ohio ranks
28th
Arrests for the possession of
marijuana made up
50%
more likely than white
people to be arrested
for marijuana possession+
in the nation for largest racial
disparities in arrests for
marijuana possession
of all drug arrests in
the state
t
Direction of ➔ indicates increase
or decrease since 2010.
ARRESTS OVER TIME
Rates of Black arrest · compared to @5i!¥ih4R} tor
marijuana possession, per 100k people
Black people x
times more likely
to be arrested
2018
527
3.43x
153
Statewide marijuana possession arrest rates compared
to all other drug arrest rates, per 100k people
500
400
300
2010
538
600
3.85x
140
300
0
300
600
Arrests per 100k
200
100
0
2010
2012
2014
2016
2018
BY THE COUNTY
All counties with racial disparities above the
national average {3.64 x)
Counties with the largest racial disparities
Counties with a pop. of >30,000, a Black pop. of >1%, a data coverage
of >50%, and at least 25 marijuana possession arrests are included.
- White Rate
1. Washington
2. Medina
3. Wayne
4. Geauga
5. Lawrence
Black Rate
4,477
I
166
3,167
3,731
I
184
1,519
26.91x
25.17x
I 126
20.27x
19.85x
77
2,260
I 121
Arrests per 100k
Ohio decriminalized marijuana possession in 1975.
Black people x
times more likely
to be arrested
18.65x
OKLAHOMA
ACLU
2018 SUMMARY
Black people were
4.2x
Oklahoma ranks
13th
Arrests for the possession of
marijuana made up
more likely than white
people to be arrested
for marijuana possession
in the nation for largest racial
disparities in arrests for
marijuana possession
42%
of all drug arrests in
the state+
t
Direction of ➔ indicates increase
or decrease since 2010.
ARRESTS OVER TIME
Rates of Black arrest · compared to @5i!¥ih4R} tor
marijuana possession, per 100k people
Black people x
times more likely
to be arrested
2018
719
170
4.24x
Statewide marijuana possession arrest rates compared
to all other drug arrest rates, per 100k people
300
240
180
2010
810
2.98x
272
120
60
500
0
500
0
Arrests per 100k
2010
2012
2014
2016
2018
BY THE COUNTY
Counties with the largest racial disparities
All counties with racial disparities above the
national average {3.64 x)
Counties with a pop. of >30,000, a Black pop. of >1%, a data coverage
of >50%, and at least 25 marijuana possession arrests are included.
11·
•
•
... - .,-.-1
··~ --·"·· • White Rate
,
·~'"- 1
■••t-
I
1. Pontotoc
Black Rate
4. Cherokee
5. Stephens
5,090
13.94x
365
2. Ottawa
3. Rogers
Black people x
times more likely
to be arrested
485
936
I 103
904
I 103
977
I 113
Arrests per 100k
6,544
13.48x
9.13x
8.76x
8.68x
OREGON
ACLU
2018 SUMMARY
Black people were
1.8x
Oregon ranks
45th
Arrests for the possession of
marijuana made up
more likely than white
people to be arrested
for marijuana possession
in the nation for largest racial
disparities in arrests for
marijuana possession
18%
of all drug arrests in
the state+
t
Direction of ➔ indicates increase
or decrease since 2010.
ARRESTS OVER TIME
Rates of Black arrest · compared to @5i!¥ih4R} tor
marijuana possession, per 100k people
Black people x
times more likely
to be arrested
2018
131
1.82x
72
Statewide marijuana possession arrest rates compared
to all other drug arrest rates, per 100k people
500
Legalized
400
300
2010
731
1.77x
414
500
0
500
Arrests per 100k
200
100
0
2010
2012
2014
2016
2018
BY THE COUNTY
All counties with racial disparities above the
national average {3.64 x)
Counties with the largest racial disparities
Counties with a pop. of >30,000, a Black pop. of >1%, a data coverage
of >50%, and at least 25 marijuana possession arrests are included.
- -White Rate
1. Clackamas
Black Rate
181
752
141
3. Lane
5. Polk
7.87x
I 23
2. Umatilla
4. Marion
Black people x
times more likely
to be arrested
545
112
150
I
5.32x
4.85x
4.33x
35
412
97
Arrests per 100k
4.25x
PENNSYLVANIA
ACLU
2018 SUMMARY
Black people were
3x
Pennsylvania ranks
36th
Arrests for the possession of
marijuana made up
42%
more likely than white
people to be arrested
for marijuana possession+
in the nation for largest racial
disparities in arrests for
marijuana possession
of all drug arrests in
the state
t
Direction of ➔ indicates increase
or decrease since 2010.
ARRESTS OVER TIME
Rates of Black arrest · compared to @5i!¥ih4R} tor
marijuana possession, per 100k people
Black people x
times more likely
to be arrested
2018
578
190
3.04x
Statewide marijuana possession arrest rates compared
to all other drug arrest rates, per 100k people
300
240
180
2010
624
4.80x
130
400
0
400
Arrests per 100k
120
60
0
2010
2012
2014
2016
2018
BY THE COUNTY
All counties with racial disparities above the
national average {3.64 x)
Counties with the largest racial disparities
Counties with a pop. of >30,000, a Black pop. of >1%, a data coverage
of >50%, and at least 25 marijuana possession arrests are included.
- --White Rate
1. Perry
2. Clarion
3. Indiana
4. Clinton
5. Westmoreland
Black Rate
I
I
746
4,651
182
4,395
I 263
3,746
I 225
2,499
I 197
Arrests per 100k
Black people x
times more likely
to be arrested
21,159
28.36x
25.62x
16.68x
16.62x
12.66x
RHODE ISLAND
ACLU
2018 SUMMARY
Black people were
3.3x
Rhode Island ranks
30th
Arrests for the possession of
marijuana made up
more likely than white
people to be arrested
for marijuana possession
in the nation for largest racial
disparities in arrests for
marijuana possession
18%
of all drug arrests in
the state+
t
Direction of ➔ indicates increase
or decrease since 2010.
ARRESTS OVER TIME
Rates of Black arrest · compared to @5i!¥ih4R} tor
marijuana possession, per 100k people
Black people x
times more likely
to be arrested
2018
110
3.32x
33
Statewide marijuana possession arrest rates compared
to all other drug arrest rates, per 100k people
300
Decriminalized
240
180
2010
523
600
2.59x
202
300
0
300
600
Arrests per 100k
120
60
0
2010
2012
2014
2016
2018
BY THE COUNTY
All counties with racial disparities above the
national average {3.64 x)
Counties with the largest racial disparities
Counties with a pop. of >30,000, a Black pop. of >1%, a data coverage
of >50%, and at least 25 marijuana possession arrests are included.
- -•
-•
White Rate
Black Rate
1. Washington
2. Newport
3. Kent
4. Providence
Black people x
times more likely
to be arrested
761
85
72
148
I
24
67
I 19
Arrests per 100k
619
8.99x
8.57x
6.10x
3.56x
SOUTH CAROLINA
ACLU
2018 SUMMARY
Black people were
3.5x
South Carolina ranks
26th
Arrests for the possession of
marijuana made up
more likely than white
people to be arrested
for marijuana possession
in the nation for largest racial
disparities in arrests for
marijuana possession
48%
of all drug arrests in
the state+
t
Direction of ➔ indicates increase
or decrease since 2010.
ARRESTS OVER TIME
Rates of Black arrest · compared to @5i!¥ih4R} tor
marijuana possession, per 100k people
Black people x
times more likely
to be arrested
2018
1,421
412
3.45x
Statewide marijuana possession arrest rates compared
to all other drug arrest rates, per 100k people
700
560
420
2010
827
1,000
2.76x
299
0
1,000
Arrests per 100k
280
140
0
2010
2012
2014
2016
2018
BY THE COUNTY
All counties with racial disparities above the
national average {3.64 x)
Counties with the largest racial disparities
Counties with a pop. of >30,000, a Black pop. of >1%, a data coverage
of >50%, and at least 25 marijuana possession arrests are included.
- -•
-••
White Rate
1. Pickens
2. Oconee
3. Horry
4. Lexington
5. Greenville
Black Rate
Black people x
times more likely
to be arrested
3,956
473
2,151
8.36x
8.31x
259
2,931
431
1,209
208
1,573
300
Arrests per 100k
6.80x
5.80x
5.25x
SOUTH DAKOTA
ACLU
2018 SUMMARY
Black people were
5x
South Dakota ranks
10 th
Arrests for the possession of
marijuana made up
more likely than white
people to be arrested
for marijuana possession
in the nation for largest racial
disparities in arrests for
marijuana possession
55%
of all drug arrests in
the state+
t
Direction of ➔ indicates increase
or decrease since 2010.
ARRESTS OVER TIME
Rates of Black arrest · compared to @5i!¥ih4R} tor
marijuana possession, per 100k people
Black people x
times more likely
to be arrested
2018
2,147
5.04x
426
Statewide marijuana possession arrest rates compared
to all other drug arrest rates, per 100k people
1,000
800
600
2010
989
2,000
1,000
5.03x
196
0
1,000
2,000
400
200
0
Arrests per 100k
2010
2012
2014
2016
2018
BY THE COUNTY
All counties with racial disparities above the
national average {3.64 x)
Counties with the largest racial disparities
Counties with a pop. of >30,000, a Black pop. of >1%, a data coverage
of >50%, and at least 25 marijuana possession arrests are included.
- •
-•
-White Rate
-■-■
~
--•
....
.,
■
I ■■
~11111111•111.
Black Rate
1. Pennington
2. Brookings
3. Lincoln
4. Brown
5. Minnehaha
Black people x
times more likely
to be arrested
2,337
8.80x
266
3,161
420
1,412
7.53x
6.87x
206
2,182
431
1,765
395
Arrests per 100k
5.07x
4.47x
TENNESSEE
ACLU
2018 SUMMARY
Black people were
3.2x
Tennessee ranks
32nd
Arrests for the possession of
marijuana made up
42%
more likely than white
people to be arrested
for marijuana possession+
in the nation for largest racial
disparities in arrests for
marijuana possession
of all drug arrests in
the state+
Direction of ➔ indicates increase
or decrease since 2010.
ARRESTS OVER TIME
Rates of Black arrest · compared to @5i!¥ih4R} tor
marijuana possession, per 100k people
Black people x
times more likely
to be arrested
2018
820
255
3.22x
Statewide marijuana possession arrest rates compared
to all other drug arrest rates, per 100k people
500
400
300
2010
771
4.04x
191
500
0
500
Arrests per 100k
200
100
0
2010
2012
2014
2016
2018
BY THE COUNTY
All counties with racial disparities above the
national average {3.64 x)
Counties with the largest racial disparities
Counties with a pop. of >30,000, a Black pop. of >1%, a data coverage
of >50%, and at least 25 marijuana possession arrests are included.
- •
-•
White Rate
Black Rate
1. Claiborne
2. Carter
3. Williamson
4. Lawrence
5. Sevier
Black people x
times more likely
to be arrested
2,437
15.36x
159
I
1,793
13.89x
129
2,945
274
1,656
10.73x
10.24x
162
2,377
284
Arrests per 100k
8.36x
TEXAS
ACLU
2018 SUMMARY
Black people were
2.6x
Texas ranks
41st
Arrests for the possession of
marijuana made up
more likely than white
people to be arrested
for marijuana possession
in the nation for largest racial
disparities in arrests for
marijuana possession
44%
of all drug arrests in
the state+
t
Direction of ➔ indicates increase
or decrease since 2010.
ARRESTS OVER TIME
Rates of Black arrest · compared to @5i!¥ih4R} tor
marijuana possession, per 100k people
Black people x
times more likely
to be arrested
2018
562
2.62x
214
Statewide marijuana possession arrest rates compared
to all other drug arrest rates, per 100k people
400
320
:
240
2010
627
2.33x
269
400
0
400
Arrests per 100k
160
80
0
2010
2012
2014
2016
2018
BY THE COUNTY
All counties with racial disparities above the
national average {3.64 x)
Counties with the largest racial disparities
Counties with a pop. of >30,000, a Black pop. of >1%, a data coverage
of >50%, and at least 25 marijuana possession arrests are included.
- White Rate
1. Van Zandt
2. Erath
3. Hopkins
4. Wise
5. Cooke
Black Rate
806
13.63x
I 59
1,912
I
180
I
217
10.62x
2,133
9.82x
1,599
9.69x
I 165
576
Arrests per 100k
Counties with missing data are striped.
Black people x
times more likely
to be arrested
4,698
8.16x
UTAH
ACLU
2018 SUMMARY
Black people were
4.9x
Utah ranks
11th
Arrests for the possession of
marijuana made up
40%
more likely than white
people to be arrested
for marijuana possession
in the nation for largest racial
disparities in arrests for
marijuana possession
of all drug arrests in
the state
t
t
Direction of ➔ indicates increase
or decrease since 2010.
ARRESTS OVER TIME
Rates of Black arrest · compared to @5i!¥ih4R} tor
marijuana possession, per 100k people
Black people x
times more likely
to be arrested
2018
1,527
Statewide marijuana possession arrest rates compared
to all other drug arrest rates, per 100k people
500
..
400
310
4.92x
300
2010
577
3.86x
149
-·--·------••--·--·-7
200
100
1,000
0
1,000
0
Arrests per 100k
2010
2012
2014
2016
2018
BY THE COUNTY
All counties with racial disparities above the
national average {3.64 x)
Counties with the largest racial disparities
Counties with a pop.
pop. of
of >30,000,
>30,000,aadata
Black
pop. of of
>1%,
a data
coverage
>50%
andcoverage
at least
25>50%,
marijuana
arrests are possession
included. arrests are included.
of
and possession
at least 25 marijuana
- •
--•
White Rate
1. Washington
2. Iron
3. Wasatch
4. Sanpete
5. Utah
Black Rate
1,862
I
9.17x
203
2,030
6.99x
291
4,468
647
3,138
494
2,118
336
Arrests per 100k
Counties with missing data are striped.
Black people x
times more likely
to be arrested
6.91x
6.36x
6.31x
VERMONT
ACLU
2018 SUMMARY
Black people were
6.1x
Vermont ranks
6th
Arrests for the possession of
marijuana made up
12%
more likely than white
people to be arrested
for marijuana possession
in the nation for largest racial
disparities in arrests for
marijuana possession
of all drug arrests in
the state+
t
Direction of ➔ indicates increase
or decrease since 2010.
ARRESTS OVER TIME
Rates of Black arrest · compared to @5i!¥ih4R} tor
marijuana possession, per 100k people
Black people x
times more likely
to be arrested
2018
126
6.06x
21
Statewide marijuana possession arrest rates compared
to all other drug arrest rates, per 100k people
200
Decriminalized
160
120
2010
508
600
4.14x
123
300
0
300
600
Arrests per 100k
80
40
0
2010
2012
2014
2016
2018
BY THE COUNTY
All counties with racial disparities above the
national average {3.64 x)
Counties with the largest racial disparities
Counties with a pop.
pop. of
of >30,000,
>30,000,aadata
Black
pop. of of
>1%,
a data
coverage
>50%
andcoverage
at least
10 >50%,
marijuana
are possession
included. arrests are included.
of
andpossession
at least 25 arrests
marijuana
- •
•
-•
White Rate
Black Rate
1. Washington
2. Windsor
3. Franklin
220
243
11.79x
21
270
28
163
19
111
26
Arrests per 100k
ermont legalized marijuana possession in 2018. More recent data
V
is needed to analyze trends since the enactment of the recent law.
13.72x
16
4. Chittenden
5. Rutland
Black people x
times more likely
to be arrested
9.76x
8.53x
4.24x
VIRGINIA
ACLU
2018 SUMMARY
Black people were
3.4x
Virginia ranks
27th
Arrests for the possession of
marijuana made up
52%
more likely than white
people to be arrested
for marijuana possession
in the nation for largest racial
disparities in arrests for
marijuana possession
of all drug arrests in
the state+
t
Direction of ➔ indicates increase
or decrease since 2010.
ARRESTS OVER TIME
Rates of Black arrest · compared to @5i!¥ih4R} tor
marijuana possession, per 100k people
Black people x
times more likely
to be arrested
2018
768
3.44x
223
Statewide marijuana possession arrest rates compared
to all other drug arrest rates, per 100k people
400
320
240
2010
518
500
2.82x
184
0
500
Arrests per 100k
160
.------
.~-·--·--·- ~
80
0
2010
2012
2014
2016
2018
BY THE COUNTY
All counties with racial disparities above the
national average {3.64 x)
Counties with the largest racial disparities
Counties with a pop. of >30,000, a Black pop. of >1%, a data coverage
of >50%, and at least 25 marijuana possession arrests are included.
- White Rate
1. Hanover
2. Smyth
3. Washington
4. Augusta
5. Arlington
Black Rate
Black people x
times more likely
to be arrested
5,809
I
280
•
•
5,200
322
2,068
I 169
320
20.74x
16.14x
12.22x
9.78x
I 33
1,071
9.70x
I 110
Arrests per 100k
WASHINGTON
ACLU
2018 SUMMARY
Black people were
2.1x
Washington ranks
43rd
Arrests for the possession of
marijuana made up
14%
more likely than white
people to be arrested
for marijuana possession+
in the nation for largest racial
disparities in arrests for
marijuana possession
of all drug arrests in
the state+
Direction of ➔ indicates increase
or decrease since 2010.
ARRESTS OVER TIME
Rates of Black arrest · compared to @5i!¥ih4R} tor
marijuana possession, per 100k people
Black people x
times more likely
to be arrested
2018
52
2.14x
24
Statewide marijuana possession arrest rates compared
to all other drug arrest rates, per 100k people
200
Legalized
160
120
2010
462
500
2.53x
183
250
0
250
500
Arrests per 100k
80
40
0
2010
2012
2014
2016
2018
BY THE COUNTY
All counties with racial disparities above the
national average {3.64 x)
...
·-JI, ~
-~
~
Counties with the largest racial disparities
Counties with a pop. of >30,000, a Black pop. of >1%, a data coverage
of >50%, and at least 25 marijuana possession arrests are included.
- -White Rate
1. Whatcom
2. Spokane
3. Kittitas
4. Clallam
5. Grays Harbor
Black Rate
•
I
Black people x
times more likely
to be arrested
180
9.19x
20
120
8.82x
14
326
48
251
37
•
123
26
Arrests per 100k
6.77x
6.76x
4.69x
WEST VIRGINIA
ACLU
2018 SUMMARY
Black people were
7.3x
West Virginia ranks
4th
Arrests for the possession of
marijuana made up
more likely than white
people to be arrested
for marijuana possession
in the nation for largest racial
disparities in arrests for
marijuana possession
47%
of all drug arrests in
the state
t
t
Direction of ➔ indicates increase
or decrease since 2010.
ARRESTS OVER TIME
Rates of Black arrest · compared to @5i!¥ih4R} tor
marijuana possession, per 100k people
Black people x
times more likely
to be arrested
2018
2,517
7.31x
344
Statewide marijuana possession arrest rates compared
to all other drug arrest rates, per 100k people
700
560
420
2010
1,267
2,000
1,000
4.67x
271
0
1,000
2,000
Arrests per 100k
280
140
0
2010
2012
2014
2016
2018
BY THE COUNTY
All counties with racial disparities above the
national average {3.64 x)
Counties with the largest racial disparities
Counties with a pop. of >30,000, a Black pop. of >1%, a data coverage
of >50%, and at least 25 marijuana possession arrests are included.
- White Rate
1. Preston
I
4. Wood
5. Logan
463
5,284
2. Putnam
3. Harrison
Black Rate
213
5,053
I 291
1,823
I 147
5,353
I
469
Arrests per 100k
Black people x
times more likely
to be arrested
11,559
24.96x
24.77x
17.39x
12.41x
11.42x
WISCONSIN
ACLU
2018 SUMMARY
Black people were
4.2x
Wisconsin ranks
14th
Arrests for the possession of
marijuana made up
57%
more likely than white
people to be arrested
for marijuana possession+
in the nation for largest racial
disparities in arrests for
marijuana possession
of all drug arrests in
the state+
Direction of ➔ indicates increase
or decrease since 2010.
ARRESTS OVER TIME
Rates of Black arrest · compared to @5i!¥ih4R} tor
marijuana possession, per 100k people
Black people x
times more likely
to be arrested
2018
1,126
4.24x
266
Statewide marijuana possession arrest rates compared
to all other drug arrest rates, per 100k people
400
320
240
2010
1,297
1,000
5.82x
223
500
0
500
1,000
Arrests per 100k
160
80
0
2010
2012
2014
2016
2018
BY THE COUNTY
All counties with racial disparities above the
national average {3.64 x)
Counties with the largest racial disparities
Counties with a pop. of >30,000, a Black pop. of >1%, a data coverage
of >50%, and at least 25 marijuana possession arrests are included.
- White Rate
1. Ozaukee
2. Manitowoc
3. Washington
4. Waukesha
5. Walworth
Black Rate
Black people x
times more likely
to be arrested
5,548
34.90x
159
7,862
I 263
6,165
27.07x
I 228
3,314
23.88x
139
•
7,872
531
Arrests per 100k
29.85x
14.83x
WYOMING
ACLU
2018 SUMMARY
Black people were
5.2x
Wyoming ranks
9th
Arrests for the possession of
marijuana made up
59%
more likely than white
people to be arrested
for marijuana possession
in the nation for largest racial
disparities in arrests for
marijuana possession
of all drug arrests in
the state+
t
Direction of ➔ indicates increase
or decrease since 2010.
ARRESTS OVER TIME
Rates of Black arrest · compared to @5i!¥ih4R} tor
marijuana possession, per 100k people
Black people x
times more likely
to be arrested
2018
2,677
5.20x
515
Statewide marijuana possession arrest rates compared
to all other drug arrest rates, per 100k people
600
480
360
2010
1,234
2,000
1,000
3.19x
386
0
1,000
2,000
Arrests per 100k
240
120
0
2010
2012
2014
2016
2018
BY THE COUNTY
All counties with racial disparities above the
national average {3.64 x)
Counties with the largest racial disparities
Counties
of of
>30,000,
a Black
pop.
of >1%, aofdata
coverage
Countieswith
witha apop.
pop.
>30,000,
a data
coverage
>50%
and
of
and
at least 25possession
marijuana possession
are included.
at >50%,
least 25
marijuana
arrests arearrests
included.
- White Rate
1. Fremont
Black Rate
3,661
4. Albany
5. Laramie
13.12x
I 279
2. Campbell
3. Sweetwater
Black people x
times more likely
to be arrested
8,633
783
2,847
I
7.48x
381
4,308
944
•
11.03x
1,759
503
Arrests per 100k
4.56x
3.50x
Appendices
APPENDIX TABLE A
Arrest Rates and Racial Disparities per State (2018)
% Change Since 2010
State
Alabama
Alaska
Arizona
Arkansas
California
Colorado
Connecticut
Delaware
Georgia
Hawai‘i
Idaho
Illinois
Indiana
Iowa
Kansas
Kentucky
Louisiana
Maine
Maryland
Massachusetts
Michigan
Minnesota
Mississippi
Missouri
Montana
Nebraska
Nevada
New Hampshire
New Jersey
New Mexico
New York
North Carolina
North Dakota
Ohio
Oklahoma
Oregon
Pennsylvania
Rhode Island
South Carolina
South Dakota
Tennessee
Texas
Utah
Vermont
Virginia
Washington
West Virginia
Wisconsin
Wyoming
Marijuana
Arrest Rate
Marijuana
Possession
Arrest Rate
Black
Possession
Arrest Rate
White
Possession
Arrest Rate
Rate Ratio
Racial
Disparities
Possession
Rate
63.06
57.72
220.01
358.79
13.79
91.00
64.77
118.90
499.68
59.18
351.37
76.17
286.73
147.80
99.80
170.07
459.82
61.64
317.86
13.13
156.98
158.83
348.68
359.93
135.19
453.58
95.60
219.20
404.67
249.93
300.26
256.40
354.04
272.79
229.69
77.00
264.87
49.93
753.11
746.68
387.44
259.08
372.71
33.56
344.02
30.94
496.32
360.59
655.00
55.82
53.35
208.75
322.12
9.14
82.20
49.85
89.33
428.81
55.78
332.16
43.01
247.61
133.82
80.56
141.72
412.48
54.99
279.40
4.52
140.95
126.71
294.78
340.28
127.62
409.42
76.65
202.10
369.54
225.71
287.76
234.85
332.52
248.68
199.25
69.54
226.52
37.80
673.26
695.86
343.94
244.12
343.37
21.54
314.33
25.90
447.32
324.37
592.89
128.03
70.82
580.65
648.46
18.12
130.51
152.57
222.45
804.32
130.90
1026.94
137.84
712.06
776.28
323.84
788.34
795.52
214.84
470.16
14.76
373.80
536.94
478.88
780.94
1064.23
1163.94
212.26
803.40
1007.96
837.21
597.59
528.27
1437.25
526.73
719.47
130.90
577.96
110.17
1420.68
2147.03
820.16
561.60
1526.97
126.26
768.01
52.18
2516.95
1125.85
2677.27
31.01
45.40
190.90
271.21
10.00
84.90
37.91
53.57
271.82
73.42
263.83
18.36
204.01
106.90
66.94
84.19
237.31
53.89
220.74
3.65
104.06
100.02
176.39
296.38
110.60
379.73
69.72
195.28
292.49
210.54
227.53
162.03
260.99
153.48
169.62
71.74
190.40
33.17
412.27
426.35
255.09
213.99
310.43
20.83
223.37
24.44
344.26
265.58
515.27
4.13
1.56
3.04
2.39
1.81
1.54
4.02
4.15
2.96
1.78
3.89
7.51
3.49
7.26
4.84
9.36
3.35
3.99
2.13
4.04
3.59
5.37
2.71
2.63
9.62
3.07
3.04
4.11
3.45
3.98
2.63
3.26
5.51
3.43
4.24
1.82
3.04
3.32
3.45
5.04
3.22
2.62
4.92
6.06
3.44
2.14
7.31
4.24
5.20
16.7%
-26.1%
32.8%
-22.7%
-16.6%
-16.3%
7.2%
38.3%
1.4%
81.6%
36.5%
118.3%
-6.4%
-14.1%
12.0%
60.0%
1.8%
90.9%
-24.2%
18.5%
9.8%
-32.4%
-12.3%
4.4%
175.6%
-30.2%
-24.0%
65.1%
22.8%
118.7%
-44.4%
-2.4%
25.2%
-10.9%
42.3%
2.8%
-36.7%
28.2%
25.0%
0.2%
-20.3%
12.4%
27.5%
46.4%
22.0%
-15.4%
56.5%
-27.1%
63.0%
-51.7%
-45.0%
-24.4%
4.3%
-92.5%
-59.8%
-56.4%
-50.3%
-8.1%
-33.7%
-13.1%
-67.0%
-11.0%
-16.0%
26.2%
-38.7%
2.9%
-58.6%
0.0%
-72.4%
-10.5%
-18.9%
-12.9%
-11.6%
-38.2%
-31.2%
-62.4%
-30.9%
23.3%
53.4%
-5.8%
-3.0%
-18.2%
0.9%
-20.9%
-67.0%
9.9%
-70.3%
-9.6%
-18.1%
-2.9%
-19.0%
6.8%
-78.0%
-6.5%
-71.2%
9.9%
-10.0%
-13.3%
Source: FBI/Uniform Crime Reporting Program Data and U.S. Census Data Note: Florida and Washington, D.C. did not provide data.
A Tale of Two Countries: Racially Targeted Arrests in the Era of Marijuana Reform
99
APPENDIX TABLE B
Drug Arrests and Populations per State (2018)
State
Alabama
Alaska
Arizona
Arkansas
California
Colorado
Connecticut
Delaware
Georgia
Hawai‘i
Idaho
Illinois
Indiana
Iowa
Kansas
Kentucky
Louisiana
Maine
Maryland
Massachusetts
Michigan
Minnesota
Mississippi
Missouri
Montana
Nebraska
Nevada
New Hampshire
New Jersey
New Mexico
New York
North Carolina
North Dakota
Ohio
Oklahoma
Oregon
Pennsylvania
Rhode Island
South Carolina
South Dakota
Tennessee
Texas
Utah
Vermont
Virginia
Washington
West Virginia
Wisconsin
Wyoming
All Drugs
Total
Black
White
Total
Marijuana Marijuana Marijuana Black Pop. White Pop. Total Pop.
Marijuana
Possession Possession Possession
13,598
1,112
34,447
19,762
212,967
18,601
8,348
3,705
86,508
1,873
11,980
34,938
37,129
6,994
4,481
32,001
37,271
3,698
33,974
10,489
30,255
20,609
20,018
41,987
3,001
16,289
11,851
6,357
60,138
8,727
104,911
45,491
5,420
58,008
18,917
15,979
69,838
2,234
71,336
11,073
55,644
160,681
26,938
1,121
51,963
14,089
17,349
33,373
5,841
3,082
410
15,778
10,692
5,454
5,183
2,314
1,150
52,471
679
6,164
9,694
19,187
4,236
2,896
7,600
21,331
825
19,208
906
15,691
8,912
10,413
22,038
1,431
8,751
2,901
2,973
36,050
5,237
58,678
26,565
2,691
31,887
9,057
3,227
33,922
528
38,289
6,587
26,230
74,307
11,782
210
29,303
2,331
8,963
20,963
3,784
2,729
378
14,971
9,599
3,614
4,682
1,781
864
45,029
640
5,827
5,474
16,570
3,835
2,338
6,333
19,135
736
16,883
312
14,089
7,110
8,804
20,835
1,351
7,899
2,326
2,741
32,921
4,730
56,234
24,333
2,527
29,069
7,857
2,914
29,010
400
34,229
6,139
23,285
70,017
10,854
135
26,774
1,952
8,078
18,857
3,425
Source: FBI/Uniform Crime Reporting Program Data and U.S. Census Data.
100
ACLU Research Report
1,678
20
2,115
3,038
463
339
655
494
27,381
38
162
2,564
4,691
937
578
2,964
12,095
47
8,781
91
5,265
2,043
5,406
5,658
66
1,149
649
187
13,484
449
20,603
12,148
368
7,996
2,208
122
8,851
97
19,607
451
9,478
20,628
698
11
12,989
168
1,642
4,380
202
1,048
214
11,335
6,391
2,853
4,210
1,084
360
17,259
199
4,306
1,795
11,617
2,766
1,678
3,295
6,919
682
7,842
204
8,246
4,719
3,116
15,053
1,041
6,469
1,571
2,469
18,767
3,619
30,989
11,860
1,727
14,690
4,960
2,609
19,947
294
14,361
3,175
13,559
48,373
8,896
123
13,221
1,453
5,811
13,448
2,756
1,310,802
27,534
364,280
468,475
2,556,000
259,711
429,298
222,070
3,404,212
29,030
15,775
1,860,101
658,729
120,754
178,520
375,972
1,520,428
21,877
1,867,592
617,097
1,408,392
380,414
1,128,912
724,513
6,233
98,757
305,848
23,293
1,337,754
53,576
3,447,729
2,299,469
25,620
1,517,999
306,890
92,958
1,531,457
88,411
1,380,145
20,956
1,155,631
3,673,157
45,700
8,753
1,691,267
322,826
65,231
389,047
7,557
Note: Florida and Washington, D.C. did not provide data.
3,379,955
470,249
5,937,806
2,356,410
28,531,740
4,959,310
2,859,280
672,019
6,349,613
271,056
1,632,188
9,777,446
5,694,468
2,587,507
2,506,434
3,913,936
2,915,478
1,265,648
3,552,355
5,577,194
7,923,927
4,718,176
1,766,301
5,079,051
941,588
1,703,446
2,253,711
1,264,217
6,416,347
1,718,901
13,619,931
7,319,785
661,549
9,571,522
2,924,365
3,635,926
10,476,085
887,259
3,483,455
743,971
5,315,272
22,605,330
2,865,634
589,986
5,918,670
5,944,924
1,687,993
5,063,526
534,943
4,887,871
709,419
7,171,646
2,980,124
39,557,045
5,695,564
3,572,665
967,171
10,501,080
1,147,287
1,754,208
12,726,363
6,691,878
2,866,103
2,902,183
4,468,402
4,638,940
1,338,404
6,042,718
6,902,149
9,995,915
5,611,179
2,986,530
6,122,811
1,058,637
1,929,268
3,034,392
1,356,458
8,908,520
2,095,428
19,542,209
10,360,922
760,077
11,689,442
3,943,079
4,190,713
12,807,060
1,057,315
5,084,127
867,926
6,770,010
28,681,023
3,161,105
626,299
8,517,685
7,535,591
1,805,832
5,813,568
577,737
APPENDIX TABLE C
Marijuana Laws for all U.S. States and D.C., Years Enacted, as of March 2020
State
Legalized
Decriminalized
Legalized Medical
Alabama
Alaska68
Arizona69
Arkansas70
California71
Colorado72
Connecticut73
Delaware74
District of Columbia75
Florida76
Georgia77
Hawai‘i78
Idaho
2014
Illinois79
Indiana
Iowa
Kansas
Kentucky
2019
Louisiana80
Maine81
Maryland82
Massachusetts83
Michigan84
Minnesota85
Mississippi86
Missouri87
Montana88
Nebraska89
Nevada90
New Hampshire91
New Jersey92
New Mexico93
New York94
North Carolina95
North Dakota96
Ohio97
Oklahoma98
Oregon99
Pennsylvania100
Rhode Island101
South Carolina
South Dakota
Tennessee
Texas
Utah102
Vermont103
Virginia
Washington104
West Virginia105
Wisconsin
Wyoming
2016
2012
2019
1998
2010
2016
1996
2000
2012
2011
1998/2010
2016
2019
2000
2016
2013
2014
2008
2016/2018
1999/2009
2014
2012
2008
2014
2010
2011
2015
2014
2016
2016
2018
1976
1978
2014
2018
2004/2016
1979
2016
2017
2019
2019
1977
2019
1975
2012
2016
2016
2019
1998
2016
2006
2013
2018
2004
2014
2018
2012
1998/2000
2013
2010
2007
2014
1998
2017
A Tale of Two Countries: Racially Targeted Arrests in the Era of Marijuana Reform
101
Endnotes
recreational consumption (see Appendix, Table C for full list and
dates).
9
1
American Civil Liberties Union, The War on Marijuana
in Black and White (New York: ACLU, June 2013),
https://www.aclu.org/report/report-war-marijuanablack-and-white?redirect=criminal-law-reform/
war-marijuana-black-and-white.
2
Throughout this report we capitalize “Black” when referring to
Black people, whereas we do not capitalize “white” when referring
to white people. Capitalizing “Black” allows for Black populations
to be written about in the same manner as other ethnic groups, such
as Latinx, Asian, or British. However, “white” remains lowercase
as it is not a similar ethnic signifier. The capitalization of “Black”
also raises the visibility and prominence of a population who has
often been erased, marginalized, and stripped of its importance. In
adopting this style, we follow other organizations that have officially
adapted their editorial style in this manner, such as the Brookings
Institute, Conscious Company, and DiversityInc, among others.
3
4
This report includes data from 49 of the 50 U.S. states. Florida
and Washington, D.C., do not report data to the FBI’s Uniform
Crime Reporting (UCR) Program, and, thus, we submitted
Freedom of Information Act (FOIA) requests to Washington, D.C.’s
Metropolitan Police Department (MPD) and the Florida Department
of Law Enforcement. Despite the D.C. Mayor’s Office of Legal
Counsel ruling ordering MPD to produce responsive records within
five business days, D.C. did not provide data in an appropriate, timely
manner for analysis in this report. Florida refused to provide any
data in response to the FOIA request.
The reason that possession arrest rates do not drop to zero even
when possession of marijuana is legalized or decriminalized is that
there remain certain circumstances where individuals still can be
arrested for marijuana possession. The specific reasons for these
possible arrests somewhat differ by state, but common examples
include possession arrests for juveniles to whom legalization does
not apply, or violations of specific elements of the law, such as
exceeding the legal amount permitted to possess or using marijuana
in a prohibited location.
5
Pew Research Center, Race in America 2019 (Washington, D.C.:
Pew Research Center, April 2019), https://www.pewsocialtrends.
org/2019/04/09/race-in-america-2019/. This report finds that
Latinx people are more likely to be identified as white than Black,
and that Latinx people perceived as nonwhite are more likely to
report experiencing discrimination or being treated unfairly because
of their race than those perceived as white.
6
Joseph E. Kennedy, Isaac Unah, and Kasi Wahlers, “Sharks and
Minnows in the War on Drugs: A Study of Quantity, Race and Drug
Type in Drug Arrests,” UC Davis Law Review 52, no. 2 (December
2018): 743, https://lawreview.law.ucdavis.edu/issues/52/2/
Articles/52-2_Kennedy.pdf.
7
Washington (2012), Colorado (2012), Oregon (2014), Alaska (2014),
Washington, D.C. (2014), California (2016), Massachusetts (2016),
Maine (2016), Nevada (2016), Vermont (2018), Michigan (2018), and
Illinois (2019).
8
Before legalizing marijuana for recreational use, many of the
states mentioned passed decriminalization measures. To date, 15
states have decriminalized marijuana but have not legalized it for
102
ACLU Research Report
Mike Males and Lizzie Buchen, Reforming Marijuana Laws: Which
Approach Best Reduces the Harms of Criminalization? A Five-State
Analysis (San Francisco: Center on Juvenile and Criminal Justice,
September 2014), http://www.cjcj.org/uploads/cjcj/documents/cjcj_
marijuana_reform_comparison.pdf. See also Drug Policy Alliance,
Marijuana Decriminalization and Legalization (New York: DPA,
February 2018), http://www.drugpolicy.org/sites/default/files/
marijuanalegalizationanddecriminalization_factsheet_feb2018_0.
pdf.
10 Drug Policy Alliance, From Prohibition to Progress: A Status
Report on Marijuana Legalization (New York: DPA, January 2018),
http://www.drugpolicy.org/sites/default/files/dpa_marijuana_
legalization_report_feb14_2018_0.pdf.30.
11 “FBI: Marijuana Arrests Rise for Third Year in a Row, Outpace
Arrests for All Violent Crimes,” National Organization for the
Reform of Marijuana Laws, October 3, 2019, https://norml.org/
news/2019/10/03/fbi-marijuana-arrests-rise-for-third-year-in-a-rowoutpace-arrests-for-all-violent-crimes.
12 ACLU, The War on Marijuana in Black and White.
13 Throughout this report we capitalize “Black” when referring to
Black people, whereas we do not capitalize “white” when referring
to white people. Capitalizing “Black” allows for Black populations
to be written about in the same manner as other ethnic groups, such
as Latinx, Asian, or British. However, “white” remains lowercase
as it is not a similar ethnic signifier. The capitalization of “Black”
also raises the visibility and prominence of a population who has
often been erased, marginalized, and stripped of its importance. In
adopting this style, we follow other organizations that have officially
adapted their editorial style in this manner, such as the Brookings
Institute, Conscious Company, and DiversityInc, among others.
14 Craig Reinarman, “Social Construction of Drug Scares,”
in Constructions of Deviance: Social Power, Context, and Interaction,
eds. Patricia A. Adler and Peter Adler (Belmont, CA: Wadsworth
Publishing Co., 1994), 92–105; Matthew D. Lassiter, “Impossible
Criminals: The Suburban Imperatives of America’s War on
Drugs,” Journal of American History 102, no. 1 (June 2015): 126–40,
https://doi.org/10.1093/jahist/jav243; Laura Smith, “How a Racist
Hate-Monger Masterminded America’s War on Drugs,” Timeline,
February 28, 2018, https://timeline.com/harry-anslinger-racist-waron-drugs-prison-industrial-complex-fb5cbc281189?gi=cbf7ef9a2741;
David McDonald, “The Racist Roots of Marijuana
Prohibition,” Foundation for Economic Education, April 11, 2017,
https://fee.org/articles/the-racist-roots-of-marijuana-prohibition.
15 Dan Baum, “Legalize It All,” Harper’s Magazine, April 2016, https://
harpers.org/archive/2016/04/legalize-it-all.
16 Suchitra Rajagopalan, “United Nations and World Health
Organization Call for Drug Decriminalization,” Drug Policy Alliance,
June 29, 2017, http://www.drugpolicy.org/blog/united-nationsand-world-health-organization-call-drug-decriminalization. In 2016,
the ACLU and Human Rights Watch (HRW) released the report
Every 25 Seconds, calling for federal and state governments to end
the criminalization of the personal use of drugs and the possession
of drugs for personal use. HRW and ACLU, Every 25 Seconds: The
Human Toll of Criminalizing Drug Use in the United States (New
York: Human Rights Watch, October 2016), https://www.hrw.org/
sites/default/files/report_pdf/usdrug1016_web_0.pdf.
17 Lucas Laursen, “Canada Today Becomes the Second Country to
Legalize Weed. Here’s What It Can Learn From the First,” Fortune
Magazine, October 17, 2018, https://fortune.com/2018/10/17/
canada-marijuana-weed-legalization-uruguay/.
18 Justin McCarthy, “Two in Three Americans Now Support Legalizing
Marijuana,” Gallup, October 22, 2018, https://news.gallup.com/
poll/243908/two-three-americans-support-legalizing-marijuana.
aspx.
19 James Cole, memorandum for all United States attorneys, “Guidance
Regarding Marijuana Enforcement,” August 29, 2013, https://www.
justice.gov/iso/opa/resources/3052013829132756857467.pdf.
20 Ashley Southall and Jack Healy, “U.S. Won’t Sue to Reverse States’
Legalization of Marijuana,” New York Times, August 29, 2013,
https://www.nytimes.com/2013/08/30/us/politics/us-says-it-wontsue-to-undo-state-marijuana-laws.html.
21 Thomas Fuller, “Recreational Pot Is Officially Legal in
California,” New York Times, January 1, 2018, https://www.nytimes.
com/2018/01/01/us/legal-pot-california.html.
22 German Lopez, “January Was the Biggest Month yet
for Marijuana Legalization, Despite Trump’s New
War on Pot,” Vox, January 31, 2018, https://www.
vox.com/policy-and-politics/2018/1/31/16924726/
marijuana-legalization-california-vermont-january-2018.
23 Jefferson Sessions, memorandum for all United States attorneys,
“Marijuana Enforcement,” January 4, 2018, https://www.justice.gov/
opa/press-release/file/1022196/download.
24 John G. Roberts Jr., 2019 Year-End Report on the Federal Judiciary
(Washington, D.C.: Public Information Office of the United States
Supreme Court, December 2019), https://www.supremecourt.gov/
publicinfo/year-end/2019year-endreport.pdf.
25 Sara Brittany Somerset, “Attorney General Barr Favors a More
Lenient Approach to Cannabis Prohibition,” Forbes, April 15, 2019,
https://www.forbes.com/sites/sarabrittanysomerset/2019/04/15/
attorney-general-barr-favors-a-more-lenient-approach-to-cannabislegalization/#7ca35a2ec4c8.
26 Benjamin Goggin, “Black People Face Big Barriers Entering the
Legal Weed Industry,” Vice, September 20, 2018, https://www.vice.
com/en_us/article/yw4pkw/weed-industry-equity-Black-business.
27 “Marijuana Justice Coalition Asserts Statement of Principles on
Federal Marijuana Reform,” Human Rights Watch, July 9, 2019,
https://www.hrw.org/news/2019/07/09/marijuana-justicecoalition-asserts-statement-principles-federal-marijuana-reform#.
28 Harry G. Levine and Deborah Peterson Small, Marijuana Arrest
Crusade (New York: New York Civil Liberties Union, April 2008),
http://marijuana-arrests.com/docs/MARIJUANA-ARRESTCRUSADE.pdf.
29 In February 2019, the Bronx Public Defenders addressed this matter
during their testimony before the New York City Council on the
subject of marijuana legalization and policing in their city. “The
truth is that marijuana enforcement is rarely about marijuana. It
has always been a vehicle for policing and surveillance and social
control of certain communities. If we want to get to the heart of the
problem, we need to address these issues. Our clients have long
been targeted by the NYPD for marijuana enforcement based on
their race and socioeconomic status. The legalization effort must
take this into account and make them whole. Anything short of this
is unacceptable.” Eli Northrup, written testimony, “Hearing re:
Marijuana Legalization: Equity and Justice for NYC” (February
27, 2019), https://www.bronxdefenders.org/wp-content/
uploads/2019/03/City-Council-Testimony-Marijuana.pdf.
30 Amanda Geller, Jeffrey Fagan, Tom Tyler, and Bruce G. Link,
“Aggressive Policing and the Mental Health of Young Urban
Men,” American Journal of Public Health 104, no. 12 (December
2014): 2321–2327, https://doi.org/10.2105/AJPH.2014.302046.
31 Substance Abuse and Mental Health Service Administration,
Results from the 2018 National Survey on Drug Use and Health:
Detailed Tables (Washington, D.C.: SAMHSA, August 2019),
https://www.samhsa.gov/data/sites/default/files/cbhsq-reports/
NSDUHDetailedTabs2018R2/NSDUHDetailedTabs2018.pdf. See
Table 1.26B, which finds that in 2018, reported marijuana use during
the prior year among individuals age 18 and older was 16.8% for white
people and 18.2% for Black people.
32 “Overall, marijuana dominates all other types of drugs in terms of
arrests. Black and Hispanic people are arrested disproportionately in
terms of their share of the overall population.” Kennedy, “Sharks and
Minnows,” 746–747.
33 Sagiv Galai, “Equity Must Be at the Heart of Marijuana
Legalization,” ACLU, June 26, 2019, https://www.
aclu.org/blog/criminal-law-reform/drug-law-reform/
equity-must-be-heart-marijuana-legalization.
34 Manhattan District Attorney’s Office, “DA Vance: Marijuana
Prosecutions Down 94% in First Quarter of New Policy,” press
release, November 1, 2018, https://www.manhattanda.org/da-vancemarijuana-prosecutions-down-94-in-first-quarter-of-new-policy/.
35 Jolie McCullough, “Austin Police Chief: We Will Still
Ticket, Arrest for Marijuana,” Texas Tribune, January
24, 2020, https://www.texastribune.org/2020/01/24/
austin-texas-police-chief-marijuana-arrests-will-continue/.
36 In 2003, Seattle voters approved a measure that set marijuana
policing as low law enforcement priority. At least 15 other cities
have followed Seattle’s footsteps. “Seattle Voters Approve Initiative
Making Marijuana Enforcement City’s ‘Lowest Priority,’” National
Organization for the Reform of Marijuana Laws, September 18,
2003, https://norml.org/news/2003/09/18/seattle-voters-approveinitiative-making-marijuana-enforcement-city-s-lowest-priority.
37 States are categorized based on their most liberal law to date. For
example, a state that legalized marijuana for medical use and
later legalized recreational use is counted among “legalized.” See
Appendix, Table C for full list of marijuana laws by state.
38 “Any changes to Wisconsin’s current marijuana policy appear
unlikely, with state lawmakers recently saying they won’t consider
a proposal to allow medical use. But that isn’t stopping state
residents from going to Illinois to buy legal weed.” Corrinne
Hess, “Wisconsin Residents Head to Illinois to Buy Legal
Weed,” Wisconsin Public Radio, January 2, 2020, https://www.wpr.
org/wisconsin-residents-head-illinois-buy-legal-weed.
A Tale of Two Countries: Racially Targeted Arrests in the Era of Marijuana Reform
103
39 “These Nonviolent Inmates ServingLife without Parole for
Marijuana Need Clemency from President Trump,” Life for Pot,
accessed March 3, 2020, https://www.lifeforpot.com/inmatesover-62.html.
40 Using UCR data, the FBI reported that in 2018, law enforcement
officials across the country had made more than 10 million arrests.
Of these, 521,103 were for “violent crime.” As noted in our report,
that is less than the total marijuana arrests made that year. See
Federal Bureau of Investigation, Crime in the United States, 2018
(Washington, D.C.: U.S. Department of Justice, 2019), https://ucr.
fbi.gov/crime-in-the-u.s/2018/crime-in-the-u.s.-2018/topic-pages/
persons-arrested.pdf.
41 The National Archive of Criminal Justice Data produced the arrest
data by age, sex, and race for all years up until 2016. Since the FBI
moved to an incident bases system, they have yet to publish results
for 2017–2018. We used the FBI’s API for their new system to acquire
marijuana arrest data for 2017–2018 (as detailed in the Methodology
and Limitations section), but the data is currently not available for
other drug types.
42 Violent crimes, according to the FBI’s definition, include murder and
non-negligent manslaughter, rape, robbery, and aggravated assault.
43 We provide profiles for 49 states. There are no profiles for Florida
and Washington, D.C. because they failed to provide us data for this
report (see Methodology and Limitations section for more detailed
information).
decriminalization laws states have enacted. For that reason, and
because this report is focused on marijuana arrests between 2010–
2018, which is also the extent of the marijuana arrest data we sought,
we have only analyzed arrest data pre-and post-decriminalization
individually by state for states that have enacted such laws since 2010
(shown in Figure 8).
48 David Brand, “Nearly Every Single Person Arrested for Weed in NYC
This Year Was Black or Latinx,” Queens Daily Eagle, August 21, 2019,
https://queenseagle.com/all/nearly-every-single-person-arrestedfor-weed-in-nyc-this-year-was-black-or-latinx.
49 ACLU, The War on Marijuana in Black and White.
50 SAMSHA, Results from the 2018 National Survey on Drug Use and
Health. See Table 1.26B.
51 For a total of 49 states, as Florida and Washington, D.C., did not
provide data for this report (see Methodology and Limitations section
for further details).
52 Counties have >50% coverage when more than 50% of their population
is covered by an agency that reports 12 months of data to the
UCR Program. More information on coverage is available in the
Methodology and Limitations section of this report.
53 ACLU, The War on Marijuana in Black and White, 110-112.
54 Id.
44 The states that passed laws in the 1970s were often quite limited
in terms of the scope of activity decriminalized or contained
loopholes that police departments could exploit, and thus were
less comprehensive than the more recent decriminalization laws
that have been enacted. For that reason, and because this report is
focused on marijuana arrests between 2010–2018, which is also the
extent of the marijuana arrest data we sought, we have only analyzed
arrest data pre-and post-decriminalization individually by state for
states that have enacted such laws since 2010 (shown in Figure 8).
However, the states that decriminalized in the 1970s are included
in the aggregate analysis of all decriminalized states (as shown in
Figure 6).
55 Drug Policy Alliance, From Prohibition to Progress, 7.
45 As discussed in greater detail in Endnote 4, possession arrest rates
do not drop to zero even when possession of marijuana is legalized or
decriminalized because there remain certain circumstances in which
individuals can still be arrested for marijuana possession.
58 Id.
46 The national rate ratio of racial disparities in 2018 (3.64) is higher
than the 2018 rate ratios for all three of the subgroups in Figure 6
(Fully Illegal, Decriminalized, Legal) because white people are more
likely than Black people to live in a state that has legalized marijuana.
Baseline rates of arrests for both racial groups are much lower in
states that have legalized, but only 10.6% of the Black people in this
analysis live in a legalized state, compared to 22.6% of white people.
For background information, see Agresti, Alan. Categorical data
analysis. Wiley-Interscience, 1990 or Good, I. J., and Y. Mittal. “The
amalgamation and geometry of two-by-two contingency tables.” The
Annals of Statistics (1987): 694-711.
60 See ACLU Drug Policy Litigation Project, Collateral Consequences of
the War on Drugs (New Haven, CT: ACLU, January 2003), https://
www.aclu.org/sites/default/files/field_document/final%20brochure.
pdf.
47 While a handful of states passed laws in the 1970s removing criminal
penalties for certain marijuana offenses (see Table 5), such laws were
often quite limited in terms of the scope of activity decriminalized or
contained loopholes that police departments could take advantage
of, and thus were less comprehensive than the more recent
104
ACLU Research Report
56 Ben Markus, “As Adults Legally Smoke Pot in Colorado, More
Minority Kids Arrested For It,” National Public Radio, June 29, 2016,
https://www.npr.org/2016/06/29/483954157/as-adults-legallysmoke-pot-in-colorado-more-minority-kids-arrested-for-it.
57 ACLU of North Carolina, At All Costs: The Consequences of Rising
Court Fines and Fees in North Carolina (Raleigh, NC: ACLU, April
2019): 38-9, https://www.acluofnorthcarolina.org/sites/default/
files/field_documents/aclu_nc_2019_fines_and_fees_report_17_
singles_final.pdf.
59 In jurisdictions where nonpayment can still result in incarceration,
individuals must be provided with an attorney.
61 Mariah Woelfel, “How Is Marijuana Expungement Working
in Illinois?,” National Public Radio, October 17, 2019,
https://www.npr.org/local/309/2019/10/17/770701388/
how-is-marijuana-expungement-working-in-illinois.
62 See Allie Howell, Criminal Conviction Restrictions for Marijuana
Licensing (Los Angeles: Reason Foundation, September 2018),
7–11, https://reason.org/wp-content/uploads/criminal-convictionrestrictions-for-marijuana-licensing.pdf.
63 See “Lowest Law Enforcement Priority Jurisdictions,” Marijuana
Policy Project, https://www.mpp.org/issues/criminal-justice/
lowest-law-enforcement-priority-jurisdictions/.
See also San Francisco, Cal., Admin. Code § 96B, Policy Making
Marijuana Offenses the Lowest Law Enforcement Priority.
76 Florida Medical Marijuana Legalization Initiative, Florida Ballot
Amendment 2 (approved by voters November 2016).
77 Georgia’s Hope Act, H.B. 324, 2019 Leg., Reg. Sess. (Ga. 2019).
64 See End Racial Profiling Act of 2015, H.R. 1933, 114th Cong. (2015).
See also The Racial and Identity Profiling Act of 2015, A.B. 953, 2015
Leg., Reg. Sess. (Ca. 2015); “10 Best Practices for Writing Policies
Against Racial Profiling,” Southern Poverty Law Center, October
23, 2018, https://www.splcenter.org/20181023/10-best-practiceswriting-policies-against-racial-profiling.
65 Terry v. Ohio, 392 U.S. 1 (1968)
66 United States Office of Management and Budget, A Budget for
America’s Future: Analytical Perspectives (Washington, D.C.: U.S.
Government Publishing Office, 2020), https://www.whitehouse.gov/
wp-content/uploads/2020/02/spec_fy21.pdf.
67 See Daniel Ross, “Newark’s New Disciplinary Board Could Flex Rare
Muscle over Police,” Yes Magazine, September 11, 2015, https://www.
yesmagazine.org/social-justice/2015/09/11/newarks-new-civilianboard-could-wield-rare-disciplinary-muscle-over-police/; “Community
Oversight,” Campaign Zero, accessed March 10, 2020, https://www.
joincampaignzero.org/oversight.
68 Alaska Medical Marijuana Act, Alaska Ballot Measure 8 (approved by
voters November 1998); An Act to Tax and Regulate the Production,
Sale, and Use of Marijuana, Alaska Ballot Measure 2 (approved by
voters November 2014).
69 Arizona Medical Marijuana Act, Arizona Ballot Proposition 203
(approved by voters November 2010).
70 Arkansas Medical Marijuana Amendment, Arkansas Ballot Issue 6
(approved by voters November 2016).
71 Medical Use of Marijuana Initiative, California Ballot Proposition
215 (approved by voters November 1996); An Act to Amend Section
11357 of the Health and Safety Code, and to Amend Section 23222 of
the Vehicle Code, Relating to Controlled Substances, S.B. 1449, 2010
Leg., Reg. Sess. (Ca. 2010); Control, Regulate and Tax Adult Use of
Marijuana Act, California Ballot Proposition 64 (approved by voters
November 2016).
72 Colorado Medical Use of Marijuana Initiative, Colorado Ballot
Amendment 20 (approved by voters November 2000); Use and
Regulation of Marijuana Initiative, Colorado Ballot Amendment 64
(approved by voters November 2012).
73 An Act Concerning the Penalty for Certain Nonviolent Drug Offenses,
S.B. 1014, 2011 Leg., Reg. Sess. (Ct. 2011); An Act Concerning the
Palliative Use of Marijuana, H.B. 5389, 2012 Leg., Reg. Sess. (Ct.
2012).
74 An Act to Amend Title 16 of the Delaware Code Creating the
Delaware Medical Marijuana Act, S.B. 17, 146th Leg., Reg. Sess. (De.
2011); An Act to Amend Title 16 of the Delaware Code Relating to
Marijuana, H.B. 39, 148th Leg., Reg. Sess. (De. 2015).
75 Legalization of Marijuana for Medical Treatment Amendment
Act of 2010, Council Act 18-429, 18th Leg., Reg. Sess. (D.C. 2010);
Legalization of Possession of Minimal Amounts of Marijuana
for Personal Use Initiative Act of 2014, Washington, D.C., Ballot
Initiative Measure 71 (approved by voters November 2014).
78 Medical Use of Marijuana, S.B. 862, 20th Leg., Reg. Sess. (Hi. 2000);
A Bill for an Act Relating to Marijuana, H.B. 1383, 30th Leg. Reg.
Sess. (Hi. 2019).
79 The Compassionate Use of Medical Cannabis Pilot Program Act,
H.B. 1, 98th Leg., Reg. Sess. (Il. 2013); An Act Concerning Criminal
Law, S.B. 2228, 99th Leg., Reg. Sess. (Il. 2016) (amending the
Cannabis Control Act at 720 Ill. Comp. Stat. Ann. 550); The Cannabis
Regulation and Tax Act, H.B. 1438, 101st Leg., Reg. Sess. (Il. 2019).
80 Louisiana Therapeutic Marijuana Act, S.B. 271, 2016 Leg., Reg. Sess.
(La. 2016).
81 Maine Medical Marijuana for Specific Illnesses, Maine Ballot
Question 2 (approved by voters November 1999), amended by Maine
Medical Marijuana Initiative, Maine Ballot Question 5 (approved by
voters November 2009); Marijuana Legalization Act, Maine Ballot
Question 1 (approved by voters November 2016).
82 An Act Concerning Medical Marijuana — Natalie M. LaPrade Medical
Marijuana Commission, H.B. 881, 434th Leg., Reg. Sess. (Md. 2014).
An Act Concerning Criminal Law — Possession of Marijuana — Civil
Offense, S.B. 364, 434th Leg., Reg. Sess. (Md. 2014).
83 An Act Establishing a Sensible State Marihuana Policy, H.B. 4468,
185th Leg., Reg. Sess. (Ma. 2008); An Initiative Petition for a Law for
the Humanitarian Medical Use of Marijuana, Massachusetts Ballot
Question 3 (approved by voters November 2012); The Regulation and
Taxation of Marijuana Act, H.B. 3932, 189th Leg., Reg. Sess. (Ma.
2016).
84 Medical Marijuana Initiative, Michigan Proposal 1 (approved by
voters November 2008); Michigan Regulation and Taxation of
Marihuana Act, Proposal 1 (approved by voters November 2018).
85 In 1976, Minnesota amended its possession and sale laws as related
to petty marijuana offenses, codified at Minn. Stat. § 152.027(a).
Minnesota Medical Cannabis Therapeutic Research Act, S.F. 2470,
88th Leg., Reg. Sess. (Mn. 2014).
86 In 1978, Mississippi amended its marijuana possession laws, codified
at Miss. Code Ann. § 41-29-139(c)(2).
87 An Act Modifying Provisions Relating to Criminal Law, S.B. 491,
97th Leg., 2nd Reg. Sess. (Mo. 2014); Medical Marijuana and Veteran
Healthcare Services Initiative, Missouri Amendment 2 (approved by
voters November 2018).
88 Montana Medical Marijuana Allowance Initiative, Montana Ballot
Initiative 148 (approved by voters November 2004); reformed by An
Act Establishing Montana Marijuana Act and Revising Laws Relating
to the Use of Marijuana, S.B. 423, 62nd Leg., Reg. Sess. (Mt. 2011);
amended by Montana Medical Marijuana Act, Ballot Initiative 182
(approved by voters November 2016).
89 In 1979, Nebraska amended its marijuana possession laws, codified
at R.R.S. Neb. § 28-416(13).
90 Nevada Medical Marijuana Act: Initiative Relating to the Use of a
Plant of the Genus Cannabis for Medical Purposes, Nevada Ballot
A Tale of Two Countries: Racially Targeted Arrests in the Era of Marijuana Reform
105
Question 9 (approved by voters November 1998); Nevada Medical
Marijuana Act, Nevada Ballot Question 9 (approved by voters
November 2000); Nevada Marijuana Legalization Act: Initiative to
Regulate and Tax Marijuana, Nevada Ballot Question 2 (approved by
voters November 2016).
91 An Act Relative to the Use of Cannabis for Therapeutic Purposes, H.B.
573, 2013 Leg., Reg. Sess. (Nh. 2013); An Act Relative to the Penalties
for Possession of Marijuana, H.B. 640, 2017 Leg., Reg. Sess. (Nh.
2017).
92 New Jersey Compassionate Use Medical Marijuana Act, S.B. 119,
213th Leg., Reg. Sess. (Nj. 2010).
93 The Lynn and Erin Compassionate Use Act, S.B. 523, 48th Leg., 1st
Sess. (Nm. 2007); Decreasing Penalties for Possession of Marijuana
and of Drug Paraphernalia, S.B. 323, 54th Leg., 1st Sess. (Nm 2019).
94 Medical Use of Marijuana, S.B. 7923, 2014 Leg., Reg. Sess. (Ny.
2014); An Act to Amend the Penal Law and the Criminal Procedure
Law, S.B. 6579, 2019 Leg., Reg Sess. (Ny. 2019).
95 In 1977, North Carolina amended its marijuana possession laws to
classify low-level possession as a Class C misdemeanor and remove
the threat of imprisonment, codified at N.C. Gen. Stat. § 90-95(d).
96 North Dakota Compassionate Care Act, North Dakota Initiated
Statutory Measure 5 (approved by voters November 2016); An Act to
Amend and Reenact North Dakota Marijuana Laws, H.B. 1050, 66th
Leg., Reg. Sess. (Nd. 2019).
97 In 1975, Ohio amended its marijuana possession laws, classifying
low-level possession as a minor misdemeanor, codified at ORC Ann.
2925.11(C)(3). Medical Marijuana Control Program Act, H.B. 523,
131st Leg., Reg. Sess. (Oh. 2016).
98 Medical Marijuana Legalization Initiative, Oklahoma State Question
788 (approved by voters June 2018); amended by Oklahoma Medical
Marijuana and Patient Protection Act, H.B. 2612, 2019 Leg., Reg.
Sess. (Ok. 2019).
99 Oregon Medical Marijuana Act, Oregon Ballot Measure 67 (approved
by voters November 1998); Control, Regulation, and Taxation of
Marijuana and Industrial Hemp Act, Oregon Ballot Measure 91
(approved by voters November 2014).
100 Medical Marijuana Act, S.B. 3, 2015 Leg., Reg. Sess. (Pa. 2016).
101 The Edward O. Hawkins and Thomas C. Slater Medical Marijuana
Act, S.B. 0710, 2005 Leg., Jan. Sess. (Ri. 2005) (enacted by overriding
governor’s veto in January 2006); Uniform Controlled Substance Act,
S.B. 2253, 2012 Leg., Jan. Sess. (Ri. 2012).
102 Utah Medical Cannabis Act, Utah Proposition 2 (approved by voters
November 2018); amended by Medical Cannabis Amendments, S.B.
1002, 2019 Leg., 1st Spec. Sess. (Ut. 2019).
103 An Act Relating to the Medical Use of Marijuana, S.B. 76, 2004
Leg., Reg. Sess. (Vt. 2004); An Act Relating to Civil Penalties for
Possession of Marijuana, H. 200, 2013 Leg., Reg. Sess. (Vt. 2013);
An Act Relating to Eliminating Penalties for Possession of Limited
Amounts of Marijuana by Adults 21 Years of Age or Older, H. 511,
2018 Leg., Reg. Sess. (Vt. 2018).
106
ACLU Research Report
104 Washington Medical Marijuana Initiative, Washington Initiative
692 (approved by voters November 1998); Washington Marijuana
Legalization and Regulation, Washington Initiative 502 (approved by
voters November 2012).
105 West Virginia Medical Cannabis Act, S.B. 386, 2017 Leg., Reg. Sess.
(Wv. 2017).