
Suicide and Homicide in State Prisons and Local Jails, DOJ BJS, 2004
Download original document:
Document text
Document text
This text is machine-read, and may contain errors. Check the original document to verify accuracy.
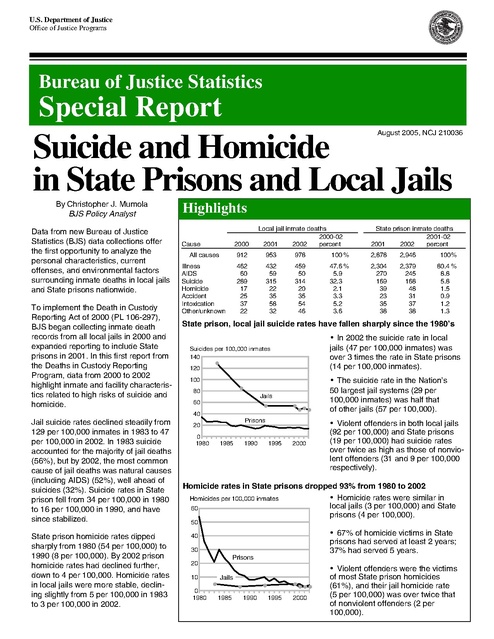
U.S. Department of Justice
Office of Justice Programs

Bureau of Justice Statistics

Special Report
August 2005, NCJ 210036

Suicide and Homicide
in State Prisons and Local Jails
By Christopher J. Mumola
BJS Policy Analyst
Data from new Bureau of Justice
Statistics (BJS) data collections offer
the first opportunity to analyze the
personal characteristics, current
offenses, and environmental factors
surrounding inmate deaths in local jails
and State prisons nationwide.
To implement the Death in Custody
Reporting Act of 2000 (PL 106-297),
BJS began collecting inmate death
records from all local jails in 2000 and
expanded reporting to include State
prisons in 2001. In this first report from
the Deaths in Custody Reporting
Program, data from 2000 to 2002
highlight inmate and facility characteristics related to high risks of suicide and
homicide.

Highlights
Cause

2000

Local jail inmate deaths
2000-02
2001
2002
percent

All causes

912

953

978

100 %

2,878

2,946

100%

Illness
AIDS
Suicide
Homicide
Accident
Intoxication
Other/unknown

462
60
289
17
25
37
22

432
59
315
22
35
58
32

459
50
314
20
35
54
46

47.6 %
5.9
32.3
2.1
3.3
5.2
3.6

2,304
270
169
39
23
35
38

2,379
245
168
48
31
37
38

80.4 %
8.8
5.8
1.5
0.9
1.2
1.3

State prison, local jail suicide rates have fallen sharply since the 1980’s
w In 2002 the suicide rate in local
jails (47 per 100,000 inmates) was
over 3 times the rate in State prisons
(14 per 100,000 inmates).

Suicides per 100,000 inmates
140
120

w The suicide rate in the Nation’s
50 largest jail systems (29 per
100,000 inmates) was half that
of other jails (57 per 100,000).

100
80

Jails

60
40

Jail suicide rates declined steadily from
129 per 100,000 inmates in 1983 to 47
per 100,000 in 2002. In 1983 suicide
accounted for the majority of jail deaths
(56%), but by 2002, the most common
cause of jail deaths was natural causes
(including AIDS) (52%), well ahead of
suicides (32%). Suicide rates in State
prison fell from 34 per 100,000 in 1980
to 16 per 100,000 in 1990, and have
since stabilized.
State prison homicide rates dipped
sharply from 1980 (54 per 100,000) to
1990 (8 per 100,000). By 2002 prison
homicide rates had declined further,
down to 4 per 100,000. Homicide rates
in local jails were more stable, declining slightly from 5 per 100,000 in 1983
to 3 per 100,000 in 2002.

State prison inmate deaths
2001-02
2001
2002
percent

Prisons

20
0
1980

1985

1990

1995

2000

y Violent offenders in both local jails
(92 per 100,000) and State prisons
(19 per 100,000) had suicide rates
over twice as high as those of nonviolent offenders (31 and 9 per 100,000
respectively).

Homicide rates in State prisons dropped 93% from 1980 to 2002
Homicides per 100,000 inmates
y Homicide rates were similar in
local jails (3 per 100,000) and State
60
prisons (4 per 100,000).
50

y 67% of homicide victims in State
prisons had served at least 2 years;
37% had served 5 years.

40
30

Prisons

20
10
0
1980

Jails
1985

1990

1995

2000

y Violent offenders were the victims
of most State prison homicides
(61%), and their jail homicide rate
(5 per 100,000) was over twice that
of nonviolent offenders (2 per
100,000).

The Death in Custody Reporting Act of 2000
The passage of the Death in Custody Reporting Act of
2000 (DICRA, PL 106-297) dramatically altered programs
collecting data on inmate deaths. Prior to the act, BJS
conducted annual counts of State prisoner deaths. Counts
of jail inmate deaths were collected in the Census of Jails,
which is conducted every 5 or 6 years. For both populations, death counts were obtained by gender and by
general cause categories, such as illness/natural causes,
AIDS, suicide, and homicide. These aggregate counts of
deaths did not allow for analysis of individual death cases.
DICRA was attached as a grant requirement of the Violent
Offender Incarceration and Truth-in-Sentencing (VOI/TIS)
incentive grant program. Beginning in 1996, these grants
provided over $2.5 billion to all 50 States and U.S. Territories for expanding prison capacity to house violent offenders for longer periods. Each State receiving VOI/TIS funds
was required under DICRA to report:

"on a quarterly basis, information regarding the death
of any person who is in the process of arrest,
is en route to be incarcerated, or is incarcerated at a
municipal or county jail, State prison, or other local or
State correctional facility (including any juvenile
facility) that, at a minimum, includes —

(A) the name, gender, race, ethnicity, and age of the
deceased;
(B) the date, time, and location of death; and
(C) a brief description of the circumstances surrounding the death."
BJS developed a new series of collections to meet the
mandates of the act. Aggregate counts of deaths were
replaced by detailed, individual inmate death records,
collected every 3 months from over 3,000 jail jurisdictions,
50 State prison systems, juvenile correctional authorities
in all 50 States, and roughly 18,000 State and local law
enforcement agencies nationwide. These new data collections were phased in over 4 years, with local jails reporting
in 2000, followed by State prisons in 2001 and State
juvenile authorities in 2002. A network of statewide law
enforcement reporters began submitting arrest-related
death records to BJS in 2003.
With these new collections, BJS has enhanced both the
frequency and scope of its data on inmate mortality.
Among other improvements, BJS now collects information
on specific medical causes of death, as determined by a
coroner or medical examiner. BJS replaced a general
category of "illness/natural causes," with specific categories of medical conditions related to mortality, such as
cancer, heart disease, and hepatitis C. A detailed analysis
of these fatal medical conditions will be the focus of the
next report from this data collection series.

Long term trends show steep declines in rates of State prisoner homicide and local jail inmate suicide
Over the past two decades, State prison and local jail
Local jail inmate mortality rate, per 100,000 inmates
All
Illness/
inmate mortality rates have displayed some dynamic
AIDS
Suicide
Homicide
Year
causes natural cause
changes. Suicide was the leading cause of death among
2002
147
69
8
47
3
jail inmates in 1983 (129 per 100,000 inmates); by 1993
2001
151
68
9
50
3
that rate had been cut by more than half (54 per 100,000
2000
147
74
10
47
3
inmates), and illness/natural cause (67 per 100,000) had
1999
154
64
13
54
5
1993
149
67
15
54
4
become the most common cause of jail deaths. By 2002
1988
199
82
20
85
3
the jail suicide rate (47 per 100,000) had fallen to nearly a
1983
232
88
-129
5
third of the 1983 rate. Rates of death from AIDS-related
Note: Mortality rates are based on average daily population for each
causes in jails also declined; the 2002 rate (8 per 100,000)
year. Data on deaths for 1983-99 are from the Census of Jails; data
from 2000-02 are from the Deaths in Custody data series.
was less than half of the 1988 rate (20 per 100,000). As a
-- Not available.
result of these reductions, the overall mortality rate in local
jails dropped 37% between 1983 and 2002.
State prison inmate mortality rate, per 100,000 inmates
State prison suicide rates have historically been much
lower than those of jails, but these also dropped sharply
from 34 per 100,000 in 1980 to 14 per 100,000 inmates
in 2002. Even more dramatic was the decline in homicide
deaths, from 54 per 100,000 inmates in 1980 to 8 per
100,000 inmates in 1990, and to 4 per 100,000 inmates
in 2002. With the introduction of new therapies during the
1990’s, AIDS-related mortality rates in State prison fell
rapidly from 100 per 100,000 inmates in 1995 to 15 per
100,000 inmates 5 years later. Overall State prisoner mortality rates have grown slightly (6%) since 1980, mostly due
to illness/natural causes (up 40% since 1980).
2 Suicide and Homicide in State Prisons and Local Jails

Year
2002
2001
2000
1995
1990
1985
1980

All
Illness/
causes* natural cause AIDS
246
242
238
308
228
239
233

198
194
190
165
187
163
141

20
23
15
100
----

Suicide

Homicide

14
14
16
16
16
26
34

4
3
5
9
8
24
54

Note: Mortality rates for 1980-2000 are based on death counts of
sentenced prisoners and the December 31 jurisdiction population as
collected in the National Prisoner Statistics (NPS) program. Rates
for 2001-02 are based on counts from the Deaths in Custody Reporting Program and the NPS June 30 custody population count.
*Excludes executions.
-- Not available.

Table 1. State prison jurisdictions: Number of prisoner deaths, suicides, and
homicides, and mortality rates, per 100,000 prisoners in custody, 2001-02

Region and
jurisdiction
U.S. total*

Number of prisoner
deaths, 2001-02
All causes Suicide Homicide

Average annual mortality rate
(2001-02) per 100,000
prisoners held at midyear
All causes

Suicide

Homicide

5,815

337

87

244

14

4

887
60
13
49
11
129
360
248
11
6

46
9
1
3
0
3
21
6
2
1

5
0
0
0
0
0
3
2
0
0

257
162
370
239
224
225
264
327
155
217

13
24
28
15
0
5
15
8
28
36

1
0
0
0
0
0
2
3
0
0

Midwest
Illinois
Indiana
Iowa
Kansas
Michigan
Minnesota
Missouri
Nebraska
North Dakota
Ohio
South Dakota
Wisconsin

1,057
158
97
20
43
227
28
122
15
4
229
15
99

77
20
6
3
4
11
2
6
0
0
8
4
13

11
2
3
0
0
1
0
1
0
0
2
2
0

221
178
246
123
248
231
215
210
190
192
254
262
245

16
22
15
18
23
11
15
11
0
0
9
71
32

2
2
8
0
0
1
0
2
0
0
2
34
0

South
Alabama
Arkansas
Delaware
Florida
Georgia
Kentucky
Louisiana
Maryland
Mississippi
North Carolina
Oklahoma
South Carolina
Tennessee
Texas
Virginia
West Virginia

2,717
172
73
31
365
199
77
150
141
69
128
115
116
112
804
140
25

121
2
8
4
11
10
1
2
13
2
8
2
2
2
49
4
1

40
1
2
0
3
4
1
0
6
0
2
4
3
3
10
1
0

267
342
322
222
251
217
325
381
293
228
197
260
267
317
273
227
357

12
4
36
28
8
11
4
5
27
7
12
5
5
6
17
6
14

4
2
9
0
2
4
4
0
12
0
3
9
7
8
3
2
0

West
Alaska
Arizona
California
Colorado
Hawaii
Idaho
Montana
Nevada
New Mexico
Oregon
Utah
Washington
Wyoming

1,154
22
139
625
94
20
26
11
52
26
57
14
60
8

93
3
6
52
5
2
3
1
3
4
5
4
4
1

31
0
1
21
2
0
0
0
2
2
0
1
2
0

213
263
247
196
268
195
243
199
260
221
259
170
192
260

17
36
11
16
14
19
28
19
15
34
23
49
13
33

6
0
2
7
6
0
0
0
10
17
0
12
6
0

Northeast
Connecticut
Maine
Massachusetts
New Hampshire
New Jersey
New York
Pennsylvania
Rhode Island
Vermont

Note: All mortality rates are calculated based on custody populations for June 30.
*Excludes 9 total prisoner deaths reported by the District of Columbia in 2001. None of
the 9 deaths was a suicide or homicide. The District of Columbia transferred all prisoner
custody operations to the Federal Bureau of Prisons during 2001.

Nationwide, 337 State prisoners
committed suicide during 2001-02
Suicide and homicide accounted for a
combined 7% of all State prisoner
deaths during 2001-02 (table 1). The
average annual suicide rate of State
prisoners (14 suicides per 100,000
prisoners) was a third of that of local
jail inmates (48).
Prison suicide rates showed wide
variation at the State level. New
Hampshire, Nebraska, and North
Dakota all reported no suicide deaths
during the 2-year period. Another six
States had suicide rates of 5 per
100,000 prisoners or lower. Thirteen
States had suicide rates of at least 25
per 100,000 prisoners, led by South
Dakota (71), Utah (49), Vermont,
Alaska, and Arkansas (each with 36).
In most State prison systems, suicides
were rare events. Only 9 States
reported as many as 10 prisoner
suicides during this period, with 42% of
all suicides taking place in four States.
California (52), Texas (49), New York
(21), and Illinois (20) reported 142 of
the Nation's 337 State prisoner
suicides. About half of all States (24)
recorded 3 or fewer suicides.
87 State prisoners became victims
of homicide over 2 years
Most States did not have any prisoner
homicides in the course of a year.
During 2001, 31 States reported no
prison homicides; 29 States did not
report a homicide during 2002. Three
States reported 43% of all homicides
— California (21), Texas (10), and
Maryland (6). No other State reported
more than 5 homicides during 2001-02.
Homicide rates were low in most
States, and 5 had a rate of at least 10
homicides per 100,000 prisoners, led
by South Dakota (34) and New Mexico
(17). However, even in these 5 States,
a combined total of 13 homicides were
reported over 2 years.

Suicide and Homicide in State Prisons and Local Jails

3

Table 2. The 50 largest jail jurisdictions: Number of inmate deaths and suicides
and mortality rates per 100,000 inmates, 2000-02

Jurisdiction
Total

Number of inmate
deaths, 2000-02
All causes Suicide

Average annual mortality rate, 2000-02
Per 100,000
Per 100,000 inmates —
average daily population inmates — at riska
All causes

Suicide

All causes Suicide

1,037

180

167

29

11

2

Los Angeles, CA
New York City, NY
Cook County, IL
Maricopa County, AZ
Philadelphia City, PA

105
99
48
31
41

12
9
3
10
6

180
224
157
141
198

21
20
10
45
29

19
27
15
8
33

2
3
1
3
5

Dade County, FL
Harris County, TX
Dallas County, TX
Orleans Parish, LA
Broward County, FL

46
52
29
14
29

3
7
7
2
3

231
243
145
77
200

16
32
34
10
21

14
15
9
6
13

1
2
2
1
1

San Bernardino County, CA
San Diego County, CA
Shelby County, TN
Orange County, CA
Santa Clara County, CA

14
23
22
6
14

5
6
0
1
5

92
153
140
42
115

33
39
0
7
40

5
8
11
3
8

2
2
0
1
3

Alameda County, CA
Orange County, FL
Bexar County, TX
Baltimore City, MD
Hillsborough County, FL

29
15
26
39
16

4
1
2
9
4

242
124
245
381
156

34
8
20
88
39

17
8
12
27
8

2
1
1
6
2

Sacramento County, CA
Riverside County, CA
Tarrant County, TX
Milwaukee County, WI
Jacksonville City, FL

20
8
10
7
30

8
4
2
0
3

206
92
92
70
341

81
46
18
0
35

11
5
6
3
20

4
3
1
0
2

Pinellas County, FL
Davidson County, TN
Clark County, NV
Fulton County, GA
King County, WAb

14
24
21
9
3

2
2
8
3
0

174
291
279
105
55

26
25
107
35
0

10
21
8
9
3

1
2
3
3
0

Wayne County, MI
DeKalb County, GA
Palm Beach County, FL
Kern County, CA
Travis County, TXc

17
7
13
8
11

8
0
0
4
2

208
78
176
103
141

97
0
0
51
26

13
6
7
7
7

6
0
0
3
1

Franklin County, OH
Allegheny County, PA
Marion County, IN
Essex County, NJ
Suffolk County, MAd

10
16
16
12
2

4
6
2
1
0

142
208
218
180
29

55
80
27
14
0

7
17
14
16
4

3
6
2
1
0

El Paso County, TX
Fresno County, CA
Oklahoma County, OK
Cobb County, GA
Cuyahoga County, OH

10
14
7
5
7

2
3
3
3
1

154
205
119
77
116

33
44
51
47
17

9
11
5
4
7

2
2
2
3
1

Hamilton County, OH
Hudson County, NJ
San Francisco City/Co., CA
York County, PA
Mecklenburg County, NC

11
11
9
4
3

5
1
4
0
0

182
200
154
73
52

83
17
73
0
0

8
23
6
10
2

4
2
3
0
0

Note: A specified cause of death was not provided for 6 deaths reported in 2000 (5 from New
York City and 1 from Marion County), 11 deaths in 2001 (2 each from Bexar County and
Jacksonville City, 1 each from Orleans Parish, Broward, San Diego, Hillborough, Tarrant, Clark,
and Suffolk counties), and 10 deaths in 2002 (2 from Alameda County, and 1 each from Dade,
Broward, Bexar, Hillsborough, Milwaukee, King, Franklin, and Hamilton counties).
a
The at-risk jail population combines the January 1 count with the number of annual admissions.
b
King County data include only the years 2001-02.
c
Travis County data for 2002 exclude the Travis County Substance Abuse Treatment Facility.
d
Suffolk County data for 2000 exclude the Suffolk County House of Corrections.

4 Suicide and Homicide in State Prisons and Local Jails

Suicide rate in the Nation's 50
largest jail jurisdictions half that
of all other jails
There are over 3,300 local jails
operated by county and municipal jurisdictions nationwide. Jails typically
hold unsentenced offenders, those
sentenced to less than a year, and
offenders sentenced to longer terms
who are awaiting transfer to State
prison. As a result, almost every State
prisoner has been through a period of
jail confinement.
Over a 3-year period (2000-02), the
Nation's 50 largest jail jurisdictions
reported a total of 1,037 deaths from all
causes (table 2). This death count
represented a higher overall mortality
rate (167 per 100,000 inmates in the
average daily population) than other
jails (140 per 100,000).
Mortality rates varied widely among the
top 50 jurisdictions. Twelve of these 50
jurisdictions had overall mortality rates
of fewer than 100 deaths per 100,000
inmates, led by Suffolk County, Massachusetts (29), Orange County, California (42), and Mecklenburg County,
North Carolina (52). Another 16 of the
top 50 jurisdictions had rates of 200 or
more deaths per 100,000 inmates, led
by Baltimore City, Maryland (381),
Jacksonville City, Florida (341), and
Davidson County, Tennessee (291).
The 50 largest jail jurisdictions collectively had a comparatively low prevalence of suicide. Inmate suicides
accounted for 17% of all deaths in
these 50 largest jurisdictions but were
the cause of 41% of the deaths in all
other jails. The suicide rate of the 50
largest jurisdictions (29 per 100,000)
was half that of all other jails (57).
Eight of the top 50 jurisdictions
reported no suicides during 2000-02,
and another 4 jurisdictions had a
suicide rate of 10 per 100,000 or less.
Ten of these jurisdictions also had
suicide rates of at least 50 per 100,000
inmates, led by Clark County, Nevada
(107), Wayne County, Michigan (97),
and Baltimore City, Maryland (88).

During 2002 the Nation's smallest
jails had a suicide rate 5 times
that of the largest jails
On an average day in 2002, over 40%
of the nation's jails housed fewer than
50 inmates, while 2% of all jails held at
least 1,500 inmates. Rates of inmate
suicide were closely related to jail size,
with the smallest facilities recording the
highest suicide rates.
Number of
inmates in jail
Total
Fewer than 50
50-99
100-149
150-249
250-499
500-999
1,000-1,499
1,500-1,999
2,000 or more

Local jail mortality rate,
per 100,000 inmates, 2002
All causes
Suicide
147

47

313
159
120
107
124
102
133
150
173

177
77
50
48
53
33
43
32
32

Note: Mortality rates are based on average daily
population (ADP) during the calendar year; table
excludes 47 jail facilities, which did not report
valid ADP data.

The Nation's largest jail facilities
recorded the lowest suicide rates (32
per 100,000 inmates). The suicide rate
rose steadily as jail size decreased and
was over 5 times higher (177 per
100,000) in jails holding fewer than 50
inmates. However, given their small
populations, these jails accounted for
14% of all jail suicides.

While the 50 jurisdictions had an
average daily population of 207,471
over the 3-year period, these same
jails had an average of 2,827,133
admissions each year. As a result, the
at-risk mortality rates of these jurisdictions are far lower. The ADP rate of
overall mortality in the top 50 jurisdictions (167 per 100,000) was 15 times
the at-risk rate (11). The ADP-based
suicide rate for these 50 jurisdictions
(29 per 100,000) was 14 times the
at-risk suicide rate for these facilities
(2 per 100,000).

The most common cause of death
among jail inmates was illness (48%
of all jail deaths during 2000-02). As a
result, the overall mortality rates of jail
inmates steadily rose with age. Among
jail inmates age 18-24, the mortality
rate was 60 per 100,000; this rate was
3 times higher for inmates age 35-44
(179), and over 11 times higher for
inmates age 55 or older (694). The only
exception to this pattern was the death
rate of jail inmates under age 18 (138
per 100,000), who made up less than
2% of all jail deaths.

Males and white inmates had the
highest rates of suicide in jails

Jail suicide rates also increased with
inmate age. Inmates age 18-24 were
the least likely to commit suicide (38
suicides per 100,000 inmates); this rate
increased 24% for inmates age 25-34
(47), and 39% for inmates age 35-44
(53). The oldest inmates, age 55 or
older, had the highest rate of suicide
(58 per 100,000) among adult inmates.

Among local jail inmates, mortality
rates varied across demographic
subgroups (table 3). In terms of deaths
from all causes, male inmates had a
higher death rate (150 per 100,000
inmates) than females (130). Gender
was a stronger factor in suicide rates:
males (50 per 100,000) were 56%
more likely to commit suicide than
female jail inmates (32). The homicide
rate of male jail inmates was low (3 per
100,000) and female inmates did not
experience a single homicide during
2000-02.

Table 3. Local jail and State prison inmate mortality rates,
per 100,000 inmates, by selected characteristics

Jail suicide rates drop by over 90%
when based on "at-risk" population
Characteristic

BJS has usually based jail mortality
rates on the average daily population
of inmates (an ADP of under 700,000).
A more sensitive measure of jail
mortality would reflect the far larger
number of persons admitted into these
facilities over the entire year (nearly 13
million). All of these persons admitted
are at risk of dying while held in jail.
Past attempts to collect admission data
for a whole year were unsuccessful,
because many jail information systems
do not keep cumulative counts of
admissions. As part of the new Deaths
in Custody records, BJS collected
annual admission data, which can be
used to calculate an at-risk measure of
mortality for the Nation's largest jails.

The youngest jail inmates were the
exception to this pattern; jail inmates
under 18 had the highest suicide rate in
local jails (101 per 100,000). Given
their relatively small numbers, inmates
under the age of 18 committed 35 of
the 918 jail suicides recorded nationwide over 3 years.

Average annual mortality rate, per 100,000 inmates
Local jail inmates, 2000-02
State prison inmates, 2001-02
All causes
Suicide
Homicide
All causes
Suicide
Homicide
148

48

3

244

14

4

Gender
Male
Female

150
130

50
32

3
0

251
140

14
10

4
0

Age
Under 18
18-24
25-34
35-44
45-54
55 or older

138
60
99
179
349
694

101
38
47
53
52
58

0
3
2
4
7
0

52
34
63
182
571
2,019

52
14
14
14
13
13

0
3
3
4
3
4

Race/Hispanic origin
White, non-Hispanic
Black, non-Hispanic
Hispanic

219
118
98

96
16
30

3
3
3

327
207
243

22
8
18

5
2
7

All inmates

Note: Jail inmate mortality rates are per 100,000 inmates held, based on average daily
population (ADP). Inmate populations of various demographic subgroups are estimates
based on the Annual Survey of Jails and the 2002 Survey of Inmates in Local Jails. State
prison rates are per 100,000 inmates held in custody on June 30. Prisoner demographic
subgroups are estimates based on the June 30 National Prisoner Statistics custody counts
and demographic data from the National Corrections Reporting Program.

Suicide and Homicide in State Prisons and Local Jails

5

Inmate age did not have any clear
relationship to jail homicide rates,
which were no higher than 7 per
100,000 inmates for all age groups.
Both the youngest (under 18) and
oldest (55 or older) inmates had no
homicide deaths during 2000-02.

In contrast, male and female suicide
rates in State prisons were similar (14
suicides per 100,000 males, compared
to 10 per 100,000 females). In local
jails men were over 50% more likely
than women to commit suicide.

The increase in mortality rates seen in
older jail inmates was also evident
among older State prisoners. The
overall death rate was lowest for State
prisoners age 18-24 (34 per 100,000).
The death rate was over 5 times higher
for State prisoners age 35-44 (182) and
Mortality rates displayed substantial
differences by race and ethnicity. Death nearly 17 times higher for prisoners
age 45-54 (571). The mortality rate of
rates from all causes for both
the oldest prisoners, age 55 or older,
black (118 per 100,000 inmates) and
Hispanic (98) jail inmates were at least was highest (2,019 – or 59 times
higher than the rate for prisoners age
20% below the overall jail inmate
mortality rate (148). But the death rate 18-24).
of white jail inmates (219 per 100,000)
Deaths attributed to "illness/natural
was 86% higher than that of black
cause" made up 80% of all State
inmates and over twice as high as the
prison deaths reported during 2001-02.
rate for Hispanic inmates.
Two-thirds of all State prison deaths
involved inmates age 45 or older,
Differences across racial/ethnic
though such inmates represented 17%
categories were more pronounced in
of all State prisoners held during
jail inmate suicide rates. The suicide
2001-02.
rate of white jail inmates (96 per
100,000 inmates) was more than triple
Number of inmate deaths
that of Hispanic inmates (30) and
Local jails,
State prisons,
was 6 times the suicide rate for black
Inmate age
2000-02
2001-02
inmates (16). White inmates accounted
All inmates*
2,834
5,818
for nearly three-quarters of all jail
Under 18
48
3
inmate suicides during 2000-02.
White jail inmates 6 times more
likely to commit suicide than black
inmates and 3 times more likely
than Hispanic inmates

Unlike the overall mortality and suicide
rates, homicide rates were not related
to race/ethnicity. White, black and
Hispanic jail inmates were all equally
likely to be victims of a homicide
(3 deaths per 100,000 inmates).

18-24
25-34
35-44
45-54
55 or older

323
609
896
667
291

149
507
1,323
1,809
2,027

*Excludes 9 jail inmates and 6 State prisoners
whose ages were not reported.

Despite the close relationship between
age and the overall mortality rates in
State prisoners age 45 or older
State prison, inmate age was not
made up 17% of inmates but 66%
related to suicide rates. State prisoner
of deaths
suicide rates ranged from 13 to 14
suicides per 100,000 prisoners for
Just as in local jails, male State prisonevery age group over 18. The suicide
ers had higher overall mortality rates
rate of State prisoners under 18 was 4
than female prisoners. While this differtimes higher (52 per 100,000), but this
ence was modest in local jails (the
age group accounted for less than
male death rate was 15% higher),
0.3% of State prisoners and had 3
males (251 deaths per 100,000 prisonsuicides nationwide over 2 years. By
ers) were 79% more likely than
comparison, 116 prisoners age 25-34
females (140) to die in State prison
committed suicide during 2001-02.
during 2001-02.

6 Suicide and Homicide in State Prisons and Local Jails

Age also showed no relationship to
State prison homicide rates, with all
age groups over age 18 recording a
homicide rate of either 3 or 4 per
100,000 inmates. No reported
homicides involved State prisoners
under age 18 during 2001-02.
Black inmates had the lowest
suicide and homicide rates
in State prisons
As in local jails, white inmates had the
highest overall mortality rate (327
deaths per 100,000 prisoners). While
the mortality rate of white jail inmates
was 86% higher than that of blacks and
123% higher than that of Hispanics, the
differences in State prison were
smaller. White State prisoners were
35% more likely than Hispanic inmates
(243 per 100,000) and 58% more likely
than black prisoners (207) to die during
2001-02.
White inmates had the highest suicide
rate of all State prisoners (22 suicides
per 100,000 inmates). This rate was
22% higher than the Hispanic suicide
rate (18 per 100,000). By comparison,
white inmates in local jails were 3 times
more likely than Hispanics to commit
suicide. Black inmates had the lowest
suicide rate of all State prisoners (8 per
100,000). Blacks were about a third as
likely as whites to commit suicide in
State prison and less than half as likely
as Hispanics.
Homicide rates were less than 10 per
100,000 State prisoners for all
racial/ethnic groups during 2001-02.
Hispanic inmates were the most likely
to be killed in State prisons (7 homicides per 100,000 inmates), which was
over 3 times the homicide rate of black
inmates (2 per 100,000). The homicide
rate for white inmates (5) almost
matched the rate for all State prisoners
(4).

Violent offenders committed suicide
at nearly triple the rate of nonviolent
offenders in jails
The death rate of violent offenders in
local jails (212 per 100,000) was 75%
higher than that of nonviolent offenders
(121), but this difference was larger in
cases of suicide (table 4).
The suicide rate of violent jail inmates
(92 per 100,000) was nearly triple that
of nonviolent offenders (31). Kidnaping
offenders had the highest suicide rate
(275), followed by those inmates held
for rape (252) or homicide (182).

Current offense

Average annual mortality
rate, per 100,000 local
jail inmates, 2000-02
All causes Suicide Homicide

Violent
Nonviolent*

212
121

92
31

5
2

*Excludes offenders with “other/unspecified”
current offenses.

Among all nonviolent offenders, only
probation/parole violators had a suicide
rate of at least 100 per 100,000 (118).
Drug offenders were found to have the
lowest rates of mortality, particularly
suicide. Drug offenders were the only
group that had fewer than 100 deaths

Table 4. Average annual jail inmate mortality rates,
by most serious current offense, 2000-02

Current offense

Number of local jail
inmate deaths, 2000-02
All causes Suicide Homicide

Average annual mortality rate, per
100,000 local jail inmates, 2000-02
All causes Suicide Homicide

All offenses

2,843

918

59

148

48

3

Violent offenses
Homicidea
Kidnaping
Rape
Other sexual assault
Robbery
Assault

1,026
162
54
56
122
130
377

447
87
37
29
51
48
144

24
3
2
1
0
3
14

212
338
401
489
227
121
168

92
182
275
252
95
44
64

5
6
15
9
0
3
6

Property offenses
Burglary
Larceny/theft
Arson
Fraud

530
139
148
12
91

164
58
36
4
28

16
4
4
0
3

113
108
110
208
97

35
45
27
70
30

3
3
3
0
3

Drug offenses
Possession
Trafficking

434
197
184

85
43
34

7
3
4

92
95
79

18
21
15

1
1
2

Public-order offenses
Weapons
Obstruction of justice
Traffic
Driving while intoxicatedb
Drunkenness/moralsc
Violation of parole/
probationd

765
35
144
86
113
92

200
13
40
23
22
23

12
1
4
1
1
1

160
91
192
121
92
282

42
34
54
32
18
71

3
3
5
1
1
3

249

66

4

448

118

7

from all causes per 100,000 jail
inmates (92). The suicide rate of drug
offenders (18 per 100,000) was the
lowest among offender groups. Violent
offenders (92) were 5 times more likely
to commit suicide than drug offenders,
and public-order offenders were more
than twice as likely to commit suicide
(42).
Local jails had an average of fewer
than 20 inmate homicides each year
Over 3 years (2000-02), there were 59
jail inmate homicides reported nationwide, resulting in a rate of 3 jail inmate
homicide deaths per 100,000 inmates.
Violent offenders were the most likely
to be killed in local jail (5 homicides per
100,000 inmates), followed by property
and public-order offenders (3 for both).
Drug offenders (1 per 100,000) had the
lowest homicide victimization rate of all
offenders.
Kidnaping offenders had the highest
rate of jail inmate homicide (15 per
100,000 inmates — 5 times the rate for
all inmates), followed by inmates held
for rape (9) and violation of parole/
probation (7). But even among these
offenders with the highest homicide
rates, a combined total of eight
homicides took place nationwide
over this 3-year period.

c
Includes drunkenness, vagrancy, disorderly
Note: All mortality rates were calculated using
average daily population counts from the Annual conduct, unlawful assembly, morals, and
commercialized vice.
Survey of Jails and offense distribution
d
Includes parole or probation violations,
estimates from the Survey of Inmates in Local
escape, AWOL, and flight to avoid prosecution.
Jails, 2002.
a
Includes murder and manslaughter.
b
Includes driving while intoxicated and driving
under the influence of drugs or alcohol.

Suicide and Homicide in State Prisons and Local Jails

7

Drug offenders had the lowest
suicide and homicide rates of all
State prisoners
State prison mortality rates showed
similar patterns by offense type (table
5). Violent offenders not only had the
highest overall mortality rate (312
deaths per 100,000 prisoners), they
were the only State prisoners with a
death rate of at least 200 per 100,000
prisoners held. Property and publicorder offenders each had a rate of 184
deaths per 100,000, followed by drug
offenders (166).

Kidnapers had the highest suicide rate
(36 per 100,000 prisoners), followed by
offenders held for homicide (29),
sexual assault (23), and assault (20).
Among nonviolent offenders,
probation/parole violators had the
highest suicide rates (18 per 100,000),
followed by offenders held for arson
(16), burglary (14), and obstruction of
justice (14). Drug offenders recorded
the lowest suicide rates of all State
prisoners (6 per 100,000 inmates).

The rate of homicide in State prison
was 4 per 100,000 prisoners, and
varied little across offense types.
Three types of offenders had as many
Compared to violent offenders in local
jails (92 suicides per 100,000 inmates), as 10 homicides per 100,000 prisoners — arsonists (16), kidnapers (15),
the suicide rate of violent offenders in
and probation/parole violators (12).
State prison (19 per 100,000) was
Among these three categories with the
much lower. But among State prisonhighest homicide rates, the number of
ers, violent offenders were more than
homicides was small, with a total of
twice as likely to commit suicide as
nine prisoners killed over 2 years.
nonviolent offenders (9 per 100,000).
Table 5. Average annual State prison inmate mortality rates,
by most serious current offense, 2001-02

Current offense

Number of State prison
inmate deaths, 2001-02
All causes Suicide Homicide

Average annual mortality rate, per
100,000 State prison inmates, 2001-02
All causes
Suicide
Homicide

5,824

337

87

244

14

4

3,691
1,295
151
344
803
552
485

229
89
5
14
36
28
44

53
16
5
1
8
11
11

312
417
454
299
523
171
217

19
29
36
12
23
9
20

4
5
15
1
5
3
5

Property offenses
Burglary
Larceny/theft
Arson
Fraud

904
447
199
35
128

58
36
10
2
6

18
9
4
2
0

184
177
209
277
209

12
14
10
16
10

4
4
4
16
0

Drug offenses
Possession
Trafficking

853
278
485

33
10
21

11
5
6

166
224
188

6
8
8

2
4
2

Public-order offenses
Weapons
Obstruction of justice
Driving while
intoxicatedb
Violation of parole/
probationc

319
36
53

13
2
2

4
1
1

184
67
381

7
4
14

2
2
7

123

2

0

263

4

0

32

3

2

194

18

12

All offenses
Violent offenses
Homicidea
Kidnaping
Rape
Other sexual assault
Robbery
Assault

Note: All mortality rates were calculated using June 30
custody prisoner counts from the National Prisoner
Statistics program and 2002 offense distribution
estimates from the National Corrections Reporting
Program.
a
Includes murder and manslaughter.

b

Includes driving while intoxicated and
driving under the influence of drugs or
alcohol.
c
Includes parole or probation violations,
escape, AWOL, and flight to avoid
prosecution.

8 Suicide and Homicide in State Prisons and Local Jails

State prisoners convicted of fraud and
driving while intoxicated had the lowest
rate of homicide, with zero homicides
reported for 2001-02.
Nearly half of jail suicides occurred
in the first week of custody
Jail inmate suicides were heavily
concentrated in the first week spent in
custody. Forty-eight percent of all jail
suicides during 2000-02 took place
during the inmate's first week following
admission. In particular, almost a
quarter of all jail suicides took place
either on the date of admission to jail
(14%) or the following day (9%).
Time served
after admission
Same day
Next day
2-7 days
8-14 days
15-30 days
31-60 days
61-180 days
181 days or more

Percent of jail inmate
suicides, 2000-02
13.7%
9.0
24.9
9.6
7.7
10.6
14.0
10.4

The frequency of jail suicides slowed
after the initial week, with the second
week of custody accounting for 10% of
jail suicides. The next 2 weeks in
custody (days 15 to 30) accounted for
even fewer suicides (8%). Despite this
early concentration of suicides, more
suicides took place after the 60th day
in jail (24%) than during the first 2 days
(23%).
The median time served in jail prior to
committing suicide was just over 1
week (9 days), but this period of time
varied across demographic and criminal offense categories (table 6).
Females spent less than half as much
time as males in jail prior to committing
suicide (median time served: 4 days for
females and 10 days for males). The
median length of time served by
Hispanic inmates prior to suicide (23
days) was over twice as long as the
time for white inmates (9 days) and
nearly 4 times longer than that for black
inmates (6 days).

7% of State prison suicides took
place during the first month

The median time served in State prison
prior to a suicide (30 months) was over
100 times longer than in local jails (9
days). Male (30 months) and female
(29 months) State prisoners spent
almost identical amounts of time in
prison before committing suicide.
However, race was related to the
length of time served prior to suicide.
Half of all suicides by white inmates
occurred in the first 21 months of
custody, while the corresponding
figures for black (40 months) and
Hispanic inmates (49 months) were
twice as long.

In State prison, suicides were less
concentrated around admission. Sixtyfive percent of jail suicides occurred in
the first 30 days, but 7% of prison
suicides took place during the first
month. Most State prison suicides
(65%) took place after the inmate's first
year of confinement, and 33% took
place after the inmate had served
at least 5 years in prison.

Violent State prisoners spent more
time in custody prior to suicide than
other offenders (median time served
was 45 months). Drug offenders were
the only other offender group who
served a median of at least a year in
State prison prior to their suicides (18
months), followed by property (10
months) and public-order offenders (9
months).

Time served
since admission

At least 80% of suicides in prison
and jail occurred in the inmate's
cell; time of day not a factor

Of all offender groups, public-order
offenders spent the shortest time in
custody prior to committing suicide; half
of their suicides took place in the first 3
days of custody. Property and drug
offenders each had a median time
served of about a week (7 and 8 days,
respectively) prior to suicide. Violent
offenders spent the longest time in
custody prior to suicide; half of their
suicides took place after spending
3 weeks in jail (20 days).

Percent of State prisoner
suicides, 2001-02

Less than 1 month
1-5 months
6-11 months
12-23 months
24-59 months
60-119 months
120 months or more

7.4%
14.9
12.5
11.0
21.4
18.5
14.3

The vast majority of both local jail
(80%) and State prison (87%) inmate
suicides took place within the inmate's
cell or room (table 7). Temporary

Table 6. Time served since admission by jail inmates
and State prisoners committing suicide, by selected
characteristics

Characteristic
All inmates

Median time served since admission*
Local jail inmate
State prisoner
suicides, 2000-02
suicides, 2001-02
9 days

30 months

Gender
Male
Female

10 days
4

30 months
29

Race/Hispanic origin
White, non-Hispanic
Black, non-Hispanic
Hispanic

9 days
6
23

21 months
40
49

Current offense
Violent
Property
Drug
Public-order

20 days
7
8
3

45 months
10
18
9

*The median time served is that length of time at which half of the
inmates spent less time in custody, and the other half spent more.

holding areas (lockups) were the next
most common location of suicide
events (10% in jails, 4% in prisons).
Common areas such as cafeterias,
libraries, and recreational areas were
the scene of very few suicides (6% in
jails, 3% in State prisons), as were
areas outside of the correctional facility
(2% of jail suicides, 3% percent of
prison suicides).
Suicide events in both local jails and
State prisons showed little relationship
to the time of day. Aside from morning
hours (20% of jail suicides), the
frequency of suicides in other parts of
the day varied from 24% (during afternoon hours) to 28% (evening and
overnight hours). Similar data were
reported for suicides in State prisons.
Twenty percent of State prisoner
suicides took place in the morning, with
all other times of day varying from 25%
(evening and overnight hours) to 30%
(afternoon hours).
In both local jails (94%) and State
prisons (89%), the majority of suicide
events were followed up by the
performance of an autopsy or postmortem examination by a medical
examiner or county coroner.

Table 7. Time of day and location of suicide events
in local jails and State prisons
Percent of inmate suicides
Local jail inmates, State prisoners,
2000-02
2001-02
Time of day
Overnight (midnight-6 a.m.)
Morning (6 a.m.-noon)
Afternoon (noon-6 p.m.)
Evening (6 p.m.-midnight)

28.0%
19.5
24.1
28.4

24.7%
19.9
30.4
25.0

Location of suicide event
Inmate’s cell/room
Temporary holding area
Common areaa
Outside of the facilityb
Elsewhere

80.8%
9.6
6.1
2.3
1.1

86.6%
4.0
3.0
3.0
3.4

918

337

Number of suicidesc
a

Includes cafeteria, exercise yard, library, day room, recreational
area, and workshops.
b
Includes inmates on work details or work release, under community
supervision by the jail/prison, or in transit to/from the facility.
c
Time of day was not reported for 12 jail and 41 prison suicides;
location was not reported for 6 jail and 39 prison suicides.

Suicide and Homicide in State Prisons and Local Jails

9

Most jail homicides occurred at
least 2 weeks after admission
During 2000-02 the number of
homicides in the more than 3,000 jail
jurisdictions nationwide had an average
of fewer than 20 each year. In State
prisons, which held nearly 1.2 million
inmates nationwide, there were fewer
than 50 homicides each year during
2001-02.
These homicide counts resulted in a
rate of less than 5 homicides per
100,000 inmates in both State prison
(4 per 100,000) and local jail (3 per
100,000 inmates, based on ADP). In
the 50 largest jails nationwide, the
at-risk rate of homicide averaged 0.4
per 100,000 inmates held during the
year.
Time served
after admission
Same day
Next day
2-7 days
8-14 days
15-30 days
31-60 days
61-180 days
181 days or more

Percent of jail inmate
homicides, 2000-02

Two-thirds of homicide victims
in State prison had served at least
2 years in prison; nearly 40% had
served 5 years or more
The initial months following admission
to prison accounted for a small percentage of State prisoner homicides
(table 8). One percent of prison
homicides took place during the
victim's first month in prison, and less
than a tenth of homicide victims had
served fewer than 6 months (8%). A
fifth of homicides involved State prisoners who had served less than a year.
Among the 5,824 total prisoner deaths
reported nationwide during 2001-02,
fewer than 20 were homicides of a firstyear inmate. Sixty-seven percent of
State prison homicide victims had
spent at least 2 years in prison, while
37% had served at least 5 years.

5.3%
7.0
17.5
15.8
10.5
14.0
14.0
15.8

as much time as white (46 months) or
black (55 months) prisoners.
Public-order offenders were the most
likely to be killed early in their prison
terms, with a median time served of
just under 2 years (23 months). The
median term served by both drug (40
months) and property (45 months)
offenders was about twice as high.
Violent offenders had the longest
amount of time served in prison prior
to being killed, with a median term of
almost 5 years (55 months).

Characteristic
All inmates
Race/Hispanic
origin
White, non-Hispanic
Black, non-Hispanic
Hispanic
Current offense
Violent
Property
Drug
Public-order

Median time served after
admission: State prisoner
homicides, 2001-02
44 months

46 months
55
22
55 months

45
The median time served in State prison
40
by homicide victims was 44 months.
23
Hispanic homicide victims (with a
median time served of 22 months)
Prison suicides took place almost
were killed after serving less than half
exclusively inside the deceased's cell
or room (87%); no other location
accounted for even 5% of suicide
Table 8. Time served, time of day,
Unlike suicides, homicides in local jails
events. However, over a quarter of all
and location of homicide events in
were not concentrated in the first few
State prisons, 2001-02
prison homicides (29%) took place in
days following admission. Twelve
common areas within prisons, such as
Percent of
percent occurred in the first 2 days in
State prison
cafeterias, libraries, workshops, and
homicides,
custody, but 54% took place after the
recreational yards. A small percentage
2001-02
inmate had served at least 2 weeks in
of homicide events took place in either
Time served after admission
jail. The median length of time served
a temporary holding area or a location
Less than 1 month
1.1%
prior to a homicide death (29 days) was
outside of the prison facility (3% for
1-5 months
6.9
triple that of suicide deaths in local jails
6-11 months
11.5
each). Prisoners' cells or rooms (61%)
12-23 months
13.8
(9 days).
were the most likely scene of a
24-59 months
29.9
homicide in State prison.
60-119 months
24.1
120 months or more

12.6

Time of day
Overnight (midnight-6 a.m.)
Morning (6 a.m.-noon)
Afternoon (noon-6 p.m.)
Evening (6 p.m.-midnight)

11.4%
38.6
28.6
21.4

Location of homicide event
Inmate’s cell/room
Temporary holding area
Common areaa
Outside of the facilityb
Elsewhere

60.5%
2.6
28.9
2.6
5.3

a
Includes cafeteria, exercise yard, library, day
room, recreational area, and workshops.
b
Includes inmates on work details or at work
release sites, under community supervision
by the prison, or in transit.

10 Suicide and Homicide in State Prisons and Local Jails

State prison homicides were over 3
times more likely to occur during the
morning (39% of homicides) than
between midnight and 6 a.m. (11%).
Nearly all State prison homicides (92%)
resulted in an autopsy or post-mortem
exam of the deceased. All but 8 of 87
prisoner homicides during the 2-year
period were committed by other
inmates (91%). Of those "other
homicide" events, most involved
escape attempts or cases in which
assailant identity was not established.

Homicide rate of U.S. residents,
when standardized, 10 times the
rate of jail inmates in 2002
According to rates compiled by the
Centers for Disease Control and
Prevention (CDC), the U.S. resident
population experienced 6 homicides
and 11 suicides per 100,000 residents
(table 9). The homicide rates for both
State prisoners (4) and jail inmates (3)
were lower than that for the U.S.
population. Suicide rates for both State
prisoners (14) and jail inmates (47)
were higher than the rate for the
resident population. However, reliable
comparisons of such rates require
closer analysis.
The demographic compositions of
inmate populations do not reflect those
of the U.S. resident population. In 2002
the U.S. population was 51% female,
81% white, and 22% age 55 or older;
by comparison, the State prison
population was 6% female, 50% white,
and 4% age 55 or older.
The suicide and homicide rates of
these demographic subgroups vary
substantially. For example, the
homicide rate of black males age 18-24
in the resident population (108 per
100,000) was over 8 times that
for white males of the same age (13).
As a result, the differing rates of death
seen in the general population and
correctional facilities reflect differences
in demographic makeup as much as
differences in the relative safety of
these environments.
To improve the comparison of mortality
risks, the resident population rates can
be standardized by age, race, and
gender to match the proportions seen
in prisons and jails. The resulting rates
estimate what the resident population
mortality rates would be if the U.S.
resident population had the same
demographic composition as prisons
and jails.
Standardized to match the State prison
population, the resident population
had a homicide rate (35 per 100,000)
nearly 9 times the rate of homicide in

Table 9. Mortality rates of U.S. resident population and State prison and
local jail inmate populations, per 100,000 residents, 2002

Cause
of death

Deaths per 100,000 residents, 2002
State prisons
Local jails
Local jail
U.S. resident
Standardized
State
Standardized
population rate U.S. resident rate prisoner ratea U.S. resident rate inmate rateb

Suicide
Homicide

11
6

18
35

14
4

17
32

47
3

Note: U.S. resident population mortality rates are taken from the Centers for Disease Control and
Prevention’s injury mortality reports <http://webappa.cdc.gov/sasweb/ncipc/mortrate.html>. BJS
standardized those rates by age, race, and gender to match the characteristics of the State
prison and local jail inmate populations.
a
State prisoner rates of suicide and homicide are based on June 30 custody population.
b
Local jail inmate rates of suicide and homicide are based on average daily population (ADP).

State prisons (4). Standardizing to
match local jail demographics yields a
greater difference the resident rate
(32 per 100,000) being nearly 11 times
higher than the rate in jails (3).
State prisoners had a higher rate of
suicide (14 per 100,000) than the
overall resident population (11). Once
standardized to match the State
prisoner population, the U.S. resident
rate of suicide (18) exceeded that of
State prisoners in 2002.
The standardized resident suicide rate
(17 per 100,000) was less than half of
the jail suicide rate based on ADP (47).
However, an at-risk rate of jail suicide
would be a more appropriate comparison, but not all jails reported the
needed admission data. Based on the
at-risk measure of suicide for the top
50 jail jurisdictions, an at-risk jail
suicide rate for all jails would likely be
less than a tenth of the ADP measure.
(See page 5.)

complete an annual summary of death
reports and population counts (to allow
for calculation of death rates).
Jail response rates for all 3 years were
over 99%. In 2000, 3,063 jurisdictions
responded, and 9 refused, for a
response rate of 99.7%. Data for 2001
was submitted by 3,049 jurisdictions,
with 2 refusals, for a response rate of
99.9%. In 2002, data were submitted
by 3,030 jurisdictions and refused by 6,
for a response rate of 99.8%.
Quarterly collection of State prison
inmate death records began in 2001.
These records were collected from
State departments of corrections,
rather than from each prison facility.
For all years, BJS has had 100%
participation from all 50 State prison
systems. Data were also collected from
the District of Columbia for 2001 in
which it still operated a prison system,
prior to transferring sentenced felons to
the custody of the Federal Bureau of
Prisons.

Methodology
BJS phased in data collection activity
under the Death in Custody Reporting
Act of 2000 (PL 106-297), with the first
collection of death records covering
only local jail facilities. The 2000 jail
collection covered the entire calendar
year (the act became law in October of
2000), while subsequent collections
were done on the quarterly basis
required by the act.
BJS requires a quarterly report from all
jails which had an inmate death during
the period. All jails were instructed to

Copies of all questionnaires collected
under the Deaths in Custody series can
be found on the BJS website at
<http://www.ojp.usdoj.gov/bjs/quest.
htm>.

Standardized U.S. resident death rates
Homicide and suicide rates for specific
age, race, and gender groups within
the U.S. population can be queried
from the Centers for Disease Control
and Prevention's online injury mortality
reports <http://webappa.cdc.gov/
sasweb/ncipc/mortrate.html>.

Suicide and Homicide in State Prisons and Local Jails

11

For example, the 2002 suicide rate for
white females, age 35-44, was 7.8
per 100,000. These rates were then
standardized to match the characteristics of State prison and local jail
populations by weighting the rates by
the proportion of all inmates represented by that subgroup. The sum of
all of the weighted subgroup rates
provides the standardized rate for the
resident population.
Population proportions for these
gender, race and age subgroups of
inmates were derived from the
National Corrections Reporting
Program (for State prisoners) and the
2002 Survey of Inmates in Local
Jails (for jail inmates).

Population bases for mortality rates
Annual mortality rates were based on
different population counts:
1. For prisons the custody population
on June 30 of each year

The Bureau of Justice Statistics is
the statistical agency of the U.S.
Department of Justice. Lawrence
A. Greenfeld is director.
Christopher J. Mumola wrote this
report, under the supervision of Allen
J. Beck. Doris J. James, Lauren E.
Glaze, and Rebecca L. Medway
verified the report, and Tom Hester
edited it.

Data collection and processing of
State prison death records were
carried out by Lara Reynolds. Data
collection and processing of local jail
death records were carried out by
Pamela Butler, Margaret Ferguson,
Patricia Torreyson, and Pearl Chase,
under the supervision of Charlene
Sebold, Governments Division,
Census Bureau, U.S. Department of
Commerce.

Christopher J. Mumola, under the
supervision of Allen J. Beck, designed August 2005 NCJ 210036
the survey, developed the questionOffice of Justice Programs
naires, and monitored data collection
Partnerships for Safer Communities
and data processing.
http://www.ojp.usdoj.gov

2. For local jails the average daily
population in each calendar year.
Estimates of the population at risk for
the largest jail jurisdictions combined
the population on January 1 and
admissions during the year.

12 Suicide and Homicide in State Prisons and Local Jails

Obtain the most recent counts of
inmate deaths from Key Facts at
a Glance on the BJS Internet site:
http://www.ojp.usdoj.gov/bjs/
glance/shipj.htm