
Bjs - Probation and Parole 2005 - Released Nov 2006
Download original document:
Document text
Document text
This text is machine-read, and may contain errors. Check the original document to verify accuracy.
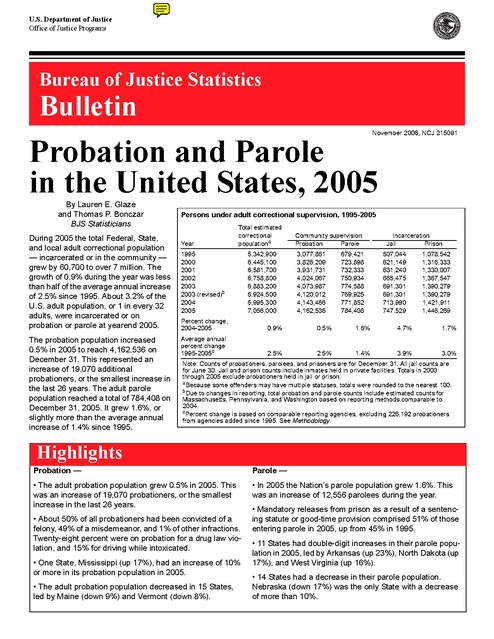
U.S. Department of Justice
Office of Justice Programs

Bureau of Justice Statistics

Bulletin

November 2006, NCJ 215091

Probation and Parole
in the United States, 2005
By Lauren E. Glaze
and Thomas P. Bonczar
BJS Statisticians
During 2005 the total Federal, State,
and local adult correctional population
— incarcerated or in the community —
grew by 60,700 to over 7 million. The
growth of 0.9% during the year was less
than half of the average annual increase
of 2.5% since 1995. About 3.2% of the
U.S. adult population, or 1 in every 32
adults, were incarcerated or on
probation or parole at yearend 2005.
The probation population increased
0.5% in 2005 to reach 4,162,536 on
December 31. This represented an
increase of 19,070 additional
probationers, or the smallest increase in
the last 26 years. The adult parole
population reached a total of 784,408 on
December 31, 2005. It grew 1.6%, or
slightly more than the average annual
increase of 1.4% since 1995.

Persons under adult correctional supervision, 1995-2005

Year

Total estimated
correctional
populationa

1995
2000
2001
2002
2003
2003 (revised)b
2004
2005

5,342,900
6,445,100
6,581,700
6,758,800
6,883,200
6,924,500
6,995,300
7,056,000

Community supervision
Probation
Parole
3,077,861
3,826,209
3,931,731
4,024,067
4,073,987
4,120,012
4,143,466
4,162,536

679,421
723,898
732,333
750,934
774,588
769,925
771,852
784,408

Incarceration
Jail
Prison
507,044
621,149
631,240
665,475
691,301
691,301
713,990
747,529

1,078,542
1,316,333
1,330,007
1,367,547
1,390,279
1,390,279
1,421,911
1,446,269

Percent change,
2004-2005

0.9%

0.5%

1.6%

4.7%

1.7%

Average annual
percent change
1995-2005c

2.5%

2.5%

1.4%

3.9%

3.0%

Note: Counts of probationers, parolees, and prisoners are for December 31. All jail counts are
for June 30. Jail and prison counts include inmates held in private facilities. Totals in 2000
through 2005 exclude probationers held in jail or prison.
aBecause some offenders may have multiple statuses, totals were rounded to the nearest 100.
bDue to changes in reporting, total probation and parole counts include estimated counts for
Massachusetts, Pennsylvania, and Washington based on reporting methods comparable to
2004.
cPercent change is based on comparable reporting agencies, excluding 226,192 probationers
from agencies added since 1995. See Methodology.

Highlights
Probation —

Parole —

• The adult probation population grew 0.5% in 2005. This
was an increase of 19,070 probationers, or the smallest
increase in the last 26 years.

• In 2005 the Nation’s parole population grew 1.6%. This
was an increase of 12,556 parolees during the year.

• About 50% of all probationers had been convicted of a
felony, 49% of a misdemeanor, and 1% of other infractions.
Twenty-eight percent were on probation for a drug law violation, and 15% for driving while intoxicated.
• One State, Mississippi (up 17%), had an increase of 10%
or more in its probation population in 2005.
• The adult probation population decreased in 15 States,
led by Maine (down 9%) and Vermont (down 8%).

• Mandatory releases from prison as a result of a sentencing statute or good-time provision comprised 51% of those
entering parole in 2005, up from 45% in 1995.
• 11 States had double-digit increases in their parole population in 2005, led by Arkansas (up 23%), North Dakota (up
17%), and West Virginia (up 16%).
• 14 States had a decrease in their parole population.
Nebraska (down 17%) was the only State with a decrease
of more than 10%.

Nearly 5 million persons on
probation or parole
The number of adult men and women
in the United States who were being
supervised on probation or parole at
the end of 2005 reached a new high of
4,946,944, up from 3,757,282 on
December 31, 1995. These data were
collected in the 2005 Annual Probation
Survey and the 2005 Annual Parole
Survey, conducted by the Bureau of
Justice Statistics (BJS).
Probationers are criminal offenders
who have been sentenced to a period
of correctional supervision in the
community in lieu of incarceration.
Parole is a period of conditional
supervised release following a prison
term. Prisoners may be released to
parole either by a parole board
decision or by mandatory conditional
release.
In 2005 the growth in the combined
probation and parole populations was
0.6%. An additional 31,626
probationers or parolees were added
during the year.

Community supervision declined as
a percentage of the correctional
population
Between 1990 and 2005 the prison
population was the fastest growing
correctional population, with an
average annual increase of 4.5%,
followed by jails (4.2%), and parole
and probation (2.6% each).
As a percentage of the correctional
population, offenders under community
supervision accounted for 69% of the
correctional population in 2005 (down
from nearly 74% in 1990), while those
incarcerated accounted for 31% (up
from 26% in 1990).
Probationers continued to account for
the majority of all persons under
correctional supervision in 2005 (58%,
down from 61% in 1990). Parolees
were 11% of the total population in
2005 (down from 12% in 1990).
Prisoners increased to 20% of the total
correctional population (up from 17%
in 1990), while jail inmates increased
to 10% (up from 9% in 1990).

Increase in correctional
population, 1990-2005
Number
Percent
2,480,000
100%

Totala
Probation
Parole
Prison
Jail
a

b

1,492,000
253,000
703,000
342,000

Total estimated Supervision rate
per 100,000
correctional
adults*
population

Year
1980
1985
1990
1995
2000
2001
2002
2003
2004
2005

1,842,100
3,013,100
4,350,300
5,342,900
6,445,100
6,581,700
6,758,800
6,924,500
6,995,300
7,056,000

1,117
1,709
2,337
2,737
3,052
3,078
3,122
3,160
3,156
3,150

Number of persons under correctional supervision by type of supervision,
1995-2005
Number of persons
5,000,000

Probation
4,000,000
3,000,000
2,000,000

Prison
Parole

1,000,000

Jail
0
1990

53.5
9.1
25.2
12.3

Details may not sum to total because
some offenders have multiple statuses.
b
Excludes 226,192 probationers from
agencies added since 1995.
See Methodology.

The rate of U.S. adult residents under
correctional supervision nearly tripled
between 1980 (1,117 per 100,000) and
2005 (3,150 per 100,000). During 2005
the U.S. resident population increased
at a higher rate (1.1%) than the
population under correctional
supervision (0.9%). Despite growth in
the total correctional population from
6,995,300 in 2004 to 7,056,000 in
2005, the rate of U.S. men and women
under correctional supervision in 2005
(3,150 per 100,000 adult residents)
remained about the same as in 2004
(3,156).

*Rates are computed using the U.S. adult
resident population on January 1 of the
following year.

Probationers accounted for half the
growth in the correctional
population since 1990
Probationers accounted for more than
half the total growth in the correctional
population since 1990 (figure 1).
Overall, the correctional population
increased by nearly 2.5 million, or
57%, from 1990 to 2005. Probationers
accounted for 53% of the growth (or
1,492,000), followed by prisoners
(25%, or 703,000), jail inmates (12% or
342,000), and parolees (9% or
253,000).

Correctional supervision rate rose
sharply from 1980 to 2005

Figure 1

2 Probation and Parole in the United States, 2005

1993

1996

1999

2002

2005

Table 1. Community corrections among the States, yearend 2005
10 States
with the largest
2005 community
corrections populations

Number
supervised

10 States with the
largest percent
increase

Percent
increase,
2004-05

10 States
with the highest
rates of supervision, 2005

Probation:
Texas
California
Florida
Ohio
Michigan
Pennsylvania
Massachusetts
Illinois
New Jersey
Indiana

430,312
388,260
277,831
239,036
178,609
167,561
165,365
143,136
139,091
121,014

Mississippi
West Virginia
Wyoming
Kentucky
Montana
Alabama
North Dakota
New Mexico
Arkansas
Virginia

17.1%
9.6
9.2
8.0
7.8
6.0
5.6
5.5
5.1
4.9

Massachusetts
Rhode Island
Minnesota
Delaware
Ohio
Indiana
Texas
Michigan
Washington
New Jersey

Parole:
California
Texas
Pennsylvania
New York
Illinois
Louisiana
Georgia
Oregon
Michigan
Ohio

111,743
101,916
75,732
53,533
34,576
24,072
22,851
21,499
19,978
19,512

Arkansas
North Dakota
West Virginia
New Mexico
Kentucky
Vermont
Mississippi
Delaware
Colorado
South Dakota

22.7%
16.7
16.4
16.1
15.8
14.9
12.1
11.3
11.0
10.2

Pennsylvania
Arkansas
Oregon
Louisiana
Texas
California
Missouri
South Dakota
Wisconsin
New York

Persons
supervised per
100,000 adult
residents*
3,350
3,091
2,988
2,828
2,745
2,583
2,580
2,350
2,155
2,117
787
782
766
712
611
421
414
414
365
364

10 States with the
lowest rates of
supervision, 2005

Persons
supervised per
100,000 adult
residents*

New Hampshire
West Virginia
Utah
Nevada
Kansas
Maine
Virginia
North Dakota
New York
South Dakota

457
533
578
709
723
776
788
791
810
899

Maine
Florida
Rhode Island
North Carolina
Nebraska
North Dakota
Massachusetts
Virginia
Mississippi
Delaware

3
34
41
47
50
57
73
78
90
92

Note: This table excludes the District of Columbia as a wholly urban jurisdiction, Georgia probation counts which include probation case-based
counts for private agencies, and Idaho probation counts in which estimates for misdemeanors were based on admissions.
*Rates are computed using the estimated adult resident population in each State on January 1, 2006.

6 of the 10 States with largest
probation populations also had
large parole populations
Texas, California, Ohio, Michigan,
Pennsylvania, and Illinois had 6 of the
10 largest probation populations in the
Nation at yearend 2005 (table 1).
These 6 States accounted for more
than a third of all probationers (37%).
The same 6 States were among the 10
States with the largest parole
populations in the Nation. Almost half
of all parolees were supervised within
these 6 States (46%).
Texas and California accounted for
more than 1 million adults supervised
in the community, or about 1 in 5
probationers and parolees. Each State
had at least a half million adults on
probation or parole: Texas with
532,228, and California with 500,003.

Among the other States,
Massachusetts had the largest
percentage of its adult population
under community supervision (3.4% at
yearend 2005), followed by Texas
(3.2%) and Rhode Island (3.1%).
California had the largest parole
population and the second largest
probation population in the Nation. The
percentage of California’s adult
population under community
supervision was 1.9%, or slightly below
the Nation’s percentage of 2.2%.
Eight States reported rates of
community supervision below 1,000
per 100,000 adult residents. New
Hampshire had the lowest rate of
supervision in the community (595
offenders per 100,000 adults).

9 States reported an increase of 5%
or more in their probation
population
In 2005 Mississippi (up 17%) had the
largest increase in probationers,
followed by West Virginia (up 10%),
and Wyoming (up 9%). A total of 32
States reported an increase in their
adult probation population during
2005.
Fifteen States had fewer adults on
probation at the end of 2005 than at
the beginning of the year. Maine (down
9%) led the Nation with the largest
decrease, followed by Vermont (down
8%), and Washington (down 6%).

Number under community
supervision per 100,000
adult residents
New Hampshire
West Virginia
Utah
Maine
North Dakota
Virginia
Nevada
Kansas

595
632
766
779
848
866
926
948

Probation and Parole in the United States, 2005

3

Table 2. Adults on probation, 2005
Region and
jurisdiction

Probation
population,
1/1/2005

2005
Entries

Exits

Probation
population,
12/31/05

Percent
change,
2005

Number on probation
per 100,000 adult
residents, 12/31/05

4,143,466
28,602
4,114,864

2,228,300
12,135
2,216,200

2,209,700
14,402
2,195,300

4,162,536
26,719
4,135,817

0.5%
-6.6%
0.5

1,858
12
1,846

Northeast
Connecticuta
Maine
Massachusettsa
New Hampshire
New Jersey
New York
Pennsylvaniaa,b
Rhode Islanda
Vermonta

702,328
54,067
8,907
163,719
4,285
143,315
124,853
167,366
26,085
9,731

277,800
28,250
4,890
84,343
3,440
45,136
34,644
67,300
5,410
4,341

285,700
26,245
5,677
82,697
3,110
49,360
40,472
67,000
5,882
5,138

694,396
56,072
8,120
165,365
4,615
139,091
119,025
167,561
25,613
8,934

-1.1%
3.7
-8.8
1.0
:
-2.9
-4.7
0.1
-1.8
-8.2

1,658
2,092
776
3,350
457
2,117
810
1,741
3,091
1,820

Midwest
Illinoisa
Indianaa
Iowa
Kansas
Michigana,b
Minnesota
Missouri
Nebraska
North Dakota
Ohioa,b
South Dakota
Wisconsin

958,730
143,871
121,675
22,408
14,439
176,630
113,121
54,848
17,994
3,749
230,758
5,372
53,865

609,500
60,951
98,681
15,829
19,755
130,200
70,752
25,179
15,330
2,808
141,300
3,196
25,505

594,300
61,686
99,342
14,833
19,184
128,300
66,800
26,413
14,856
2,597
133,000
3,260
24,195

973,807
143,136
121,014
23,404
15,010
178,609
117,073
53,614
18,468
3,960
239,036
5,308
55,175

1.6%
-0.5
-0.5
4.4
4.0
1.1
3.5
-2.2
2.6
5.6
3.6
-1.2
2.4

1,950
1,500
2,583
1,018
723
2,350
2,988
1,208
1,387
791
2,745
899
1,298

1,667,198
36,799
28,771
18,725
7,585
278,606
423,547
32,619
38,231
76,676
20,375
111,537
28,404
38,941
47,099
428,836
43,470
6,977

908,800
14,039
8,435
14,643
7,216
240,000
215,500
20,800
13,772
38,282
8,124
62,157
14,600
14,768
24,800
181,333
27,078
3,200

894,600
11,843
6,958
14,906
7,414
240,800
216,200
18,300
13,695
39,365
4,635
62,068
14,100
14,360
22,600
179,857
24,959
2,500

1,681,455
38,995
30,248
18,462
7,387
277,831
422,848
35,230
38,308
75,593
23,864
111,626
28,865
39,349
49,302
430,312
45,589
7,646

0.9%
6.0
5.1
-1.4
-2.6
-0.3
:
8.0
0.2
-1.4
17.1
0.1
1.6
1.0
4.7
0.3
4.9
9.6

2,067
1,121
1,431
2,828
1,696
2,002
:
1,100
1,133
1,793
1096
1,693
1,065
1,212
1,072
2,580
788
533

786,608
5,547
70,532
384,852
57,779
16,113
44,579
7,634
12,645
17,725
43,324
10,267
111,193
4,418

420,100
1,022
39,700
195,343
29,900
6,236
35,717
4,500
6,305
8,500
17,852
5,312
66,900
2,828

420,500
878
39,100
191,935
31,000
5,524
36,584
3,900
6,019
7,500
16,323
5,500
73,800
2,420

786,159
5,680
71,138
388,260
56,623
16,825
43,712
8,233
12,931
18,706
44,853
10,079
104,293
4,826

-0.1%
2.4
0.9
0.9
-2.0
4.4
:
7.8
2.3
5.5
3.5
-1.8
-6.2
9.2

1,546
1,182
1,606
1,462
1,613
1,693
:
1,121
709
1,287
1,597
578
2,155
1,216

U.S. total
Federal
State

South
Alabamaa
Arkansas
Delaware
District of Columbiaa
Floridaa,b
Georgiaa,b,c
Kentucky
Louisiana
Maryland
Mississippi
North Carolina
Oklahomaa,b
South Carolina
Tennesseea,b
Texas
Virginiaa
West Virginiab
West
Alaska
Arizonaa,b
Californiaa
Coloradoa,b
Hawaiid
Idahoa,e
Montanaa,b
Nevada
New Mexicoa,b
Oregon
Utah
Washingtona,b,d
Wyoming

Note: Because of nonresponse or incomplete data, the probation population for some jurisdictions on December 31, 2005,
does not equal the population on January 1, plus entries, minus exits.
: Not calculated.
aSome or all data are estimated.
bData for entries and exits were estimated for nonreporting agencies.
cCounts include private agency cases and may overstate the number under supervision.
d
Due to a change in the State agency’s recordkeeping procedures, data are not comparable to previous reports.
e
Counts include estimates for misdemeanors based on admissions.

4 Probation and Parole in the United States, 2005

19,070 probationers added in 2005
During 2005 the probation population
grew by 19,070. The growth in the
number of probationers (0.5%) was the
smallest growth in probation since the
survey began in 1980.
At yearend 2005 the probation
supervision rate totaled 1,858
probationers per 100,000 adult U.S.
residents — the equivalent of 1 in
every 54 adults (table 2). Two States,
Massachusetts (3,350 per 100,000)
and Rhode Island (3,091 per 100,000),
had more than 3% of their adult
resident population under probation
supervision.
A total of 10 States had fewer than 1%
of their adult resident population under
probation supervision. One State, New
Hampshire (457 per 100,000), had a
rate below 500 probationers per
100,000 adult residents.

Growth in probation since 1990
linked to entries
Since 1990 the probation population
has steadily increased from 2,670,200
to 4,162,536 in 2005 (figure 2).
Although the number of entries
decreased from 1990 (1,637,600) to
1994 (1,397,500), entries exceeded
exits during that period, resulting in an
average annual increase of 3.0% in the
probation population. The number
entering probation has increased each
year since 1994, except for a 2.0%
decrease in 2001 and a 0.5%
decrease in 2004.
From 1995 through 1999 the annual
increase in the probation population
fluctuated between 87,000 and
120,000 additional probationers each
year (figure 3). Beginning in 2001 the
annual increase in the number of
Annual probation population and
entries to probation, 1990-2005

Small growth in probation
population during 2005
Since 2001 the growth in probation has
steadily dropped. The annual change
was 2.8% in 2001, 2.3% in 2002, 1.2%
in 2003, and 0.6% in 2004.
The 0.5% growth in the probation
population during 2005 was the
smallest in the last 26 years.*

Year

Annual increase
Percent
Number
change

2000
2001
2002
2003
2004
2005

46,287
105,522
92,336
49,920
23,454
19,070

*

1.2%
2.8
2.3
1.2
0.6
0.5

Since Probation and Parole in the United
States, 2004, was published, Washington State
revised their 2004 data which resulted in the
2003-04 national percent change increasing
from 0.2% to 0.6%.

Number of probationers
4,000,000
3,000,000

Yearend
2,000,000

Annual entries

1,000,000
0
1990

1995

2000

2005

Figure 2

probationers declined from 105,500 to
92,300 in 2002, to 49,900 in 2003, to
23,400 in 2004. In 2005 the annual
increase reached its lowest since data
collection began in 1980 — an
additional 19,070 probationers.
5 States accounted for nearly a third
of the growth in probation from
1995 to 2005
In absolute numbers the probation
population increased by 858,500
between 1995 and 2005. California
experienced the largest growth
(107,700), followed by Pennsylvania
(60,700), Michigan (37,200), Illinois
(33,600), and Minnesota (33,300).
These five States accounted for 32%
of the growth in probation since 1995.
Between 1995 and 2005 New York had
the largest decrease in the number of
probationers (49,000), followed by
Washington (16,200), and the Federal
system (8,700).
Largest increases, 1995-2005
California
Pennsylvania
Michigan
Illinois
Minnesota

107,700
60,700
37,200
33,600
33,300

Largest decreases, 1995-2005
New York
Washington
Federal system
District of Columbia
Kansas

-49,000
-16,200
-8,700
-3,000
-1,500

Annual increase in probation population, 1995-2005
Increase in number of probationers
140,000
120,000
100,000
80,000
60,000
40,000
20,000
0
1995 1996 1997 1998 1999 2000 2001 2002 2003 2004 2005

Figure 3

Probation and Parole in the United States, 2005

5

At yearend 2005 almost 1 in 4 probationers were female;
more than 1 in 2 were white

Table 3. Characteristics of adults on probation, 1995,
2000, and 2005

Nationwide women represented a slightly larger percentage of
the probation population in 2005 than in 1995 (table 3).
Women were 23% of adults on probation in 2005 (956,200), up
from 21% in 1995.

Characteristic

At yearend 2005 more than half of all probationers were white
(2,290,500); almost a third were black (1,239,600); and an
eighth were Hispanic (539,700). Persons of other races
comprised about 2% of probationers (92,600).

Race/Hispanic origin
Whitea
Blacka
Hispanic
American Indian/Alaska Nativea
Asian/Native Hawaiian/other
Pacific Islandera

Direct sentences more common in 2005 than 1995

Status of probation
Direct imposition
Split sentence
Sentence suspended
Imposition suspended
Other

A larger percentage of probationers in 2005 had received a
direct sentence to probation (57%) than in 1995 (48%). A
smaller percentage had a probation sentence combined with
incarceration (10% compared to 15% in 1995). The percentage
of probationers that received a suspended sentence to
incarceration has slowly declined, from 26% in 1995 to 22% in
2005.
Half of all probationers convicted of a felony
Probationers convicted of a felony (50%) accounted for a
larger percentage of the population than probationers
convicted of a misdemeanor (49%). About 1% of probationers
had been convicted of other infractions.
The largest percentage of the probation population was
convicted of a drug law violation (28%), followed by a DWI
(15%) and larceny/theft (12%).
Seven in 10 probationers were under active supervision at
yearend. Probationers under active supervision are required to
regularly report to a probation authority in person, by mail, or
by telephone. The percentage of probationers required to
report regularly declined steadily, from 79% in 1995 to 70% in
2005.
About 1 in 10 persons still on probation had absconded at
yearend 2005. Though still on probation, absconders had
failed to report and could not be located. The percentage of
absconders on probation increased slightly in the last 10 years
(10% in 2005, up from 9% in 1995).
Success rates have remained stable since 1995
Fifty-nine percent of the more than 2.2 million adults
discharged from probation in 2005 had successfully met the
conditions of their supervision. The percentage of probationers
discharged successfully has varied between 62% (1995) and
59% (2005). Probationers discharged from supervision
because of incarceration due to a new offense or rule violation
has varied, from 21% in 1995 to 15% in 2000 to 16% in 2005.
Another 3% of those discharged from probation had
absconded and 13% had their probation revoked without
incarceration.

6 Probation and Parole in the United States, 2005

1995

2000

2005

100%

100%

100%

79%
21

78%
22

77%
23

53%
31
14
1

54%
31
13
1

55%
30
13
1

--

1

1

48%
15
26
6
4

56%
11
25
7
1

57%
10
22
9
2

79%
8
9
2

76%
9
9
3

70%
9
10
2

...
...
2

...
...
3

1
6
2

Type of offense
Felony
Misdemeanor
Other infractions

54%
44
2

52%
46
2

50%
49
1

Most serious offenseb
Sexual assault
Domestic violence
Other assault
Burglary
Larceny/theft
Fraud
Drug law violations
Driving while intoxicated
Minor traffic offenses

...
...
...
...
...
...
...
16
...

...
...
...
...
...
...
24
18
6

3%
6
10
5
12
6
28
15
5

Adults entering probation
Without incarceration
With incarceration
Other types

72%
13
15

79%
16
5

76%
18
6

62%
21
5
13
3
...

60%
15
3
8
4
3

59%
16
4
7
5
3

...
...
1
16

1
11
1
9

1
13
1
7

Total
Gender
Male
Female

Status of supervision
Active
Inactive
Absconder
Supervised out of State
Residential/other
treatment program
Warrant status
Other

Adults leaving probation
Successful completions
Incarceration
With new sentence
With the same sentence
Unknown
Absconderc
Discharge to custody, detainer,
or warrant
Other unsuccessfulc
Death
Other

Note: For every characteristic there were persons of unknown
type. Detail may not sum to total because of rounding.
--Less than 0.5%.
...Not available.
a
Excludes persons of Hispanic origin.
b
Does not include all offenses; therefore, will not add to 100%.
c
In 1995 absconder and other unsuccessful statuses were
reported among other.

Table 4. Adults on parole, 2005

Region
and jurisdiction
U.S. total
Federal
State

Parole
population,
1/1/05
771,852
89,589
682,263

2005
Entries
Exits
516,400 503,800
36,121 34,549
480,300 469,300

Parole
population,
12/31/05

Percent
change,
2005

Number on
parole per
100,000 adult
residents,
12/31/05

784,408
91,211
693,197

1.6%
1.8%
1.6

350
41
309

Northeast
Connecticut
Maine
Massachusetts
New Hampshire
New Jersey
New York
Pennsylvaniaa
Rhode Islandb
Vermontb,c

154,309
2,552
32
3,854
1,212
13,880
54,524
76,989
344
922

70,200
2,813
1
5,062
861
10,818
23,340
26,300
381
657

72,400
2,794
1
5,337
671
10,824
24,331
27,500
389
520

152,120
2,571
32
3,579
1,402
13,874
53,533
75,732
338
1,059

-1.4%
0.7
0.0
-7.1
:
0.0
-1.8
-1.6
-1.7
14.9

363
96
3
73
139
211
364
787
41
216

Midwest
Illinois
Indiana
Iowab
Kansasb
Michigan
Minnesota
Missouri
Nebraska
North Dakota
Ohio
South Dakota
Wisconsin

127,338
34,277
6,627
3,325
4,525
20,924
3,676
17,400
801
246
18,882
2,217
14,438

99,252
35,636
6,446
2,665
4,500
10,429
5,035
13,458
869
728
9,956
1,848
7,682

95,760
35,337
5,778
2,430
4,359
11,375
4,745
12,484
1,003
687
9,326
1,621
6,615

130,830
2.7%
34,576
0.9
7,295 10.1
3,560
7.1
4,666
3.1
19,978
-4.5
3,966
7.9
18,374
5.6
667 -16.7
287 16.7
19,512
3.3
2,444 10.2
15,505
7.4

262
362
156
155
225
263
101
414
50
57
224
414
365

South
Alabama
Arkansas
Delaware
District of Columbiac
Florida
Georgia
Kentucky
Louisiana
Maryland
Mississippi
North Carolina
Oklahomac
South Carolina
Tennesseeb
Texas
Virginia
West Virginia

229,775
7,745
13,476
539
5,253
4,484
23,344
8,255
24,219
14,351
1,758
2,882
4,329
3,237
8,223
102,072
4,392
1,216

104,986 100,733
3,030
3,523
8,130
5,075
361
300
2,112
2,180
6,198
5,897
11,366 11,859
5,727
4,420
13,330 13,477
7,658
7,738
996
784
3,506
3,287
1,488
1,800
1,050
1,132
3,748
3,126
32,701 32,857
2,570
2,463
1,015
815

234,007
7,252
16,531
600
5,288
4,785
22,851
9,562
24,072
14,271
1,970
3,101
4,017
3,155
8,721
101,916
4,499
1,416

1.8%
-6.4
22.7
11.3
0.7
6.7
-2.1
15.8
-0.6
-0.6
12.1
7.6
-7.2
-2.5
6.1
-0.2
2.4
16.4

288
208
782
92
1,214
34
338
298
712
339
90
47
148
97
190
611
78
99

West
Alaskab
Arizona
Californiab
Colorado
Hawaii
Idaho
Montanab
Nevada
New Mexico
Oregon
Utah
Washingtond
Wyoming

170,841
949
5,728
110,262
7,383
2,296
2,370
810
3,610
2,469
20,515
3,246
10,640
563

205,866 200,380
645
621
11,782 11,402
162,329 160,848
6,880
6,067
632
722
1,443
1,331
570
545
2,612
2,257
1,439
1,042
9,037
8,053
2,502
2,471
5,668
4,740
327
281

176,240
973
6,108
111,743
8,196
2,119
2,482
835
3,965
2,866
21,499
3,277
11,568
609

3.2%
2.5
6.6
1.3
11.0
-7.7
4.7
3.1
9.8
16.1
4.8
1.0
8.7
8.2

347
202
138
421
234
213
233
114
217
197
766
188
239
153

Parole population grew by 12,556
during 2005
At the end of 2005 a total of 784,408
adult men and women were on parole
or mandatory conditional release
following a prison term (table 4). The
population grew by 12,556 parolees
during the year, or 1.6%. This was
greater than the average annual
increase of 1.4% since 1995 (table 5).
At yearend 2005, 350 persons were
under parole supervision per 100,000
adult residents, or 1 in every 286
adults in the United States.
Pennsylvania (787 per 100,000),
Arkansas (782), and Oregon (766) had
the highest rates of parole supervision.
Maine, which abolished parole in 1975,
had the lowest rate of supervision (3
per 100,000).
Parole populations increased in 33
States
At total of 33 States and the District of
Columbia had more adults on parole at
the end of 2005 than at the beginning
of the year. Double-digit increases
were reported in 11 States. Arkansas
(up 23%) had the largest increase,
followed by North Dakota (up 17%),
and West Virginia (up 16%).
Table 5. Change in the number of
adults on parole, 1995-2005
Year

Note: Because of nonresponse or incomplete data, the parole population for some jurisdictions on
December 31, 2005, does not equal the population on January 1, plus entries, minus exits.
: Not calculated.
aData for entries and exits were estimated for nonreporting county agencies.
b
Excludes parolees in one of the following categories: absconder, out of State, or inactive.
cAll data were estimated.
d
Due to a change in recordkeeping procedures, data are not comparable to previous reports.

Annual change
Number
Percent

1995
1996
1997
1998
1999
2000
2001
2002
2003
2004
2005

-10,950
312
15,054
1,598
18,072
9,441
8,435
18,601
23,654
1,927
12,556

-1.6%
0.0
2.2
0.2
2.6
1.3
1.2
2.5
3.1
0.2
1.6

Total increase,
1995-2005

104,987

15.4%

Average annual
increase,
1995-2005

10,499

1.4%

Probation and Parole in the United States, 2005

7

A total of 14 States reported a
decrease in their parole population
during 2005. Nebraska (down 17%)
had the only double-digit decrease.
Four States had decreases of 5% or
more: Hawaii (down 8%), Oklahoma
and Massachusetts (both down 7%),
and Alabama (down 6%).
State parole population increasing
after stability during the 1990s
From 1980 to 1992 the State parole
population increased from 196,800 to
618,700, or an average of 10%
annually (figure 4). From 1992 to 1998,
the growth in the population slowed,
increasing a total of 10,500 or the
equivalent of an average annual
increase of nearly 0.3%. In the
following period, 1998 to 2005, the
State parole population added 64,000
parolees, or 1.4% annually.
Growth in State parole linked to
entries
From 1980 to 1990 the number of
entries to State parole supervision
more than tripled, from 113,400 to
349,000. State parole entries
continued to rise during the 1990s (up
an average of 2.4% annually). Parole
discharges also increased during the
period (up an average of 4.6%
annually).
From 2000 to 2005 the number of
State parole entries continued to
exceed the number of exits. Both rose
slowly, 1.7% annually.
Year
2000
2001
2002
2003
2004
2005
Average annual
percent change,
2000-05

State entries
441,600
445,600
436,300
459,100
465,500
480,300

1.7%

Discretionary releases to parole
supervision continued to decline

Annual State parole population and
entries to State parole, 1980-2005

As a percentage of all releases from
State prison, discretionary releases by
a parole board steadily declined from
55% in 1980 to 22% in 2004 (figure 5).
From 1980 to 1995 mandatory parole
releases increased (from 19% to 39%).

Number of parolees
1,000,000

Mandatory releases remained fairly
stable between 1995 and 2004 (39%).
These trends were consistent with the
change in release policy occurring
within many States after 1980,
resulting in a shift away from
discretionary releases in favor of
determinate sentences and mandatory
supervised release. (See Trends in
State Parole, 1990-2000, October
2001, NCJ 184735.)
Releases from State prison due to
expiration of sentence increased from
13% of all releases in 1990 to 21% in
2001. Between 2001 and 2004
expiration of sentence releases
declined to 19%.
From 1990 (5%) through 1999 (6%)
releases to probation remained stable.
Since 2000 releases to probation have
steadily increased from 6% to 10% in
2004.

800,000

Yearend population

600,000
400,000

Annual entries

200,000
0

1980 1985 1990 1995 2000 2005

Figure 4

Other conditional releases have
fluctuated over the years (3% in 1980,
up to 10% in 1990, down to 6% in
2000). Since 2001 (3%) other
conditional releases have steadily
increased, reaching 6% in 2004.
Proportion of females on parole
increased between 1995 and 2005
At yearend 2005 women made up
about 1 in 8 adults on parole (93,000)
(table 6). A greater percentage of
women were on parole at the end of
2005 (12%), compared to 1995 (10%).

Releases from State prison, by method of release, 1980-2004
Percent of releases
60%

State exits
432,200
439,100
420,000
440,500
448,800
469,300

40%

Mandatory parole

20%

Discretionary parole
Expiration of sentence

1.7%

Probation
Other conditional*
0%
1980

1984

1988

1992

1996

2000

2004

Note: Data are from the National Prisoners Statistics (NPS-1) series.
*Other conditional releases include: provisional releases, supervised
work furloughs, releases to home arrest or boot camp programs,
conditional pardons, conditional medical releases, or unspecified releases.
Figure 5

8 Probation and Parole in the United States, 2005

As a percentage of all parolees, blacks
decreased from 45% in 1995 down to
40% in 2005. During this same period,
the percentage of parolees who were
white steadily increased (34% in 1995,
38% in 2000, and 41% in 2005).
Almost 1 in 5 parolees were Hispanic
(141,100). About 2% of parolees were
of other races (12,700).
Table 6. Characteristics of adults on
parole, 1995, 2000, and 2005
Characteristic
Total
Gender
Male
Female
Race/Hispanic origin
Whitea
Blacka
Hispanic
American Indian/
Alaska Nativea
Asian/Native Hawaiian/
other Pacific Islandera

1995 2000 2005
100% 100% 100%
90%
10

88%
12

88%
12

34%
45
21

38%
40
21

41%
40
18

1

1

1

--

--

1

Status of supervision
Active
Inactive
Absconder
Supervised out of State
Other

78%
11
6
4
--

83%
4
7
5
1

83%
4
7
4
1

Sentence length
Less than 1 year
1 year or more

6%
94

3%
97

6%
94

More than 8 in 10 parolees were
under active supervision

Percent of successful exits, by type
of supervision, 1995-2005

Active supervision requires parolees to
regularly report to a parole authority in
person, by mail, or by telephone. This
type of supervision increased as a
percentage of all parolees, from 78% in
1995 to 83% in 2000. In 2005 the
percentage of parolees on active
supervision (83%) remained stable.
Parolees on inactive status, excluded
from regular reporting but still on
parole, decreased as a percentage of
all parolees, from 11% in 1995 to 4% in
2005. Another 7% of all parolees still
on parole in 2005 had absconded, 4%
were supervised out of State, and 1%
were supervised through some other
type of status.
About 4 in 10 parolees served a
sentence for a drug offense
About 94% of all parolees had been
sentenced to 1 year or more in State or
Federal prison at yearend 2005. The
largest percentage of parolees had
been convicted of a drug offense
(37%, down from 40% in 2002).
Type of offense

2002

2005

Type of offense
Violent
Property
Drug
Public order
Other

...
...
...
...
...

...
...
...
...
...

25%
25
37
6
7

Violent
Property
Drug
Public order
Other*

Adults entering parole
Discretionary parole
Mandatory parole
Reinstatement
Other

50%
45
4
2

37%
54
6
2

31%
51
8
10

Note: 2002 was the first year data for type of
offense were collected.
...Not available.
*In 2002 public order offenses were
reported among other offenses.

Adults leaving parole
Successful completion
Returned to incarceration
With new sentence
With revocation pending
Other
Absconderb
Other unsuccessfulb
Transferred
Death

45%
41
12
18
11
...
...
2
1

43%
42
11
30
1
9
2
1
1

45 %
38
12
25
1
11
2
1
1

Since 2002 the percentage of parolees
supervised for property (26%) and
violent (24%) offenses remained
stable. An equal percentage of
parolees were supervised for property
(25%) and violent offenses (25%) at
yearend 2005.

Note: For every characteristic there were persons of unknown type. Detail may not sum to
total because of rounding.
--Less than 0.5%.
...Not available.
a
Excludes persons of Hispanic origin.
bIn 1995 absconder and other unsuccessful
statuses were reported among other.

24%
26
40
...
10

25%
25
37
6
7

Percent of exits
80%

Probationers
60%
40%

Parolees

20%
0%
1995 1997 1999 2001 2003 2005

Figure 6

Rates of success for parolees have
remained stable since 1995
As a percentage of all discharges,
parolees who successfully met the
conditions of their supervision have
remained nearly stable between 1995
and 2005 (45% in both years) (figure
6). During this period the success rates
for parolees were consistently lower
than the success rates for probationers
(62% in 1995 and 59% in 2005).
Since 1995 the total estimated number
of parolees discharged from
supervision increased from 391,300 to
503,800 in 2005. During this time the
number of successful exits increased
from 176,300 to 227,600.
Estimated exits from parole

In 2005, 7% of parolees had been
convicted of other offenses, such as
public order violations or unclassified
offenses, up from 10% in 2002.

Total
Successful
Returned to incarceration
Transferred
Death
Other*

1995

2005

391,300 503,800
176,300 227,600
160,000 191,800
9,800
4,700
4,400
5,200
40,800 74,500

*Includes absconder and other unsuccessful
exits.

In 2005, 191,800 parolees were
discharged from supervision and
returned to incarceration because of a
new offense or rule violation, up from
160,000 in 1995. While the number of
parolees returned to incarceration
increased, the percentage of all exits
resulting in re-incarceration remained
nearly stable (41% in 1995 and 38% in
2005).

Probation and Parole in the United States, 2005

9

Methodology

Probation

Parole

The Annual Probation Survey and
Annual Parole Survey provide a count
of the total number of persons
supervised in the community on
January 1 and December 31, 2005,
and a count of the number entering
and leaving supervision during the
year. These surveys cover all 50
States, the District of Columbia, and
the Federal system. The first annual
report on probation and parole was
released in 1979.

The 2005 Annual Probation Survey
was sent to 466 respondents — 33
central State reporters, the District of
Columbia, the Federal system, and
431 separate State, county, or court
agencies. States with multiple
reporters were Alabama (3), Arizona
(2), Colorado (8), Florida (43), Georgia
(5), Idaho (2), Kentucky (3), Michigan
(127), Missouri (2), Montana (4), New
Mexico (2), Ohio (185), Oklahoma (3),
Pennsylvania (2), Tennessee (3),
Washington (35), and West Virginia
(2).

The 2005 Annual Parole Survey was
sent to 54 respondents, including 50
State central reporters, the District of
Columbia, the Federal system, the
California Youth Authority, and 1
municipal agency in Alabama.

Data for the Federal system are from
the Administrative Office of the U.S.
Courts as provided to the BJS Federal
Justice Statistics Program.
Because many States update their
population counts, the January 1,
2005, numbers may differ from those
previously published for December 31,
2004.

Since 1995 the survey coverage has
been expanded to include 180
additional agencies. At yearend 2005,
226,192 probationers were under the
supervision of these agencies.
This report in portable document
format and in ASCII and its related
statistical data and tables are
available at the BJS World Wide
Web Internet site: <http://
www.ojp.usdoj.gov/bjs/abstract/
ppus05.htm.>.

Office of Justice Programs
Partnerships for Safer Communities
http://www.ojp.usdoj.gov

10 Probation and Parole in the United States, 2005

Federal parole as defined here
includes supervised release, parole,
military parole, special parole, and
mandatory release.
The Bureau of Justice Statistics is
the statistical agency of the U.S.
Department of Justice. Jeffrey L.
Sedgwick is director.
BJS Bulletins present the first
release of findings from permanent
data collection programs.
Lauren E. Glaze and Thomas P.
Bonczar wrote this report, under
the supervision of Allen J. Beck.
Margaret E. Noonan provided
statistical verification. Seri Palla
Irazola conducted the data
collection. The processing of data
was conducted by the authors.
Tina Dorsey and Doris J. James
edited the report. Jayne Robinson
prepared the report for printing.
November 2006, NCJ 215091

Appendix table. Adults on probation and parole, 1990, 1995, 2000, and 2005
Region and
jurisdiction
U.S. total
Federal
State

Adults on probation at yearend —
1990
1995
2000
2005
2,670,234 3,077,861 3,826,209
58,222
35,457
31,669
2,612,012 3,042,404 3,794,540

Adults on parole at yearend —
1990
1995
2000
2005

4,162,536
26,719
4,135,817

531,407
21,693
509,714

679,421
51,461
627,960

723,898
76,069
647,829

784,408
91,211
693,197

Northeast
Connecticut
Maine
Massachusettsa
New Hampshire
New Jersey
New York
Pennsylvaniaa
Rhode Island
Vermont

466,006
46,640
7,549
72,459
3,146
72,341
145,266
97,327
15,366
5,912

538,941
54,507
8,641
43,680
4,347
126,759
168,012
106,823
18,850
7,322

573,280
47,636
7,788
45,233
3,629
130,610
186,955
121,176
20,922
9,331

694,396
56,072
8,120
165,365
4,615
139,091
119,025
167,561
25,613
8,934

128,946
291
/
4,720
522
23,298
42,837
56,657
321
300

175,207
1,233
55
5,256
785
37,867
55,568
73,234
591
618

159,653
1,868
28
3,703
944
11,709
57,858
82,345
331
867

152,120
2,571
32
3,579
1,402
13,874
53,533
75,732
338
1,059

Midwest
Illinois
Indiana
Iowa
Kansas
Michigan
Minnesota
Missouri
Nebraska
North Dakota
Ohiob
South Dakota
Wisconsin

567,839
95,699
68,683
13,895
22,183
133,439
59,323
42,322
14,654
1,731
83,380
3,160
29,370

675,380
109,489
95,267
16,579
16,547
141,436
83,778
41,728
13,895
2,320
103,327
3,745
47,269

896,061
139,029
109,251
21,147
15,992
170,276
115,906
53,299
21,483
2,847
189,375
4,214
53,242

973,807
143,136
121,014
23,404
15,010
178,609
117,073
53,614
18,468
3,960
239,036
5,308
55,175

65,693
17,671
3,778
2,111
5,751
11,901
1,873
9,196
632
116
7,945
620
4,099

86,598
29,541
3,200
2,340
6,094
13,862
2,117
13,001
661
114
7,432
688
7,548

103,331
30,196
4,917
2,763
3,829
15,753
3,072
12,563
476
110
18,248
1,481
9,923

130,830
34,576
7,295
3,560
4,666
19,978
3,966
18,374
667
287
19,512
2,444
15,505

1,042,012 1,248,608 1,573,215
27,686
33,410
40,178
15,983
22,397
28,409
12,223
16,124
20,052
9,742
10,414
10,664
210,781
243,736
296,139
134,840
142,954
321,407
7,482
11,499
19,620
30,191
33,753
35,854
82,898
71,029
81,523
8,221
9,595
15,118
77,829
97,921
105,949
24,411
27,866
30,969
32,287
39,821
44,632
32,719
36,485
40,682
308,357
421,213
441,848
21,303
24,264
33,955
5,059
6,127
6,216

1,681,455
38,995
30,248
18,462
7,387
277,831
422,848
35,230
38,308
75,593
23,864
111,626
28,865
39,349
49,302
430,312
45,589
7,646

215,773
5,970
3,971
1,283
5,346
2,064
22,646
3,183
8,877
11,192
3,478
9,883
3,236
3,543
11,327
109,726
9,048
1,000

240,478
7,793
4,685
1,033
6,340
11,197
19,434
4,257
19,028
15,748
1,510
18,501
2,356
5,545
8,851
103,089
10,188
923

225,955
5,484
8,659
579
5,332
5,982
21,556
4,614
22,860
13,666
1,596
3,352
1,825
4,378
8,093
111,719
5,148
1,112

234,007
7,252
16,531
600
5,288
4,785
22,851
9,562
24,072
14,271
1,970
3,101
4,017
3,155
8,721
101,916
4,499
1,416

786,159
5,680
71,138
388,260
56,623
16,825
43,712
8,233
12,931
18,706
44,853
10,079
104,293
4,826

99,302
568
2,711
67,562
2,396
1,425
243
811
2,850
1,224
8,023
1,561
9,615
313

125,677
459
4,109
91,807
3,024
1,689
619
744
2,863
1,366
15,019
2,700
875
403

158,890
525
3,474
117,647
5,500
2,504
1,409
621
4,056
1,670
17,579
3,231
160
514

176,240
973
6,108
111,743
8,196
2,119
2,482
835
3,965
2,866
21,499
3,277
11,568
609

South
Alabama
Arkansas
Delaware
District of Columbia
Floridab
Georgiac
Kentuckyb
Louisiana
Maryland
Mississippi
North Carolina
Oklahoma
South Carolina
Tennessee
Texas
Virginia
West Virginia
West
Alaska
Arizona
California
Colorado
Hawaii
Idahob,d
Montanab
Nevada
New Mexico
Oregon
Utah
Washingtona,b
Wyoming

536,155
3,599
30,397
305,700
31,111
11,667
4,377
4,052
7,700
6,294
37,631
5,830
84,817
2,980

579,475
3,481
40,614
280,545
42,687
12,957
5,308
4,318
8,634
8,524
39,725
8,562
120,466
3,654

751,984
4,779
59,810
343,145
50,460
15,525
35,103
6,108
12,189
10,461
46,023
9,800
154,466
4,115

/Not reported.

a
Due to a change in recordkeeping procedures, probation and parole counts for 2005 are not comparable to previous
b
Due to expanded coverage, probation counts for 2000 and 2005 are not comparable to previous years.
c
Probation counts for 2000 and 2005 include private agency cases and may overstate the number under supervision.
d

years.

Probation counts for 2000 and 2005 include estimates for misdemeanors based on admissions.

Probation and Parole in the United States, 2005

11

U.S. Department of Justice
Office of Justice Programs
Bureau of Justice Statistics
Washington, DC 20531

Official Business
Penalty for Private Use $300

12 Probation and Parole in the United States, 2005

*NCJ~215091*

PRESORTED STANDARD
POSTAGE & FEES PAID
DOJ/BJS
Permit No. G-91