
Medical Causes of Death Among State Prisoners, DOJ, BJS, 2007
Download original document:
Document text
Document text
This text is machine-read, and may contain errors. Check the original document to verify accuracy.
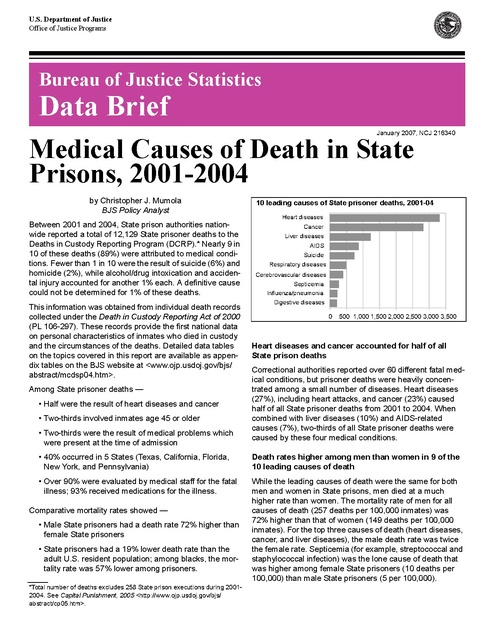
U.S. Department of Justice
Office of Justice Programs

Bureau of Justice Statistics

Data Brief

January 2007, NCJ 216340

Medical Causes of Death in State
Prisons, 2001-2004
by Christopher J. Mumola
BJS Policy Analyst
Between 2001 and 2004, State prison authorities nationwide reported a total of 12,129 State prisoner deaths to the
Deaths in Custody Reporting Program (DCRP).* Nearly 9 in
10 of these deaths (89%) were attributed to medical conditions. Fewer than 1 in 10 were the result of suicide (6%) and
homicide (2%), while alcohol/drug intoxication and accidental injury accounted for another 1% each. A definitive cause
could not be determined for 1% of these deaths.
This information was obtained from individual death records
collected under the Death in Custody Reporting Act of 2000
(PL 106-297). These records provide the first national data
on personal characteristics of inmates who died in custody
and the circumstances of the deaths. Detailed data tables
on the topics covered in this report are available as appendix tables on the BJS website at <www.ojp.usdoj.gov/bjs/
abstract/mcdsp04.htm>.
Among State prisoner deaths —
• Half were the result of heart diseases and cancer
• Two-thirds involved inmates age 45 or older
• Two-thirds were the result of medical problems which
were present at the time of admission

10 leading causes of State prisoner deaths, 2001-04
Heart diseases
Cancer
Liver diseases
AIDS
Suicide
Respiratory diseases
Cerebrovascular diseases
Septicemia
Influenza/pneumonia
Digestive diseases

0

500 1,000 1,500 2,000 2,500 3,000 3,500

Heart diseases and cancer accounted for half of all
State prison deaths
Correctional authorities reported over 60 different fatal medical conditions, but prisoner deaths were heavily concentrated among a small number of diseases. Heart diseases
(27%), including heart attacks, and cancer (23%) caused
half of all State prisoner deaths from 2001 to 2004. When
combined with liver diseases (10%) and AIDS-related
causes (7%), two-thirds of all State prisoner deaths were
caused by these four medical conditions.

• 40% occurred in 5 States (Texas, California, Florida,
New York, and Pennsylvania)

Death rates higher among men than women in 9 of the
10 leading causes of death

• Over 90% were evaluated by medical staff for the fatal
illness; 93% received medications for the illness.

While the leading causes of death were the same for both
men and women in State prisons, men died at a much
higher rate than women. The mortality rate of men for all
causes of death (257 deaths per 100,000 inmates) was
72% higher than that of women (149 deaths per 100,000
inmates). For the top three causes of death (heart diseases,
cancer, and liver diseases), the male death rate was twice
the female rate. Septicemia (for example, streptococcal and
staphylococcal infection) was the lone cause of death that
was higher among female State prisoners (10 deaths per
100,000) than male State prisoners (5 per 100,000).

Comparative mortality rates showed —
• Male State prisoners had a death rate 72% higher than
female State prisoners
• State prisoners had a 19% lower death rate than the
adult U.S. resident population; among blacks, the mortality rate was 57% lower among prisoners.
*Total number of deaths excludes 258 State prison executions during 20012004. See Capital Punishment, 2005 <http://www.ojp.usdoj.gov/bjs/
abstract/cp05.htm>.

Black and Hispanic inmate mortality rates identical;
white inmates 67% higher

Among deaths of elderly State prisoners, 85% were 45
or older when admitted

Between 2001 and 2004 the mortality rates of black and
Hispanic State prisoners were identical (206 deaths per
100,000 inmates), while the rate for white inmates (343 per
100,000) was 67% higher. For heart diseases and cancer,
the mortality rate of whites was nearly twice that of blacks
and Hispanics. Despite higher mortality rates for most leading causes of death, white inmates had a lower AIDSrelated death rate (10 per 100,000) than black (26 per
100,000) and Hispanic (18 per 100,000) State prisoners.

Among older inmates, the mortality rate of those age 65 or
older was particularly high. Though these elderly inmates
made up 1% of prisoners, they accounted for 15% of prisoner deaths. The mortality rate of elderly prisoners was
nearly 3 times higher than that of inmates age 55-64. The
death rate for aortic aneurysm was 6 times higher among
elderly inmates than those age 55-64; for respiratory diseases, the rate was 5 times higher.

Two-thirds of State prison deaths involved inmates age
45 or older
Mortality rates rose dramatically with age. The death rate of
inmates age 55 and older (1,973 per 100,000) was over 3
times higher than that of inmates age 45-54 (566 per
100,000), and 11 times higher than those age 35-44 (177
per 100,000). Inmates age 45 or older comprised 14% of
State prisoners from 2001 to 2004, but accounted for 67%
of all inmate deaths over the same period.
Unlike the leading fatal illnesses, suicide rates were stable
across all adult age groups. While suicide was the leading
cause of death for inmates under the age of 35, it fell far
behind several illnesses as a cause of death for older
inmates. Among inmates age 55 or older, there were 46
heart disease deaths and 42 cancer deaths for each suicide.
Average annual mortality rate, per
100,000 State prisoners, by age
25-34
35-44
45-54 55 or older

Cause of death
Leading illnesses
Heart diseases
11
41
144
689
Cancer
5
28
135
635
Liver diseases
2
19
96
126
Respiratory diseases
2
5
18
107
Suicide
16
14
15
15
Note: Respiratory diseases exclude influenza and pneumonia.

Lung cancer accounted for 1 in 3 cancer deaths in
State prison, more than the next 6 leading cancer
sites combined
A specific cancer site was named in 79% of the cancer
deaths. Lung cancer alone accounted for 8% of all State
prisoner deaths. More State prisoner deaths were caused
by lung cancer (910) than the next 6 leading sites of cancer deaths (864) combined (i.e., liver, colon, pancreas,
non-Hodgkins lymphoma, prostate, and leukemia).
Men in State prison died from cancer at twice the rate of
women (60 deaths per 100,000 inmates compared to 27
per 100,000). This gender difference in cancer death rates
was particularly evident for the most common fatal cancer
sites. Men died from lung, liver and colon cancer at a rate
nearly triple that of women. Regardless of gender, lung
cancer caused twice as many deaths as any other site.

2 Medical Causes of Death in State Prisons, 2001-2004

Deaths of elderly inmates typically did not involve offenders
who had been incarcerated as young adults on lengthy (or
“life”) sentences. A majority (59%) of the elderly State prisoners who died during this period were 55 or older when
admitted, and 85% were at least 45 years old at time of
admission.
Death from illness increased with time served in prison
The death rate from illness rose sharply for prisoners serving lengthy terms. For inmates who had served at least 10
years in State prison, the mortality rate due to illness (503
deaths per 100,000 inmates) was triple that of inmates who
had served less than 5 years in prison (162 per 100,000).
Long-serving inmates showed similar increases in death
rates for many of the leading fatal illnesses. AIDS-related
causes had the smallest increase in mortality for long-serving inmates.
Average annual mortality rate per
100,000 State prisoners, by time served
Less than
120 mos.
Cause of death
60 mos. 60-119 mos. or longer
Heart diseases
47
84
160
Cancer
38
70
151
Liver diseases
20
31
48
AIDS-related
16
21
24
Respiratory diseases
7
13
38

Deaths due to gender-specific cancer sites varied. Breast,
ovarian, cervical and uterine cancer accounted for 24% of
female cancer deaths. By comparison, prostate and testicular cancer accounted for 4% of male cancer deaths.
Breast cancer was also the second most common site of
female cancer deaths.
Cancer deaths in State prisons, 2001-04
Lung
Site unspecified
Other cancers
Liver
Colon
Pancreas
Non-Hodgkin's lymphoma
Prostate

0

200

400

600

800

1,000

Time served in prison played little role in the death rate
due to communicable diseases

Over 40% of prisoner deaths took place in 5 States;
mortality rates varied widely across States

Death rates from communicable diseases (other than AIDS)
were much lower than those for the leading fatal illnesses,
and did not show the same increases among long-serving
inmates. There were no deaths in State prisons nationwide
from syphilis, meningitis, or meningococcal infection. The
death rate from tuberculosis was lower than 0.5 per 100,000
for all inmates, regardless of time served. The death rate for
viral hepatitis (all types) was 1 per 100,000 for inmates who
served less than 5 years and rose to 3 per 100,000 for
inmates who served longer than 5 years.

Five States each recorded over 500 prisoner deaths from
2001 to 2004. Texas led all States with 1,582 deaths, followed by California (1,306), Florida (813), New York (712),
and Pennsylvania (558). These five States accounted for
41% of all State prisoner deaths during the 4-year period.

Two-thirds of illness deaths resulted from pre-existing
conditions — including 94% of AIDS deaths
In 68% of the illness deaths, State prison authorities
reported that the fatal medical condition was present at the
time of admission. AIDS (94%)* and liver diseases (88%)
were most commonly present at the time of admission. Cancer was present at admission in 54% of all cancer fatalities.
Among leading causes of death, influenza or pneumonia
was least likely to be present at time of admission (39%).
In 93% of deaths from illness, medical staff had
provided medications for the fatal condition
Among illness fatalities, 94% were evaluated by medical
staff prior to death. Diagnostic tests, such as an x-ray, MRI,
or blood test, were performed in 89% of these cases. For
93% of illness fatalities, medications had been administered
for the fatal medical condition.
Surgery had been performed on 1 in 5 inmates who died
from illness. Among deaths from leading causes, prisoners
who died from septicemia were most likely to have received
surgical treatments (35%), followed by those who had cancer and digestive diseases (31% each). Fatalities from AIDS
(11%) and heart diseases (15%) were least likely to have
had surgery.
*It is not known how many of the remaining 6% of AIDS-related deaths
involved inmates whose HIV-positive status was undetected at time of
admission and how many contracted HIV during their prison term.

Since 1991, AIDS-related death rate dropped 84%;
death rate for all other illnesses rose 82%
Prior to the enactment of the Death in Custody Reporting
Act of 2000, the only national statistics on prisoner deaths
from specific illnesses were annual counts of AIDS-related
deaths begun in 1991. Between 1991 and 2004, sharply
different trends emerged for the major causes of State
prison deaths. While the death rate for AIDS dropped by
over 80%, the death rate from all other illnesses rose by
82%. Over the same period, the suicide rate was nearly
stable and homicide rates dropped by one-half.*
*See Suicide and Homicide in State Prisons and Local Jails <http://www.
ojp.usdoj.gov/bjs/abstract/shsplj.htm>.

Illness mortality rates varied widely across States. Five
States had more than 300 illness deaths per 100,000
inmates, while 10 States had fewer than 150 illness deaths
per 100,000 inmates.
Illness mortality rate per 100,000 State inmates, 2001-2004
Five highest
Five lowest
Louisiana
388
Vermont
108
Tennessee
344
Alaska
111
Pennsylvania
328
Iowa
111
West Virginia
326
North Dakota
116
Kentucky
323
Utah
116

Specific medical causes of death also varied widely across
States:
• Heart disease death rates varied from 10 per 100,000 in
New Hampshire to 189 per 100,000 in West Virginia
• Cancer death rates ranged from 0 in Vermont to 103 per
100,000 in Louisiana
• Liver disease death rates varied from 0 in Rhode Island
to 58 per 100,000 in Colorado.
Mortality rate in State prisons nearly 20% lower than in
U.S. resident population
From 2001 to 2004, 99% of State prisoners were between
ages 15 and 64. When compared to mortality rates for U.S.
residents in this age group, the overall mortality rate of State
prisoners was 19% lower during this period. White and Hispanic prisoners had death rates slightly above their counterparts in the resident population, while blacks were 57% less
likely to die in State prisons. For all age groups under the
age of 45, the death rate in State prisons was lower than in
the U.S. resident population. For the 55 to 64 age group,
prison death rates were 56% higher.
Mortality rate per 100,000 State prisoners, 1991-2004
250

Illness (excludes AIDS)

200
150

AIDS

100
50
0
1991

Other causes
1995

1999

2003

Medical Causes of Death in State Prisons, 2001-2004 3

*NCJ~216340*

U.S. Department of Justice
Office of Justice Programs
Bureau of Justice Statistics

PRESORTED STANDARD
POSTAGE & FEES PAID
DOJ/BJS
Permit No. G-91

Washington, DC 20531

Official Business
Penalty for Private Use $300

Methodology
In 2001 BJS began collecting individual records of all State prisoner deaths
pursuant to PL 106-297. Prior to the
collection of these records, BJS collected aggregate death counts in the
National Prisoners Statistics (NPS)
program. Since 1978 NPS counts have
used a single category of “illness/natural causes,” with AIDS-related deaths
collected as a separate count from all
other illnesses starting in 1991.
Records collected under the Deaths in
Custody Reporting Program (DCRP)
were submitted by correctional authorities in all 50 States for each year from
2001 to 2004. For each death marked
as illness/natural cause, respondents
were directed to specify a medical
cause of death based on an autopsy
review, if available.
These text entries were later coded by
clinical data specialists according to
the World Health Organization’s International Statistical Classification of
Diseases and Related Health Problems, Tenth Revision (ICD-10). BJS
analysis of causes of death used categories of disease published by the
National Center for Health Statistics

(NCHS). See the NCHS website for
mortality data for the U.S. resident
population at <http://www.cdc.gov/
nchs/deaths.htm>.
In compiling their DCRP records,
States are instructed to include deaths
of any inmates held in private prisons,
medical facilities, substance abuse or
mental health treatment centers, or
any deaths at a work release site.
Deaths of State prisoners held in local
jails are excluded, but covered by a
separate collection. Also excluded are
executions and escaped inmates.

This report in portable document
format and in ASCII and its related
statistical data and tables are
available at the BJS World Wide
Web Internet site: <http://www.
ojp.usdoj.gov/bjs/abstract/
mcdsp04.htm>.

Office of Justice Programs
Partnerships for Safer Communities
http://www.ojp.usdoj.gov

4 Medical Causes of Death in State Prisons, 2001-2004

The Bureau of Justice Statistics is
the statistical agency of the U.S.
Department of Justice. Jeffrey L.
Sedgwick is director.
This Data Brief was written by
Christopher J. Mumola, under the
supervision of Allen J. Beck.
Margaret E. Noonan verified the
report.
Data collection and processing of
2001-2002 death records were
carried out by Lara E. Allen; data
collection and processing of 20032004 death records were carried
out by Greta B. Clark and Pamela
Butler, under the supervision of
Charlene Sebold, Governments
Division, Census Bureau, U.S.
Department of Commerce. Greg
Wolfe, of GW Services, converted all
death causes from text to ICD-10
codes.
Carolyn C. Williams and Tina Dorsey
of BJS produced and edited the
report and Jayne Robinson prepared
the report for final printing, under the
supervision of Doris J. James.
January 2007, NCJ 216340

Appendix table 1. Causes of death in State prisons, with average annual
mortality rate per 100,000 inmates, 2001-2004

Cause of death
All causes
Heart diseases
Cancer
Liver diseases
Chronic liver disease/cirrhosis
Other liver diseases
AIDS
Suicide
Respiratory diseasesa
Chronic lower respiratory diseases
Lung diseases due to external agents
Other/unspecified respiratory diseases
Cerebrovascular diseases
Septicemia
Influenza/pneumonia
Digestive diseasesb
Disorders of the gall bladder, biliary
tract & pancreas
Diseases of the esophagus, stomach
and duodenum
Diseases of the peritoneum
Noninfective enteritis and colitis
Other diseases of the intestines
Other/unspecified digestive diseases
Kidney diseases
Nephritis, nephrosis, nephrotic
syndrome
Renal tubulo-interstitial diseases
Other disorders of the kidney and
ureter
Homicide
Alcohol/drug intoxication
Accidental injury
Viral hepatitis (all types)
Aortic aneurysm
Diabetes mellitus
Other disorders of the nervous system
Anemias
Benign neoplasms, in situ neoplasms
Unspecified illness deaths —
Illness — specific medical cause
unknown
Illness — multiple medical causes,
unresolvedc
All other illnesses
Deaths without a known cause —
Unknown cause of death
Multiple causes, unresolvedd

Number of State prisoner deaths
2001
2002
2003
2004

Average annual
mortality rate, per
Percent, 100,000 inmates,
2001-04 2001-04

2,878

2,946

3,167

3,138

100.0%

250

788
655
320
89
231
270
169
97
31
2
64
93
50
47
40

828
660
301
88
213
245
168
125
35
2
88
90
64
47
61

836
786
315
78
237
210
200
130
39
2
89
122
67
74
56

862
719
294
84
210
145
200
143
57
2
84
89
81
57
49

27.3%
23.3
10.1
2.8
7.3
7.2
6.1
4.1
1.3
0.1
2.7
3.2
2.2
1.9
1.7

68
58
25
7
18
18
15
10
3
0
7
8
5
5
4

7

5

8

5

0.2

1

4
5
1
4
19
39

7
3
1
8
37
47

7
4
2
7
28
57

4
5
1
6
28
57

0.2
0.1
0.0
0.2
0.9
1.6

0
0
0
1
2
4

39
0

44
1

55
1

55
1

1.6
0.0

4
0

0
39
36
23
9
18
21
12
5
6
74

2
48
37
31
16
15
11
4
8
9
59

1
50
23
26
17
17
11
8
8
4
71

1
51
23
37
40
28
16
10
5
7
110

0.0
1.6
1.0
1.0
0.7
0.6
0.5
0.3
0.2
0.2
2.6

0
4
2
2
2
2
1
1
1
1
6

64

48

56

101

2.2

6

10
29
38
33
5

11
34
38
36
2

15
54
25
16
9

9
78
37
30
7

0.4
1.6
1.1
0.9
0.2

1
4
3
2
0

Note: Detail may not add to total due to rounding. The 20 leading causes of death listed in the table account
for 94.7% of all State prison deaths during 2001-2004. Executions are not included; for data on executions, see
Capital Punishment, 2005, <http://www.ojp.usdoj.gov/bjs/abstract/cp05.htm>.
a
Excludes influenza and pneumonia.
bExcludes liver diseases.
c
In all such cases, none of the causes of death matched the 63 medical causes of death cited in any record
for which a single illness was identified as the cause of death.
dSuch cases were checked "other causes of death," with a text description of events, but the information
was insufficient to classify the death to a single cause.

Medical Causes of Death in State Prisons, 2001-2004 5

Appendix table 2. Profile of cancer deaths in State prisons, 2001-2004
Number of State prison inmate deaths, 2001-04
Gender
Site of cancer
All causes of death

All
inmates

Race/Hispanic origin

Male Female

Age
Under
18
18-24 25-34

White Black

Hispanic

5,898 4,714

1,285

7

292

55 or
older

35-44

45-54

1,041

2,616

3,758

4,402

12,129

11,645

482

2,820

2,731

88

1,461

843

218

0

15

75

415

894

1,418

Lung
Liverb
Colonc
Pancreas
Non-Hodgkin's lymphoma
Prostate
Leukemia
Lip, oral cavity, and pharynx
Stomach
Kidney and renal pelvis
Esophagus
Other lymphoid, hematopoietic
and related tissued
Bladder
Skin
Larynx
Breast
Testicles
Ovary
Cervix uteri
Meninges, brain, and central
nervous system
Corpus uteri and uterus, part
unspecificed
Hodgkin's disease

910
276
171
124
114
92
87
68
61
61
51

885
273
166
123
112
92
84
67
59
60
50

25
3
5
1
2
0
3
1
2
1
1

505
111
85
55
65
45
42
39
21
25
35

351
96
60
52
34
38
36
24
35
33
12

44
65
21
13
14
9
8
3
5
3
3

0
0
0
0
0
0
0
0
0
0
0

2
1
1
0
2
0
2
0
1
0
0

4
1
2
2
7
0
11
0
2
2
0

114
22
30
18
24
0
26
7
12
11
4

279
128
59
37
43
9
21
26
19
25
12

511
124
79
67
38
83
27
35
26
23
35

44
32
29
29
17
14
5
3

43
31
28
28
4
14
0
0

1
1
1
1
13
0
4
3

17
24
24
16
4
5
4
1

23
7
3
12
12
5
0
2

3
0
1
1
0
4
1
0

0
0
0
0
0
0
0
0

1
0
0
0
0
1
0
0

1
0
2
0
2
5
0
1

7
1
11
0
6
7
2
1

14
7
8
8
6
1
2
1

21
24
8
21
3
0
1
0

3

0

3

1

2

0

0

0

1

1

1

0

1
0

0
0

1
0

0
0

1
0

0
0

0
0

0
0

0
0

0
0

0
0

1
0

All other types of cancer
Cancer, type unspecified

72
585

71
568

1
17

31
323

27
211

10
37

0
0

2
3

15
22

20
99

14
180

21
279

Cancer, all sites
a

Note: Detail does not sum to total because multiple sites of cancer were identified for some cases.
aIncludes the trachea and bronchus.
bIncludes the bile ducts.
cIncludes the rectum and anus.
d
Excludes Hodgkin's disease, non-Hodgkin's lymphoma, and leukemia.

6 Medical Causes of Death in State Prisons, 2001-2004

Appendix table 3. Average annual mortality rate, per 100,000 State prison inmates, from leading causes of death,
by selected characteristics, 2001-2004
Gender
Cause of death

All
inmates

Average annual mortality rate, per 100,000 State prison inmates, 2001-04
Race/Hispanic origin
Age

Male

Female

White

250

257

149

343

206

206

68
58
25
18
15
10
8
5
5
4

71
60
26
18
15
10
8
5
5
4

35
27
14
12
12
7
7
10
4
2

102
85
37
10
24
15
10
7
7
5

56
47
14
26
8
9
8
5
3
4

38
39
40
18
17
5
6
4
4
6

Number of deaths, 2001-04 12,129

11,645

482

5,898

4,714

1,285

All causes
Heart diseases
Cancer
Liver diseases
AIDS
Suicide
Respiratory diseasesa
Cerebrovascular diseases
Septicemia
Influenza/pneumonia
Digestive diseasesb

Black Hispanic

Under 18

55 or
older

18-24

25-34

35-44

45-54

107

34

64

177

566

1,973

0
0
0
0
46
0
0
0
0
0

4
2
0
1
14
2
1
0
0
0

11
5
2
8
16
2
2
1
1
1

41
28
19
28
14
5
4
3
3
3

144
135
96
40
15
18
21
15
9
11

689
635
126
25
15
107
70
46
43
32

7

292

1,041

2,616

3,758

4,402

Note: The 10 leading causes of death accounted for 90% of all deaths in State prisons during 2001-2004 with a reported cause.
Records on 2 deaths did not indicate the gender of the deceased and 13 records were missing the age of the deceased.
aExcludes influenza and pneumonia.
b
Excludes liver diseases.

Appendix table 4. Average annual mortality rate of State
prisoners age 55 or older, by cause of death, 2001-2004
Cause of death
All causes
Illness/natural cause*
Heart diseases
Cancer
Respiratory diseases
Cerebrovascular diseases
Influenza/pneumonia
Liver diseases
Septicemia
Digestive diseases
Aortic aneurysm
Kidney diseases
Accidental injury
Suicide
Homicide
Other
Intoxication
Unknown
Average annual custody population
Number of deaths, 2001-04

Average annual mortality rate, per
100,000 State inmates, 2001-04
Age 55-64
Age 65 or older
1,481

3,758

1,434
457
522
57
46
25
132
33
22
10
24
5
17
8
1
4
12

3,705
1,528
1,052
288
153
111
103
88
70
62
58
10
10
4
4
2
23

43,790

12,133

2,576

1,826

Appendix table 5. Time served since
admission for deaths in State prison,
age 65 or older, 2001-2004
Time served
since admission
Less than 1 month
1-5 months
6-11 months
12-23 months
24-59 months
60-119 months
120-239 months
240 months or more

Percent of State
prisoner deaths,
age 65 or older,
2001-04
0.7%
4.0
4.4
8.9
17.9
23.1
26.0
15.0

*Includes the 10 leading causes of illness deaths among inmates age 65 or
older.

Medical Causes of Death in State Prisons, 2001-2004 7

Appendix table 6. Average annual mortality rate for leading causes of illness
deaths in State prison, by time served, 2001-2004

Cause of death
All illnesses

Average annual mortality rate, per 100,000 inmates, 2001-04
Time served after admission (in months)
All
Less
120 or
inmates than 12 12-23
24-59 60-119 more
223

140

164

184

264

503

Heart diseases
Cancer
Liver diseases
AIDS
Respiratory diseasesa
Cerebrovascular diseases
Septicemia
Influenza/pneumonia
Digestive diseasesb
Kidney diseases

69
58
25
18
10
8
5
5
4
4

44
30
14
16
7
5
4
3
3
2

47
41
21
16
6
6
3
4
3
3

52
46
25
16
8
6
5
4
4
3

84
70
31
21
13
11
5
5
4
5

160
151
48
24
38
16
12
10
9
11

Number of illness deaths,
2001-04c

10,830

1,908

1,362

2,317

2,106

3,038

Appendix table 7. Average annual
mortality rate for selected communicable
diseases in State prisons, by time served,
2001-2004
Average annual mortality rate,
per 100,000 inmates, 2001-04,
by time served (in months)
0-11
12-59 60 or more

Selected
communicable
diseases
Viral hepatitis
Tuberculosis
Meningitis
Meningococcal
infection
Syphilis

1
<0.5
0

1
<0.5
0

3
<0.5
0

0
0

0
0

0
0

Note: Estimates of the number of State prisoners
in each category of time served were drawn from
the 2004 Survey of Inmates in State Correctional
Facilities.

Note: Estimates of the number of State prisoners in each category of time served are drawn
from the 2004 Survey of Inmates in State Correctional Facilities.
a
Excludes influenza and pneumonia.
b
Excludes liver diseases.
cTotal includes 29 illness deaths in 2001, 23 illness deaths in 2002, 2 illness deaths in 2003,
and 45 illness deaths in 2004 missing information on time served.

Appendix table 8. Leading causes of illness deaths in State prisons, by pre-existing status at time of admission
and medical treatment provided, 2001-2004

Cause of death
All illnesses
Heart diseases
Cancer
Liver diseases
AIDS
Respiratory diseasesa
Cerebrovascular diseases
Septicemia
Influenza/pneumonia
Digestive diseasesb
Kidney diseases

Medical treatment provided for the fatal medical condition
Pre-existing
Evaluated by Diagnostic test
Treatments
Housed in a
condition at time physician/
(e.g., x-rays,
other than
special
of admission
medical staff MRI, blood test,) Medications medication
Surgery medical unit
68.3%

94.1%

89.3%

93.3%

70.7%

20.1%

68.2%

68.4%
54.4
88.5
93.5
71.9
52.4
68.7
38.6
67.7
77.4

90.1%
96.5
96.7
96.2
95.9
89.2
95.5
96.2
95.6
97.1

82.7%
94.5
92.4
93.3
63.9
80.9
90.3
90.5
87.5
95.9

86.8%
97.8
97.1
96.4
96.7
85.7
95.6
96.0
93.3
97.5

57.9%
82.6
70.7
72.8
73.2
64.0
81.4
76.4
75.3
83.8

14.6%
30.7
15.5
11.5
12.2
22.8
35.4
19.0
31.5
23.5

48.3
84.7
74.3
72.1
70.8
61.8
82.4
70.6
71.9
77.4

Note: Percentages are based on cases in which provision of specific medical treatments was known.
a
Excludes influenza and pneumonia.
b
Excludes liver diseases.

8 Medical Causes of Death in State Prisons, 2001-2004

Appendix table 9. Average annual mortality rate of State prison inmates,
per 100,000 inmates, from leading causes of illness deaths, by State, 2001-2004
Region and
jurisdiction
U.S. totalb

Total
number of
deaths,
2001-04

Average annual mortality rate, per 100,000 State prison inmates, 2001-04
All
illnesses

Heart
diseases

Cancer

Liver
diseases

AIDS

Respiratory
diseasesa

12,120

223

68

58

25

18

10

Northeast
Connecticutc
Maine
Massachusetts
New Hampshire
New Jersey
New York
Pennsylvania
Rhode Islandc
Vermontc

1,832
130
19
104
23
248
712
558
26
12

237
141
233
226
163
201
240
328
121
108

74
47
81
86
10
67
63
115
49
36

53
15
65
64
92
37
59
70
36
0

29
32
41
20
30
12
30
41
0
36

26
15
10
10
39
45
...
14
36

10
9
0
0
10
10
10
15
0
0

Midwest
Illinois
Indiana
Iowa
Kansas
Michigan
Minnesota
Missouri
Nebraska
North Dakota
Ohio
South Dakota
Wisconsin

2,195
337
209
48
105
492
47
265
29
6
446
31
180

203
166
219
111
258
231
143
207
156
116
232
184
180

79
63
70
30
84
94
44
87
44
71
99
75
74

53
42
52
51
65
68
41
47
37
20
60
16
49

19
14
21
9
22
24
29
19
38
25
15
42
17

8
19
7
0
3
8
0
7
6
0
7
0
4

10
3
12
9
6
10
4
9
6
0
18
25
11

South
Alabama
Arkansas
Delawarec
Florida
Georgia
Kentucky
Louisiana
Maryland
Mississippi
North Carolina
Oklahoma
South Carolina
Tennessee
Texas
Virginia
West Virginia

5,710
329
146
63
813
415
164
314
287
180
297
239
229
280
1,582
319
53

251
291
268
178
249
201
323
388
246
273
199
234
239
344
241
240
326

75
91
92
29
59
68
119
117
65
80
61
75
108
116
65
73
189

67
71
79
33
78
57
94
103
63
77
56
60
39
75
63
65
82

25
32
17
26
17
14
22
42
26
13
19
29
18
51
30
31
7

25
25
21
43
41
24
23
53
55
13
22
11
15
22
14
24
0

12
13
4
11
8
10
14
6
13
3
6
16
13
20
14
12
14

West
Alaskac
Arizona
California
Colorado
Hawaiic
Idaho
Montana
Nevada
New Mexico
Oregon
Utah
Washington
Wyoming

2,383
34
289
1,306
180
36
50
35
107
53
116
35
130
12

181
111
225
170
202
124
182
272
227
181
217
116
175
142

43
53
63
34
39
33
41
56
75
53
82
35
61
33

50
17
67
49
34
19
73
83
65
53
61
23
36
48

29
6
41
26
58
38
23
47
12
25
29
6
25
14

9
0
8
12
...
5
0
0
12
0
2
0
9
16

8
6
8
8
17
5
5
10
5
17
5
0
5
0

Note: All mortality rates were calculated based on custody populations for June 30 in each year.
... Data not reported due to State law prohibiting the release of named records related to AIDS-related
deaths. For information on AIDS deaths in these States, see HIV in Prisons, 2004, <http://www.ojp.usdoj.
gov/bjs/abstract/hivp04.htm>.
a
Excludes influenza and pneumonia.
bExcludes nine total prisoner deaths reported by the District of Columbia in 2001. Two of these deaths were
from heart disease; liver disease, AIDS, respiratory disease, and digestive disease each accounted for one
death. The District of Columbia transferred all prisoner custody operations to the Federal Bureau of Prisons
during 2001.
cPrisons and jails form one integrated system.

Medical Causes of Death in State Prisons, 2001-2004 9

Appendix table 10. Average annual mortality rate from leading causes of illness deaths, per 100,000 State prison inmates,
among the States, 2001-2004
Average annual mortality rate, per 100,000 State prison inmates, 2001-04
Heart diseases
Cancer
Liver diseases

All illnesses
Five highest
Louisiana
Tennessee
Pennsylvania
West Virginia
Kentucky

388
344
328
326
323

West Virginia
Kentucky
Louisiana
Tennessee
Pennsylvania

Five lowest
Vermont
Alaska
Iowa
North Dakota
Utah

108
111
111
116
116

New Hampshire
Delaware
Iowa
Hawaii
Wyoming

189
119
117
116
115
10
29
30
33
33

Louisiana
Kentucky
New Hampshire
Montana
West Virginia
Vermont
Connecticut
South Dakota
Alaska
Hawaii

103
94
92
83
82

Colorado
Tennessee
Montana
Louisiana
South Dakota

58
51
47
42
42

0
15
16
17
19

Rhode Island
Alaska
Utah
West Virginia
Iowa

0
6
6
7
9

Respiratory diseases*
South Dakota
Tennessee
Ohio
Colorado
New Mexico
Seven Sates
(Maine, Massachusetts,
North Dakota, Rhode
Island, Utah, Vermont,
Wyoming)

Note: AIDS death rates are not listed because all States did not report AIDS deaths. For information on AIDS deaths by State, see HIV in Prisons,
2004, <http://www.ojp.usdoj.gov/bjs/abstract/hivp04.htm>.
*Excludes influenza and pneumonia.

Appendix table 11. Average annual mortality rate, per 100,000 residents,
of State prisoners and U.S. residents, by selected characteristics
Average annual mortality rate,
per 100,000 U.S. residents,
age 15-64, 2001-03
All U.S. residents
All causes
All, excluding transportation deaths

Average annual mortality
rate, per 100,000 State
prisoners, 2001-04

308

250

289

~

Gender
Male
Female

387
231

257
149

Race/Hispanic origin
White, non-Hispanic
Black, non-Hispanic
Hispanic

312
484
180

343
206
206

Age
15-24
25-34
35-44
45-54
55-64

81
105
203
430
952

34
64
179
560
1,481

Note: During the period 2001-2004, inmates age 15 to 64 made up 99% of the State
prison population. Mortality data on U.S. residents are from the National Center for Health
Statistics at the Centers for Disease Control and Prevention. See “Deaths: Final Data for
2003,” National Vital Statistics Reports, Volume 54, Number 13, April 19, 2006, <http://
www.cdc.gov/nchs/data/nvsr/nvsr54/nvsr54_13.pdf>.
~ Not applicable.

10 Medical Causes of Death in State Prisons, 2001-2004

25
20
18
17
17
0

Appendix table 12. Causes of death in State prisons, with International Classification of Disease, 10th revision
(ICD-10) codes and average annual mortality rate per 100,000 inmates, 2001-2004

Cause of death (ICD-10 code range)
All causes
Heart diseases (I00-I09, I11, I13, I20, or I51)
Cancer (C00-C97)
Other liver diseases, excluding cirrhosis (K71-K72, K75-K77)
AIDSa
Suicidea
Cerebrovascular diseases (I60-I69)
Chronic liver disease (K70, K73-K74)
Other respiratory diseases (J00-J06, J30-J39, J67, J70-J98)
Illness — specific medical cause unknown (R00-R99)
Septicemia (A40-A41)
Influenza/pneumonia (J10-J18)
Nephritis, nephrosis, nephrotic syndrome (N00-N07, N17-N19, N25-N27)
Homicidea
Chronic lower respiratory diseases (J40-J47)
Alcohol/drug intoxication a
Accidental injurya
Unknown cause of deathb
Other diseases of the digestive system (K90-K93)
Viral hepatitis, all types (B15-B19)
Aortic aneurysm (I71-I78)
Diabetes mellitus (E10-E14)
Illness — multiple medical causes, unresolvedc
Other disorders of the nervous system (G90-G99)
Anemias (D50-D64)
Benign neoplasms, in-situ neoplasms (D00-D48)
Disorders of the gall bladder, biliary tract & pancreas (K80-K87)
Other diseases of the intestines (K55-K63)
Other causes/manners of death not listeda
Diseases of the esophagus, stomach & duodenum (K20-K31)
Atherosclerosis (I70)
Mycoses (B35-B49)
Diseases of the peritoneum (K65-K67)
Metabolic disorders (E70-E90)
Inflammatory diseases of the central nervous system (G00-G09)
Episodic and paroxysmal disorders (G40-G47)
Hypertension, hypertensive renal failure (I10-I12)
Diseases of the veins, lymphatic vessels, lymph nodes (I80-I89)
Lung diseases due to external agents (J60-J70)
Systemic atrophies, primarily affecting the central nervous system (G10-G13)
Congenital malformations, deformations (Q00-Q99)
Systemic connective tissue disorders (M30-M36)
Coagulation defects, purpura, other haemorrhagic conditions (D65-D69)
Other/unspecified infectious diseases (B99)
Tuberculosis (A16-A19)
Noninfective enteritis and colitis (K50-K52)
Protozoal diseases (B50-B64)
Other bacterial diseases (A30-A39, A42-A49)
Other disorders of the kidney and ureter (N28-N29)
Alzheimer's disease (G30)
Sequelae of infectious & parasitic diseases (B90-B94)
Other diseases of the blood, blood-forming organs (D70-D77)
Renal tubulo-interstitial diseases (N10-N16)
Other disorders of the skin and subcutaneous tissue (L80-L99)
Certain disorders involving the immune mechanism (D80-D89)
Organic mental disorders (F00-F09)
Hypotension & other/unspecified circulatory disorders (I95-I99)
Obesity and other hyperalimentation (E65-E68)
Demyelinating diseases of the central nervous system, multiple sclerosis (G35-G37)
Other disorders of glucose regulation & pancreatic internal secretion (E15-E16)
Mental & behavioral disorders due to psychoactive substance use (F10-F19)

Number of deaths in
State prisons 2001-04

Average annual
mortality rate, per
100,000 inmates
2001-04

12,129

250

3,314
2,820
891
870
737
394
339
325
269
262
225
193
188
162
119
117
115
112
82
78
59
45
34
26
26
25
25
23
22
17
17
17
17
17
11
9
9
8
8
8
8
8
7
6
5
5
4
4
4
4
3
3
3
3
3
3
2
2
2
2

68
58
18
18
15
8
7
7
6
5
5
4
4
3
2
2
2
2
2
2
1
1
1
1
1
1
1
<0.5
<0.5
<0.5
<0.5
<0.5
<0.5
<0.5
<0.5
<0.5
<0.5
<0.5
<0.5
<0.5
<0.5
<0.5
<0.5
<0.5
<0.5
<0.5
<0.5
<0.5
<0.5
<0.5
<0.5
<0.5
<0.5
<0.5
<0.5
<0.5
<0.5
<0.5
<0.5
<0.5

Medical Causes of Death in State Prisons, 2001-2004

11

Appendix table 12. continued

Cause of death (ICD-10 code range)
All causes
Parkinson's disease (G20-G21)
Unspecified mental disorders (F99)
Infections of the skin and subcutaneous tissue (L00-L08)
Osteopathies and chondropathies (M80-M94)
Arthritis — inflammatory polyarthropathies (M05-M14)
Viral infections of the central nervous system (A80-A89)
Helminthiases (B65-B83)
Other disorders of the endocrine glands (E20-E35)
Diseases of the appendix (K35-K38)
Polyneuropathies & other disorders of the peripheral nervous system (G60-G64)
Muscle disorders (M60-M63)

Number of deaths in
State prisons 2001-04

Average annual
mortality rate, per
100,000 inmates
2001-04

12,129

250

2
2
1
1
1
1
1
1
1
1
1

<0.5
<0.5
<0.5
<0.5
<0.5
<0.5
<0.5
<0.5
<0.5
<0.5
<0.5

Note: For the entire 4-year period, 66% of the illness death records specified a single medical cause of death. The medical causes listed
in these cases were ranked by frequency for both male and female inmates. The medical cause of death for the remaining illness deaths
was selected by choosing the most common cause listed, within gender.
aICD-10 codes were only used for deaths attributed to “illness/natural causes.” AIDS was a separate category under "cause of death."
Any “illness/natural causes” which listed AIDS or HIV among the causes of death were recoded to “AIDS-related” deaths.
bCases were checked "other causes of death" with a text description of events, but the information was insufficient to classify the case to
any single cause.
c
In all such cases, none of the causes of death matched the 63 medical causes of death cited in the single-cause cases of illness deaths.

12 Medical Causes of Death in State Prisons, 2001-2004