
HIV in Prisons 1997, DOJ BJS, 1999
Download original document:
Document text
Document text
This text is machine-read, and may contain errors. Check the original document to verify accuracy.
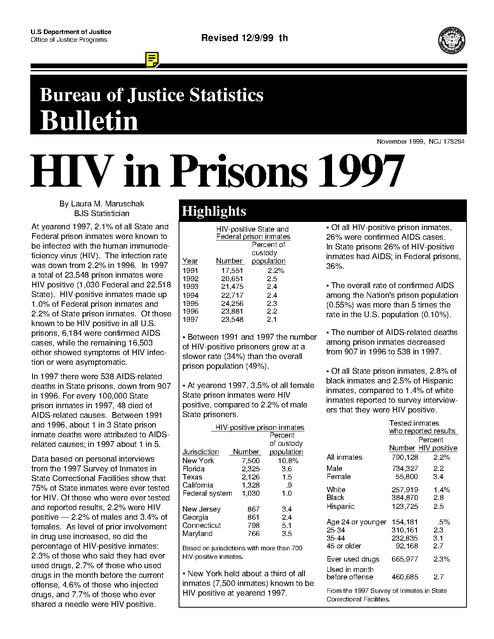
U.S Department of Justice Office of Justice Programs Revised 12/9/99 th Bureau of Justice Statistics Bulletin November 1999, NCJ 178284 HIV in Prisons 1997 By Laura M. Maruschak BJS Statistician At yearend 1997, 2.1% of all State and Federal prison inmates were known to be infected with the human immunodeficiency virus (HIV). The infection rate was down from 2.2% in 1996. In 1997 a total of 23,548 prison inmates were HIV positive (1,030 Federal and 22,518 State). HIV-positive inmates made up 1.0% of Federal prison inmates and 2.2% of State prison inmates. Of those known to be HIV positive in all U.S. prisons, 6,184 were confirmed AIDS cases, while the remaining 16,503 either showed symptoms of HIV infection or were asymptomatic. In 1997 there were 538 AIDS-related deaths in State prisons, down from 907 in 1996. For every 100,000 State prison inmates in 1997, 48 died of AIDS-related causes. Between 1991 and 1996, about 1 in 3 State prison inmate deaths were attributed to AIDSrelated causes; in 1997 about 1 in 5. Data based on personal interviews from the 1997 Survey of Inmates in State Correctional Facilities show that 75% of State inmates were ever tested for HIV. Of those who were ever tested and reported results, 2.2% were HIV positive — 2.2% of males and 3.4% of females. As level of prior involvement in drug use increased, so did the percentage of HIV-positive inmates: 2.3% of those who said they had ever used drugs, 2.7% of those who used drugs in the month before the current offense, 4.6% of those who injected drugs, and 7.7% of those who ever shared a needle were HIV positive. Highlights Year 1991 1992 1993 1994 1995 1996 1997 HIV-positive State and Federal prison inmates Percent of custody Number population 17,551 2.2% 20,651 2.5 21,475 2.4 22,717 2.4 24,256 2.3 23,881 2.2 23,548 2.1 • Between 1991 and 1997 the number of HIV-positive prisoners grew at a slower rate (34%) than the overall prison population (49%). • At yearend 1997, 3.5% of all female State prison inmates were HIV positive, compared to 2.2% of male State prisoners. HIV-positive prison inmates Percent of custody Number population Jurisdiction New York 7,500 10.8% Florida 2,325 3.6 Texas 2,126 1.5 California 1,328 .9 Federal system 1,030 1.0 New Jersey Georgia Connecticut Maryland 867 861 798 766 3.4 2.4 5.1 3.5 Based on jurisdictions with more than 700 HIV-positive inmates. • New York held about a third of all inmates (7,500 inmates) known to be HIV positive at yearend 1997. • Of all HIV-positive prison inmates, 26% were confirmed AIDS cases. In State prisons 26% of HIV-positive inmates had AIDS; in Federal prisons, 36%. • The overall rate of confirmed AIDS among the Nation's prison population (0.55%) was more than 5 times the rate in the U.S. population (0.10%). • The number of AIDS-related deaths among prison inmates decreased from 907 in 1996 to 538 in 1997. • Of all State prison inmates, 2.8% of black inmates and 2.5% of Hispanic inmates, compared to 1.4% of white inmates reported to survey interviewers that they were HIV positive. All inmates Tested inmates who reported results Percent Number HIV positive 790,128 2.2% Male Female 734,327 55,800 2.2 3.4 White Black Hispanic 257,919 384,870 123,725 1.4% 2.8 2.5 Age 24 or younger 154,181 25-34 310,161 35-44 232,835 45 or older 92,168 .5% 2.3 3.1 2.7 Ever used drugs Used in month before offense 665,977 2.3% 460,685 2.7 From the 1997 Survey of Inmates in State Correctional Facilities. Revised 12/9/99 th Data based on official records and prisoner interviews Table 1. Inmates in custody of State or Federal prison authorities and known to be positive for the human immunodeficiency virus, 1995-97 Jurisdiction Total known to be HIV positive 1995 1996 1997 HIV/AIDS cases as a percent of total custody populationa 1995 1996 1997 U.S. totalb Federal State 24,256 822 23,434 23,881 947 22,934 23,548 1,030 22,518 2.3% 0.9 2.4 2.2% 1.0 2.3 2.1% 1.0 2.2 Northeast Connecticut Maine Massachusetts New Hampshire New Jersey New York Pennsylvania Rhode Island Vermont 12,262 755 4 409 31 847 9,500 590 126 0 11,090 690 4 393 18 705 8,500 652 125 3 10,394 798 -402 17 867 7,500 697 107 6 7.8% 5.1 0.3 3.9 1.5 3.7 13.9 1.8 4.4 0 6.9% 4.6 0.3 3.6 0.9 3.0 12.2 1.9 3.9 0.3 6.4% 5.1 -3.7 0.8 3.4 10.8 2.0 3.2 0.5 Midwest Illinois Indiana Iowa Kansas Michigan Minnesota Missouri Nebraska North Dakota Ohio South Dakota Wisconsin 1,667 583 -20 24 379 46 173 19 2 346 3 72 1,874 634 -24 16 528 24 190 17 3 343 4 91 1,849 655 -34 4 419 31 227 22 7 365 1 84 0.9% 1.5 -0.3 0.3 0.9 1.0 0.9 0.6 0.3 0.8 0.2 0.6 1.0% 1.6 -0.4 0.2 1.2 0.5 0.9 0.5 0.4 0.7 0.2 0.7 0.9% 1.6 -0.5 0.1 0.9 0.6 0.9 0.7 0.9 0.8 0.0 0.6 South Alabama Arkansas Delaware District of Columbia Florida Georgia Kentucky Louisiana Maryland Mississippi North Carolina Oklahoma South Carolina Tennessee Texas Virginia West Virginia 7,870 222 83 122 -2,193 858 41 314 724 138 526 115 380 120 1,890 134 10 8,162 234 77 --2,152 814 55 347 832 135 589 108 422 131 1,876 383 7 8,291 212 86 -75 2,325 861 55 397 766 189 519 107 432 131 2,126 -10 1.9% 1.1 1.0 2.5 -3.4 2.5 0.4 1.8 3.4 1.4 1.9 0.8 2.0 0.9 1.5 0.6 0.4 1.9% 1.1 0.9 --3.4 2.3 0.5 2.0 3.8 1.3 2.0 0.7 2.1 1.0 1.4 1.5 0.3 2.0% 1.0 1.0 -1.1 3.6 2.4 0.5 2.1 3.5 1.8 1.7 0.7 2.1 0.9 1.5 -0.4 West Alaska Arizona California Colorado Hawaii Idaho Montana Nevada New Mexico Oregon Utah Washington Wyoming 1,635 5 140 1,042 93 12 11 4 147 24 29 31 92 5 1,808 10 205 1,136 94 23 17 6 133 11 39 31 99 4 1,984 10 105 1,328 110 16 10 8 139 23 54 60 119 2 0.8% 0.2 0.7 0.8 1.0 0.4 0.4 0.2 1.9 0.6 0.4 0.8 0.8 0.4 0.8% 0.3 0.9 0.8 0.9 0.7 0.5 0.4 1.6 0.2 0.5 0.7 0.8 0.3 0.8% 0.3 0.4 0.9 1.0 0.4 0.3 0.4 1.6 0.6 0.7 1.2 0.9 0.1 --Not reported. a The custody population includes only those inmates housed in a jurisdiction's facilities. b Totals exclude those inmates in jurisdictions that did not report data on HIV/AIDS. Counts may differ from previous reports. Percentages for all years are based on yearend custody counts. 2 HIV in Prisons, 1997 Departments of corrections in 50 States and the District of Columbia as well as the Federal Bureau of Prisons provided data on HIV/AIDS among inmates. Since 1991 respondents have reported their HIV-testing policies and the number of HIVinfected inmates in their custody at yearend. Those inmates are reported to be asymptomatic, symptomatic, or with confirmed AIDS. (See questionnaire items in figure 1, page 10.) Respondents have also reported for each year the number of inmate deaths from HIV-related infections and other causes. Data on HIV/AIDS and demographics for prison inmates were calculated from the 1997 Surveys of Inmates in State and Federal Correctional Facilities. Through personal interviews, inmates held in prisons were questioned about current offenses, prior drug use and treatment, personal characteristics and other aspects of their life. Questions on whether inmates had ever been tested for HIV and the results of the test were included in the interviews. States report a small decrease in the number of HIV-infected inmates during 1997 At yearend 1997, 23,548 inmates in State and Federal prisons were known to be infected with the human immunodeficiency virus (HIV) (table 1). Although the number of reported HIV-positive inmates was down from the total reported at yearend 1996 (23,881), Virginia and Maine (with 383 and 4 cases, respectively, in 1996) did not report data in 1997. The District of Columbia (with 75 cases in 1997) had not reported data in 1996. Based on comparable reporting jurisdictions in both years, the number of HIVpositive inmates decreased slightly in State prisons (down 104) and increased in Federal prisons (up 83). Revised 12/9/99 th From 1991, when BJS began collecting data annually on HIV/AIDS, to 1997, the number of inmates reported to be HIV positive increased at about the same rate as the overall prison population. HIV-positive inmates comprised 2.2% of the State prison population in 1997, down from 2.3% in 1991. Infected inmates were 1.0% of Federal prisoners in 1997, unchanged from 1991. HIV-infected inmates were concentrated in a small number of States. New York and Florida housed the largest number of HIV-positive inmates (7,500 and 2,325, respectively). In 1997 these two States housed more than 40% of all HIV-infected inmates in State prisons. Year 1991 1992 1993 1994 1995 1996 1997 Percent of custody population known to be HIV positive State Federal 2.3% 1.0% 2.6 1.2 2.6 1.2 2.5 1.1 2.4 0.9 2.3 1.0 2.2 1.0 Northeast prisons held the largest number of HIV-infected inmates Nearly half the State prison inmates known to be HIV positive were in the Northeast. Within the Northeast, 6.4% of the prison population were HIV positive, followed by 2.0% in the South, 0.9% in the Midwest, and 0.8% in the West. New York had the highest percentage of inmates known to be HIV positive (10.8%), followed by Connecticut (5.1%) and Massachusetts (3.7%). Nine States (Alaska, Idaho, Kansas, Montana, North Dakota, South Dakota, Vermont, West Virginia, and Wyoming) reported 10 or fewer cases of HIV-positive inmates in their prisons. Of the 46 States that reported information in 1997, each reported having at least one HIV-positive inmate. Nine States reported that fewer than 0.5% of their inmate population were HIV positive. Table 2. Inmates in custody of State or Federal prison authorities, by type of HIV infection or confirmed AIDS, yearend 1997 Jurisdiction U.S. total Federal State Cases of HIV or confirmed AIDS Symptom- Confirmed AsympTotala aticc AIDS tomaticb 23,548 13,532 2,971 6,184 1,030 662 -368 22,518 12,870 2,971 5,816 Confirmed AIDS cases as a percent of Total HIV Custody cases population 26.3% 0.5% 35.7 0.4 25.8 0.6 10,394 798 -402 17 867 7,500 697 107 6 7,053 171 -51 3 565 5,926 323 11 3 1,122 425 -214 7 -273 153 50 0 2,219 202 -137 7 302 1,301 221 46 3 21.3% 25.3 -34.1 41.2 34.8 17.3 31.7 43.0 ** 1.4% 1.3 -1.3 0.3 1.2 1.9 0.6 1.4 0.2 Midwest Illinois Indiana Iowa Kansas Michigan Minnesota Missouri Nebraska North Dakota Ohio South Dakota Wisconsin 1,849 655 -34 4 419 31 227 22 7 365 1 84 910 418 -26 3 216 26 -18 0 155 0 48 365 36 ----0 190 1 6 119 0 13 574 201 -8 1 203 5 37 3 1 91 1 23 31.0% 30.7 -23.5 ** 48.4 16.1 16.3 13.6 ** 24.9 ** 27.4 0.3% 0.5 -0.1 ‡ 0.5 0.1 0.2 0.1 0.1 0.2 ‡ 0.2 South Alabama Arkansas Delaware District of Columbia Florida Georgia Kentucky Louisiana Maryland Mississippi North Carolina Oklahoma South Carolina Tennessee Texas Virginia West Virginia 8,291 212 86 -75 2,325 861 55 397 766 189 519 107 432 131 2,126 -10 3,669 58 46 --1,499 -27 -272 151 349 103 64 -1,092 -8 1,147 103 26 ----17 290 220 ---197 89 205 -0 2,614 51 14 -75 826 -11 107 274 38 170 4 171 42 829 -2 31.5% 24.1 16.3 -100.0 35.5 -20.0 27.0 35.8 20.1 32.8 3.7 39.6 32.1 39.0 -** 0.6% 0.2 0.2 -1.1 1.3 -0.1 0.6 1.3 0.4 0.5 ‡ 0.8 0.3 0.6 -0.1 West Alaska Arizona California Colorado Hawaii Idaho Montana Nevada New Mexico Oregon Utah Washington Wyoming 1,984 10 105 1,328 110 16 10 8 139 23 54 60 119 2 1,238 0 59 974 37 3 5 1 67 20 33 10 27 2 337 10 -197 42 9 2 0 29 0 14 34 -0 409 0 46 157 31 4 3 7 43 3 7 16 92 0 20.6% ** 43.8 11.8 28.2 25.0 ** ** 30.9 13.0 13.0 26.7 77.3 ** 0.2% 0 ‡ 0.1 0.3 0.1 0.1 0.4 0.5 0.1 0.1 0.3 0.7 0 Northeast Connecticut Maine Massachusetts New Hampshire New Jersey New York Pennsylvania Rhode Island Vermont Note: Totals and percentages exclude inmates in jurisdictions that did not report data on type of HIV/AIDS infection. The custody population includes only inmates housed at the end of 1997. --Not reported. **Not calculated for 10 or fewer cases. ‡ Less than .05%. a Georgia reported the total of HIV-positive cases but not the type of HIV infection. b Includes all inmates who had tested positive for the HIV antibody but had no HIV-related symptoms. c Includes inmates with symptoms of HIV infection but without a confirmed AIDS diagnosis. HIV in Prisons, 1997 3 Revised 12/9/99 th Between 1996 and 1997, 15 States reported a decreased number of HIV-positive inmates. The largest decrease (1,000 cases) was reported in New York — 7,500 in 1997, down from 8,500 in 1996. Michigan (down 109), Arizona (down 100), North Carolina (down 70), and Maryland (down 66) also reported large decreases. Twenty-eight States reported an increased number of HIV cases. Texas reported the largest increase (up 250) during 1997, followed by California (up 192) and Florida (up 173). Confirmed AIDS cases in prison more than tripled from 1991 to 1997 At the end of 1997, 6,184 inmates had confirmed AIDS: 5,816 were State inmates and 368 were Federal inmates (table 2). Of the remaining HIV-positive inmates, 2,971 showed symptoms of AIDS (symptomatic), while 13,532 were HIV positive but showed no symptoms of AIDS (asymptomatic). Confirmed AIDS cases made up 0.5% of all inmates in State and Federal prisons. Of those known to be HIV-positive inmates, over a quarter had confirmed AIDS. HIV-positive State and Federal inmates Other than Confirmed confirmed Year AIDS cases AIDS cases 1991 1,682 15,797 1992 2,644 18,087 1993 3,765 17,773 1994 4,849 17,864 1995 5,099 18,165 1996 5,874 16,656 1997 6,184 16,503 Note: Care should be exercised when comparing the number of reported cases over time. In January 1993 the Centers for Disease Control and Prevention revised the HIV classification system and expanded the surveillance case definition for AIDS to include specific CD4+ T-lymphocyte criteria and three additional clinical conditions & pulmonary tuberculosis, recurrent pneumonia, and invasive cervical cancer. This expansion resulted in a substantial increase in the number of reported AIDS cases during 1993. See Methodology. 4 HIV in Prisons, 1997 During 1997 the number of confirmed AIDS cases increased by 310. Overall, after 1991 the number of confirmed AIDS cases increased 4,502 — an annual average increase of 24.2%. While the number of confirmed AIDS cases increased, the number of inmates with lesser or no symptoms of HIV infection decreased from 18,165 in 1995 to 16,503 in 1997. The States with the largest number of confirmed AIDS cases were New York (1,301), Texas (829), and Florida (826). Combined, these States made up 51% of all confirmed AIDS cases in State prisons. Seventeen States reported having fewer than 10 confirmed AIDS cases in their prison. The highest percentage of the State prison population having confirmed AIDS was in New York (1.9%), followed by Rhode Island (1.4%), Connecticut (1.3%), Florida (1.3%), and Maryland (1.3%). In 17 States, confirmed AIDS cases comprised 0.1% or less of State inmates. The rate of AIDS in prison at least 5 times the rate in the general population At the end of 1997, the rate of confirmed AIDS in State and Federal prisons was 5½ times higher than in the total U.S. population. About 55 per 10,000 prison inmates had confirmed AIDS, compared to 10 per 10,000 persons in the U.S. population. Percent of population with confirmed AIDS U.S. Inmates in general State and population Federal prisons Year 1991 0.03% 0.21% 1992 0.03 0.33 1993 0.06 0.50 1994 0.07 0.52 1995 0.08 0.51 1996 0.09 0.54 1997 0.10 0.55 Note: The percent of the general population with confirmed AIDS in each year may be overestimated due to delays in death reports. Care should be exercised when comparing percentages over time, because of changes in the case definition for AIDS. See Methodology. In every year since 1991, the rate of confirmed AIDS has been higher among prison inmates than in the general population. In 1992 the rate of AIDS was 10 times higher for prisoners than the general population. In 1993, following a revision of the HIV classification system and an expansion of the case definition for AIDS, the rate of confirmed AIDS increased 1½ times among prisoners and doubled in the general population. After the adoption of these new measures, the incidence of AIDS grew somewhat faster in the general population. Revised 12/9/99 th Table 3. State prison inmates known to be positive for the human immunodeficiency virus, by gender, yearend 1997 Male HIV cases Jurisdiction Total Number 20,153 Percent of population 2.2% 6.0 4.6 -3.4 0.8 3.3 10.3 1.9 3.1 0.4 Female HIV cases Number 2,185 1,072 139 -58 2 71 745 44 12 1 Percent of population 3.5% Northeast Connecticut Maine Massachusetts New Hampshire New Jersey New York Pennsylvania Rhode Island Vermont 9,322 659 -344 15 796 6,755 653 95 5 12.7 13.1 -8.2 1.5 5.5 20.7 3.1 6.1 1.9 Midwest Illinois Indiana Iowa Kansas Michigan Minnesota Missouri Nebraska North Dakota Ohio South Dakota Wisconsin 1,708 591 -27 4 398 31 212 20 5 340 1 79 0.9% 1.5 -0.4 0.1 0.9 0.6 0.9 0.6 0.7 0.8 0 0.6 141 64 -7 0 21 0 15 2 2 25 0 5 1.2% 2.6 -1.3 0 1.0 0 0.9 0.9 3.0 0.9 0 0.7 South Alabama Arkansas Delaware District of Columbia Florida Georgia Kentucky Louisiana Maryland Mississippi North Carolina Oklahoma South Carolina Tennessee Texas Virginia West Virginia 7,385 197 81 --2,082 765 50 372 682 171 455 97 409 127 1,887 -10 1.9% 1.0 1.0 --3.4 2.2 0.5 2.1 3.3 1.8 1.6 0.7 2.1 0.9 1.5 -0.4 831 15 5 --243 96 5 25 84 18 64 10 23 4 239 -0 3.1% 1.1 0.8 --7.1 4.2 0.8 2.7 7.6 2.0 3.6 0.8 1.8 0.7 2.3 -0 West Alaska Arizona California Colorado Hawaii Idaho Montana Nevada New Mexico Oregon Utah Washington Wyoming 1,738 6 -1,248 102 16 10 7 108 22 51 57 109 2 0.9% 0.2 -0.9 1.0 0.4 0.3 0.4 1.4 0.7 0.7 1.2 0.9 0.2 141 4 -80 8 0 0 1 31 1 3 3 10 0 0.9% 1.9 -0.7 1.0 0 0 1.2 4.9 0.3 0.7 1.1 1.1 0 A greater percent of females than males reported HIV infection At yearend 1997, 20,153 male inmates and 2,185 female inmates were known to be HIV positive (table 3). Those known to be HIV positive were 2.2% of male inmates and 3.5% of female inmates. In most States and in all regions except the West, female inmates had a higher HIV-positive infection rate than male inmates. Year Males 1991 1992 1993 1994 1995 1996 1997 Annual average change, 1991-97* State prison inmates Percent HIVpositive in Number of custody populaHIV-positive tion of reporting inmates States 16,150 18,266 18,218 19,762 20,690 21,046 20,153 2.2% 2.6 2.5 2.4 2.3 2.2 2.2 3.8% Females 1991 1,159 3.0% 1992 1,598 4.0 1993 1,796 4.2 1994 1,953 3.9 1995 2,182 4.0 1996 1,888 3.1 1997 2,185 3.5 Annual average change, 11.1% 1991-97* *In 1991 North Carolina, South Dakota, and the District of Columbia did not report data by gender. In 1997 Maine, Delaware, Indiana, Virginia, Arizona, and the District of Columbia did not report data by gender. --Not reported. HIV in Prisons, 1997 5 Revised 12/9/99 th Following a decrease in 1996, the number of HIV-infected females increased during 1997 (from 1,888 to 2,185). The number of infected male inmates decreased 4.2% (from 21,046 in 1996 to 20,153 in 1997). On average, from 1991 to 1997 the number of male inmates in State prison infected with HIV increased 3.8%; the number of female infected inmates increased 11.1%. States in the Northeast reported the largest number of HIV-positive male and female inmates (9,322 and 1,072, respectively). In seven States, more than 5% of all female inmates were known to be HIV positive. In New York (20.7%) and Connecticut (13.1%) over 10% of female inmates were known to be HIV-positive. New York (10.3%) was the only State in which more than 10% of all male inmates were HIV-positive. New York also reported the largest number of male and female HIV-positive inmates (6,755 and 745, respectively). The second largest numbers of HIV-positive male and female inmates were in Florida (2,082 and 243, respectively), followed by Texas (1,887 and 239, respectively). Seven States reported no female HIV-positive inmates. Every State reported at least one male inmate as HIV positive. Table 4. Number of inmate deaths in State prisons, by cause, 1995-97 Cause of death Total Natural causes other than AIDS AIDS Suicide Accident Execution By another person Other/unspecified 1995 Rate of death per 100,000 Number inmates 3,133 311 1,569 1,010 160 48 56 86 204 156 100 16 5 6 9 20 1996 Rate of death per 100,000 Number inmates 3,095 308 1,715 907 154 43 45 65 166 170 90 15 4 4 6 16 1997 Rate of death per 100,000 Number inmates 2,872 255 1,859 538 159 37 74 75 130 165 48 14 3 7 7 12 Note: To calculate the rate of death, the number of inmates under State jurisdiction on June 30 of each year was used as an approximation of the average population exposed to the risk of death during the year. 6 HIV in Prisons, 1997 AIDS-related deaths in State prisons dropped 41% during 1997 The number of State inmates who died of Pneumocystis carinii pneumonia, Kaposis’s sarcoma, or other AIDS-related diseases decreased from 907 in 1996 to 538 in 1997 (table 4). These AIDS deaths accounted for 19% of all deaths among State prisoners, down from 29% in 1996. Even with a sharp decline, AIDS-related illnesses were still the second leading cause of death in State prisons behind natural causes other than AIDS. In 1997 for every 100,000 inmates, 48 died from AIDS-related causes (table 5). Between 1995 and 1997, the number of AIDS-related deaths in State prisons decreased 47%. This decrease may reflect improvement in the effectiveness of HIV/AIDS care, following the introduction of protease inhibitors and combination antiretroviral therapies. Revised 12/9/99 th AIDS death rate in State prison at least 3 times the rate in the general population In 1997 the rate of death because of AIDS was over 3 times higher in the prison population than in the total U.S. population age 15-54. About 19% of prisoner deaths were attributable to AIDS-related causes; compared to 6% of deaths in the general population. AIDS-related deaths as a percent of all deaths U.S. general State population age prison Year 15-54* inmates 1991 10.4% 28.0% 1992 11.7 35.2 1993 11.9 33.2 1994 12.7 35.1 1995 13.1 34.2 1996 10.1 29.3 1997 5.8 18.7 *See Methodology for source of data. AIDS-related deaths accounted for more than a third of all inmate deaths in Florida (45%), New Jersey (41%), Connecticut (39%), and South Carolina (35%) (table 5). Prison officials in the South reported the most AIDS-related deaths (309); Florida accounted for 108 of those deaths. Nineteen States reported having no AIDS-related deaths, and 7 States reported 1 AIDSrelated death. Table 5. AIDS-related deaths of sentenced prisoners under State jurisdiction, 1997 Jurisdiction Total Deaths from all causes in State prisons Rate per Total 100,000 inmatesa 2,872 255 Total 538 AIDS-related deaths As a percent of Rate per 100,000 inmatesa all deathsb 48 18.7% Northeast Connecticut Maine Massachusetts New Hampshire New Jersey New York Pennsylvania Rhode Island Vermont 501 33 1 24 5 101 221 109 6 1 295 191 62 201 231 356 320 312 178 79 136 13 0 2 0 41 60 19 1 0 80 75 0 17 0 145 87 54 30 0 Midwest Illinois Indiana Iowa Kansas Michigan Minnesota Missouri Nebraska North Dakota Ohio South Dakota Wisconsin 488 101 45 9 24 99 6 48 10 1 117 6 22 223 248 251 130 303 221 113 200 294 125 244 268 135 50 16 1 0 1 18 1 6 0 0 6 0 1 23 39 6 0 13 40 19 25 0 0 12 0 6 10.2% 15.8 2.2 ** 4.2 18.2 ** 12.5 ** ** 5.1 ** 4.5 1,415 South Alabama 91 Arkansas 31 Delaware 12 District of Columbia 25 Florida 242 Georgia 114 Kentucky 28 Louisiana 80 Maryland 54 Mississippi 47 North Carolina 56 Oklahoma 68 South Carolina 55 Tennessee 70 Texas 341 Virginia 92 West Virginia 9 288 408 309 221 267 374 312 192 273 243 329 177 331 260 420 243 324 286 309 14 0 0 -108 41 0 17 12 4 8 3 19 13 56 14 0 64 63 0 0 -167 112 0 58 54 28 25 15 90 78 40 49 0 21.8% 15.4 0 0 -44.6 36.0 0 21.3 22.2 8.5 14.3 4.4 34.5 18.6 16.4 15.2 ** 468 4 61 268 34 8 10 4 25 7 19 3 23 2 188 96 260 172 253 161 256 159 277 149 238 70 174 129 43 0 0 36 0 1 2 0 3 0 0 0 1 0 17 0 0 23 0 20 51 0 33 0 0 0 8 0 9.2% ** 0 13.4 0 ** 20.0 ** 12.0 ** 0 ** 4.3 ** West Alaska Arizona California Colorado Hawaii Idaho Montana Nevada New Mexico Oregon Utah Washington Wyoming 27.1 39.4 ** 8.3 ** 40.6 27.1 17.4 ** ** --Not reported. **Not calculated for 10 or fewer deaths. a Based on the number of inmates under State jurisdiction on June 30, 1997, with a sentence of more than 1 year. b National and regional totals exclude inmates in jurisdictions that did not report data on cause of death. HIV in Prisons, 1997 7 Revised 12/9/99 th Eighteen States tested all inmates for HIV either at admission or while in prison Prison officials report data on HIV and AIDS in the National Prisoner Statistics series (NPS-1). The quality of the reporting may vary by the nature and extent of testing in each jurisdiction. Testing policies range from testing all inmates to testing only upon inmate request. In 1997 all States, the District of Columbia, and the Federal Bureau of Prisons tested their inmates for HIV based on certain criteria (table 6). Most jurisdictions (44 out of 52) tested inmates if they had HIV-related symptoms or if the inmates requested a test. Twenty-nine States tested inmates after they were involved in an incident, and 15 States tested inmates who belonged to specific “high-risk groups.” Of the 18 States that tested all entering inmates, 4 States (Alabama, Missouri, Nevada, and Virginia) and the Federal Bureau of Prisons tested inmates at release. Arkansas, Rhode Island, and Virginia tested all inmates currently in custody. New York was the only State that tested inmates selected at random. Testing policy Upon inmate request Upon clinical indication of need Upon involvement in an incident All incoming inmates High-risk groups All inmates at time of release All inmates currently in custody Random sample Number of jurisdictions 40 37 29 18 15 5 3 1 Note: Detail adds to more than 52 because a jurisdiction may have more than one testing policy. Table 6. Prison system testing policies for the antibody to the human immunodeficiency virus, by jurisdiction, 1997 Federal* Northeast Connecticut Maine Massachusetts New Hampshire New Jersey New York Pennsylvania Rhode Island Vermont Midwest Illinois Indiana Iowa Kansas Michigan Minnesota Missouri Nebraska North Dakota Ohio South Dakota Wisconsin South Alabama Arkansas Delaware District of Columbia Florida Georgia Kentucky Louisiana Maryland Mississippi North Carolina Oklahoma South Carolina Tennessee Texas Virginia West Virginia West Alaska Arizona California Colorado Hawaii Idaho Montana Nevada New Mexico Oregon Utah Washington Wyoming All inmates High At In risk Entering custody release group X X Upon Clinical Involveinmate indica- ment in request tion incident X X X X X X X X X X X X X X X X X X X X X X X X X X X X X X X X X X X X X X X X X X X X X X X X X X X X X X X X X X X X X X X X X X X X X X X X X X X X X X X X X X X X X X X X X X X X X X X X X X X X X X X X X X X X X X X X X X X X X X X X X X X X X X X X X X X X X X X X X X X X X X X X X X X X X X X X *The Bureau of Prisons tests a random sample of inmates on alternate years. 8 HIV in Prisons, 1997 Random sample Other X Revised 12/9/99 th Among State prisoners who were In Federal prisons 0.6% of males and tested for HIV, female inmates (3.4%) of females reported an HIV infection. were more likely than male inmates HIV-positive rates were lowest for white Data based on reports from correc(2.2%) to be HIV positive (table 8). non-Hispanic inmates (0.3%). tional authorities are limited in detail Black non-Hispanic inmates (2.8%) In both State and Federal prisons, and may understate the number of were twice as likely as white inmates age 17-24 had the lowest inmates infected with HIV. Additional non-Hispanic inmates (1.4%) to report rates (0.5% and 0.1%, respectively). In information may be obtained through being HIV positive. Among male State prisons, inmates age 35-44 had personal interviews of prisoners. inmates, black non-Hispanics (2.7%) the highest HIV-positive rate (3.1%). Though some inmates may be relucwere nearly twice as likely as white Those inmates age 25 or older were tant to report that they are HIV positive non-Hispanics (1.4%) to be HIV more likely to be HIV positive than and others may not know, surveys positive. Because of the small number those who were 24 or younger. provide a means to track HIV infection of inmates interviewed, the rates of HIV In Federal prisons, inmates age 45 or among demographic and “high-risk” infection among female inmates were older had the highest rate of HIV infecgroups not identified in official records. not significantly different between white tion (1.2%). non-Hispanics (2.3%), black nonThe 1997 Surveys of State and Federal Hispanics (3.9%), and Hispanics Correctional Facilities asked inmates if (4.2%). they had ever been tested, if they had Table 8. Inmates ever tested for the human immunodeficiency virus and results, been tested since admission, and by selected characteristics, 1997 whether they were HIV positive. (See Methodology for further detail.) HIV/AIDS reported in personal interviews Tested inmates who reported results Rate of HIV infection higher among State inmates than Federal inmates Of inmates who reported being tested since admission, 2.6% in State prison and 0.7% in Federal prison reported being HIV positive (table 7). Table 7. Inmates ever tested or tested since admission for the human immunodeficiency virus and test results, 1997 Inmate characteristic Percent of tested inmates who reported results State Federal prisons prisons Ever tested HIV positive 74.6% 2.2 79.6% 0.6 Tested since admission 59.1% HIV positive 2.6 69.7% 0.7 Note: Data are from the 1997 Surveys of Inmates in State and Federal Correctional Facilities. Characteristic State prisons Percent Number HIV positive Federal prisons Percent HIV Number positive 790,128 2.2% 70,902 0.6% Gender Male Female 734,327 55,800 2.2% 3.4 65,723 5,179 0.6% 0.6 Race/Hispanic origin White non-Hispanic Male Female Black non-Hispanic Male Female Hispanic Male Female 257,919 239,687 18,232 384,870 357,736 27,135 123,725 115,344 8,382 1.4% 1.4 2.3 2.8 2.7 3.9 2.5 2.4 4.2 21,128 19,565 1,563 28,178 26,387 1,791 18,466 16,892 1,573 0.3% 0.3 0.3 0.8 0.8 1.3 0.7 0.7 0 Age 17-24 25-34 35-44 45 or older 154,181 310,161 232,835 92,168 0.5% 2.3 3.1 2.7 5,528 26,262 22,228 16,884 0.1% 0.5 0.4 1.2 Marital status Married Widowed/divorced Separated Never married 128,834 161,468 45,435 453,664 1.7% 2.0 2.9 2.4 21,545 16,331 3,884 29,045 0.5% 0.4 0 0.8 Education Less than high school GED High school or more 302,437 231,714 254,975 2.7% 1.4 2.4 17,226 16,389 37,237 0.8% 0.6 0.5 All inmates Note: Data are from the 1997 Surveys of Inmates in State and Federal Correctional Facilities. HIV in Prisons, 1997 9 Revised 12/9/99 th Among State prisoners drug offenders reported a higher prevalence of HIV infection Table 9. Inmates ever tested for the human immunodeficiency virus and results, by offense and prior drug use, 1997 Tested inmates who reported results Those inmates held on a drug offense in State prisons had the highest HIVpositive rate (2.9%) (table 9). Of property offenders, 2.4% reported being HIV positive. Rates were slightly lower for violent and publicorder offenders (1.9% each). Of Federal prison inmates, 1.0% of violent offenders, property offenders, and public-order offenders reported being HIV positive. The percentage of State and Federal prison inmates reporting that they were HIV positive varied by level of prior drug use. Of State prison inmates who reported never using drugs, 1.7% were HIV positive. An estimated 2.3% of inmates who had ever used drugs, 2.7% of those who used drugs in the month before their current offense, 4.6% of those who had used a needle to inject drugs, and 7.7% of those who had shared a needle reported being HIV positive. Like State inmates, Federal inmates who used a needle and shared a needle had a higher rate of HIV infection than those inmates who reported ever using drugs or using drugs in the month before their current offense (1.3% and 2.1% compared to 0.7% and 0.3%). Methodology Data are based on yearly reports from prison officials in the departments of corrections of the 50 States and the District of Columbia and in the Federal Bureau of Prisons. The National Prisoner Statistics series (NPS-1) includes an annual yearend count of prisoners by jurisdiction, gender, race, Hispanic origin, and admissions and releases during the year. Characteristic Current offense Violent Property Drug Public-order Prior drug use Never Ever In the month before offense Used needle to inject drugs Ever shared a needle State prisons Percent Number HIV positive Number Federal prisons Percent HIV positive 360,370 178,601 164,256 77,049 1.9% 2.4 2.9 1.9 10,681 4,660 43,815 10,029 1.0% 1.0 0.4 1.0 123,049 665,977 1.7% 2.3 18,917 51,847 0.3% 0.7 460,685 2.7 32,113 0.3 168,446 74,393 4.6 7.7 9,443 4,022 1.3 2.1 Note: Data are from the 1997 Surveys of Inmates in State and Federal Correctional Facilities. Key items on HIV/AIDS from National Prisoner Statistics HIV testing, Jan. 1 - Dec. 31, 1997 During 1997 were any inmates tested for the antibody to the Human Immunodeficiency Virus (HIV) that causes AIDS? ‰ Yes ‰ No Which inmates were tested during 1997? Mark (X) all that apply. ‰ All incoming inmates ‰ All inmates currently in custody ‰ All inmates at time of release ‰ Certain inmates (Complete next item) Who were the certain inmates tested? Mark (X) all that apply. ‰ High-risk groups - Specify ‰ Upon inmate request ‰ Upon clinical indication of need ‰ Upon involvement in incident ‰ Random sample ‰ Other - Specify HIV infection/AIDS cases in custody on Dec. 31, 1997 Inmates who were asymptomatic HIV positive Total _____ Male _____ Female _____ Inmates with lesser forms of symptomatic HIV disease Total _____ Male _____ Female _____ Inmates with confirmed AIDS Total _____ Male _____ Female _____ Total number of inmates who were HIV positive or confirmed AIDS cases Total _____ Male _____ Female _____ 10 HIV in Prisons, 1997 Revised 12/9/99 th Since 1991 respondents have been asked to indicate their policies for testing for HIV and to provide the number of HIV-infected inmates in their custody on the last day of the calendar year. To obtain more detailed information on inmates, this report also used data from the 1997 Surveys of Inmates in State and Federal Correctional Facilities. Detailed descriptions of the methodology and sample design of each survey can be found in the following: Substance Abuse and Treatment of State and Federal Prisoners, 1997 (NCJ 172871). Accuracy of the survey estimates The accuracy of the estimates from the 1997 Surveys of Inmates in State and Federal Correctional Facilities depends on two types of error: sampling and nonsampling. Sampling error is variation that may occur by chance because a sample rather than a complete enumeration of the population was conducted. Nonsampling error can be attributed to many sources, such as nonresponse, differences in the interpretation of questions among inmates, recall difficulties, and processing errors. In any survey the full extent of the nonsampling error is never known. HIV positive have been calculated (see appendix table). These standard errors may be used to construct confidence intervals around percentages. For example, the 95-percent confidence interval around the percentage of males in State prisons who were HIV positive is approximately 2.2% plus or minus 1.96 times 0.20 (or 1.8% to 2.6%). Appendix table. Standard error estimates for Surveys of State and Federal Correctional Facilities, 1997 Estimated standard error of the percent of reporting inmates who were HIV positive State Federal prisons prisons Characteristic Gender Male Female 0.20 0.44 0.19 0.35 These standard errors may also be used to test the statistical significance of the difference between two sample estimates by pooling the standard errors of the estimates (that is, by taking the square root of the sum of the squared standard errors for each sample estimate). All comparisons discussed in this report were statistically significant at the 95-percent confidence level. Race/Hispanic origin White non-Hispanic Male Female Black non-Hispanic Male Female Hispanic Male Female 0.29 0.31 0.80 0.37 0.38 0.72 0.58 0.61 1.67 0.31 0.33 0.63 0.48 0.51 1.15 0.52 0.56 0.00 Age Under 24 25-34 35-44 45 or older 0.20 0.30 0.40 0.60 0.27 0.27 0.26 0.52 AIDS in the U.S. resident population Marital status Married Widowed/divorced Separated Never married 0.40 0.39 0.88 0.25 0.30 0.31 0.00 0.33 0.33 0.27 0.42 0.38 0.34 0.23 0.25 0.40 0.46 0.55 0.60 0.91 0.19 0.62 0.41 0.21 0.25 0.23 0.27 0.19 0.57 1.09 0.73 1.41 The number of persons with confirmed AIDS in the U.S. general population (age 13 and over) was derived from the Centers for Disease Control and Prevention (CDC), HIV/AIDS Surveillance Report, yearend editions 1991-97. For each year the number of active AIDS cases in the United States was calculated by subtracting the number of cumulative AIDS deaths for people age 15 or older at yearend from The sampling error, as measured by an the cumulative number of total AIDS estimated standard error, varies by the cases for people age 13 or older at size of the estimate and the size of the yearend as listed in the HIV/AIDS Surveillance Report. base population. Estimates for the percentage of inmates ever tested for The data for the U.S. general populaHIV and the percentage who tested tion, excluding persons under age 13 from 1991 to 1997 were taken from the Further reading U.S. Population Estimates, by Age, Sex, Race, and Hispanic Origin: 1990 More information about HIV among to 1995, PPL-41, and update for 1996 jail inmates as well as about State and 1997. and Federal prison programs can be found in Theodore M. Hammett, The rate of confirmed AIDS cases in Patricia Harmon, and Laura M. the U.S. resident population was calcuMaruschak, 1996-1997 Update: lated by dividing the annual totals for HIV/AIDS, STDs, and TB in Correcindividuals with AIDS by the population tional Facilities, National Institute of estimates for the U.S. resident populaJustice report, NCJ 176344, July tion of individuals 13 or older. The 1999. Obtain the report on the Interclassification system for HIV infection net at http://www.ojp.usdoj.gov/ and the case definition for AIDS were nij/pubs-sum/176344.htm expanded in 1993. This expansion Education Less than high school GED High school graduate or more Current offense Violent Property Drug Public-order Prior drug use Never used Ever used Used month before offense Used needle to inject drugs Shared a needle improved estimates of the number and the characteristics of persons with HIV disease, but complicated interpretation of AIDS trends. The increase in reported AIDS cases in 1993 was largely the consequence of the added surveillance criteria. (See CDC, Morbidity and Mortality Weekly Report, Vol. 43, No. 45, November 18,1994.) HIV in Prisons, 1997 11 Revised 12/9/99 th AIDS-related deaths in the United States The number of AIDS-related deaths for persons age 15-54 was derived from the CDC, HIV/AIDS Surveillance Report, yearend editions. Deaths in the U.S. population for persons age 15-54 were taken from the CDC, Monthly Vital Statistics Report, Vol. 42, No. 2(S); Vol. 43, No. 12; Vol. 43, No. 6(S); Vol. 45, No. 3(S); and Vol. 45, No. 11(S); and from the CDC, National Vital Statistics Report, Vol. 47, No. 9, and Vol. 47, No. 25. AIDS-related deaths as a percentage of all deaths in the U.S. population were calculated by dividing the national estimate of AIDS deaths of persons age 15-54 by the national mortality estimates of persons age 15-54 in a given year. U.S. Department of Justice Office of Justice Programs Bureau of Justice Statistics Washington, DC 20531 Official Business Penalty for Private Use $300 12 HIV in Prisons, 1997 The Bureau of Justice Statistics is the statistical agency of the U.S. Department of Justice. Jan M. Chaiken, Ph.D., is director. This report and others from the Bureau of Justice Statistics are available through the Internet http://www.ojp.usdoj.gov/bjs/ BJS Bulletins present the first release of findings from permanent data collection programs such as the National Prisoner Statistics. Laura Maruschak wrote this report, under the supervision of Allen J. Beck. Lauren E. Glaze and Christopher J. Mumola provided statistical review. Tom Hester and Tina Dorsey edited the report. Jayne Robinson, assisted by Yvonne Boston, prepared the report for publication. The data from the 1997 Surveys of Inmates in State and Federal Correctional Facilities is available from the National Archive of Criminal Justice Data, maintained by the Institute for Social Research at the University of Michigan, 1-800-9990960. The archive may also be accessed through the BJS Internet site. November 1999, NCJ 178284 PRESORTED STANDARD POSTAGE & FEES PAID DOJ/BJS Permit No. G-91