
Rape and Sexual Assault - Reporting to Police and Medical Attention, 1992-2000, DOJ BJS, 2002
Download original document:
Document text
Document text
This text is machine-read, and may contain errors. Check the original document to verify accuracy.
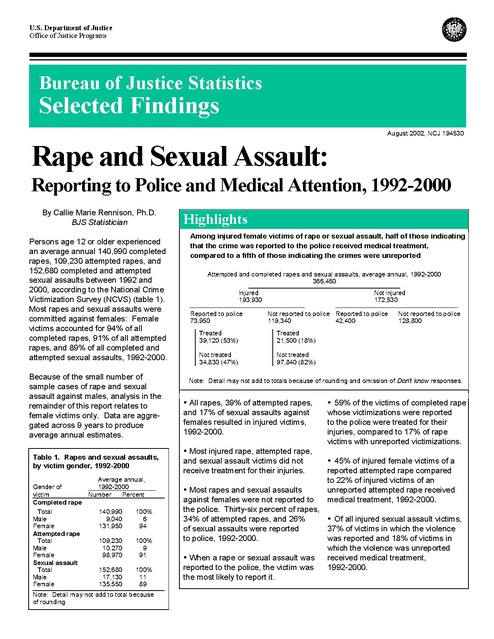
U.S. Department of Justice
Office of Justice Programs

Bureau of Justice Statistics

Selected Findings

August 2002, NCJ 194530

Rape and Sexual Assault:
Reporting to Police and Medical Attention, 1992-2000
By Callie Marie Rennison, Ph.D.
BJS Statistician
Persons age 12 or older experienced
an average annual 140,990 completed
rapes, 109,230 attempted rapes, and
152,680 completed and attempted
sexual assaults between 1992 and
2000, according to the National Crime
Victimization Survey (NCVS) (table 1).
Most rapes and sexual assaults were
committed against females: Female
victims accounted for 94% of all
completed rapes, 91% of all attempted
rapes, and 89% of all completed and
attempted sexual assaults, 1992-2000.
Because of the small number of
sample cases of rape and sexual
assault against males, analysis in the
remainder of this report relates to
female victims only. Data are aggregated across 9 years to produce
average annual estimates.

Highlights
Among injured female victims of rape or sexual assault, half of those indicating
that the crime was reported to the police received medical treatment,
compared to a fifth of those indicating the crimes were unreported
Attempted and completed rapes and sexual assaults, average annual, 1992-2000
366,460
_________________________________________________

Injured
Not injured
193,930
172,530
________________________________
__________________________________
Reported to police
Not reported to police Reported to police
Not reported to police
73,950
119,340
42,400
128,800
Treated
39,120 (53%)

Treated
21,500 (18%)

Not treated
34,830 (47%)

Not treated
97,840 (82%)

Note: Detail may not add to totals because of rounding and omission of Don't know responses.

! All rapes, 39% of attempted rapes,
and 17% of sexual assaults against
females resulted in injured victims,
1992-2000.

! 59% of the victims of completed rape
whose victimizations were reported
to the police were treated for their
injuries, compared to 17% of rape
victims with unreported victimizations.

Table 1. Rapes and sexual assaults,
by victim gender, 1992-2000

! Most injured rape, attempted rape,
and sexual assault victims did not
receive treatment for their injuries.

Average annual,
Gender of
1992-2000
victim
Number
Percent
Completed rape
Total
140,990
100%
Male
9,040
6
Female
131,950
94
Attempted rape
Total
109,230
100%
Male
10,270
9
Female
98,970
91
Sexual assault
Total
152,680
100%
Male
17,130
11
Female
135,550
89

! Most rapes and sexual assaults
against females were not reported to
the police. Thirty-six percent of rapes,
! Of all injured sexual assault victims,
34% of attempted rapes, and 26%
37% of victims in which the violence
of sexual assaults were reported
was reported and 18% of victims in
to police, 1992-2000.
which the violence was unreported
received medical treatment,
! When a rape or sexual assault was
1992-2000.
reported to the police, the victim was
the most likely to report it.

Note: Detail may not add to total because
of rounding.

! 45% of injured female victims of a
reported attempted rape compared
to 22% of injured victims of an
unreported attempted rape received
medical treatment, 1992-2000.

Injuries
All victims of completed rape are
considered to have been injured, by
NCVS definition. Thirty-eight percent
of female rape victims sustained an
injury in addition to the rape. Thirtynine percent of attempted rape victims
and 17% of sexual assault victims were
injured during their victimization, 19922000 (table 2). Nonfatal injuries from
any crime range from bruises and
chipped teeth (minor) to broken bones
and gunshot wounds (serious). (See
Injuries from Violent Crime, 1992-98,
NCJ 168633.)
Among completed rape victims, 33%
had additional minor injuries, and 5%
suffered additional serious injuries.
Two-thirds of attempted rape victims
suffered minor injuries. Three percent
of injured victims were seriously injured
during an attempted rape. Fifty-four
percent of injured sexual assault
victims reported receiving minor
injuries, and 5% were seriously injured.
Reporting to police
Most rapes and sexual assaults were
not reported to the police (table 3).
Sixty-three percent of completed rapes,
65% of attempted rapes, and 74% of
completed and attempted sexual
assaults against females were not
reported to the police. (See box, page
3, for the most common reasons for
not reporting.) When the police were
notified about a rape or sexual assault,
the victim most often made the report.
Treatment of injuries
Most injured rape and sexual assault
victims were not treated for their
injuries (table 4). Treatment for injuries
range from receiving care at the scene
or in the victim's home to being admitted to a hospital. Thirty-two percent of
completed rape victims, 32% of injured
attempted rape victims, and 27% of
injured sexual assault victims were
treated.
Forty-eight percent of female rape
victims who received treatment for their
2 Rape and Sexual Assault

treatment at the scene or at home
(20%), at a doctor's office or clinic
(31%), or at the hospital (24%) at
statistically similar percentages.

injuries were treated at, but not admitted to, a hospital. An additional 24%
of treated rape victims were cared for
at home or at the scene, and 20% were
treated at a doctor's office or clinic.

Reporting violence to the police and
treatment of injuries sustained

Injured victims of attempted rape were
equally likely to be treated at the scene/
home or at a hospital. Of injured
female attempted rape victims, 44%
were treated, but not admitted to the
hospital, and 39% were treated at the
scene or at home.

Between 1992 and 2000, an annual
average of 131,950 completed rapes
were committed against females age
12 or older in the United States. By
definition all 131,950 victimizations
resulted in an injured victim. Though
all victims were injured, 36% (or
47,960) of these victimizations

Injured victims of completed and
attempted sexual assault received

Table 2. Injuries sustained by female rape and sexual assault victims, 1992-2000

Injury from victimization
Total victimizations
Not injured
Injured
Serious injury
Minor injury
Undetermined injury

Completed rape
Number Percent
131,950
100%
0*
0
131,950
100
7,180
5
42,630
33
81,140
61

Average annual, 1992-2000
Attempted rape
Sexual assault
Number Percent
Number Percent
98,970
100%
135,550
100%
60,010
61
112,520
83
38,960
39
23,020
17
2,540*
3
1,220*
1
25,450
26
12,390
9
10,730
11
8,590
6

Note: Detail may not add to total due to rounding. By NCVS definition, all victims of completed
rape were injured.
*Based on 10 or fewer sample cases.

Table 3. Rape and sexual assault of females, by reporting to the police,
1992-2000
Reporting of
Completed rape
victimizations to police
Number Percent
Total victimizations
131,950
100%
Reported to police
47,960
36
By victim
23,890
18
By other household member 10,080
8
By someone else
13,990
11
Not reported to police
83,700
63
Don't know if it was reported
0*
0

Average annual, 1992-2000
Attempted rape
Sexual assault
Number Percent
Number Percent
98,970
100%
135,550
100%
33,560
34
34,830
26
24,040
24
21,560
16
3,510*
4
4,970
4
6,010
6
8,310
6
64,600
65
99,840
74
800*
1
880*
1

Note: Detail may not add to total due to rounding.
*Based on 10 or fewer sample cases.

Table 4. Medical treatment received by female rape and sexual assault victims,
1992-2000
Medical treatment
received
Total injured
Treated
Scene/home
Doctor's office or clinic
Hospital, not admitted
Hospital, admitted
Other location

Completed rape
Number Percent
131,950
100%
42,230
32
10,050
8
8,640
7
20,410
15
2,590*
2
540*
---

Average annual, 1992-2000
Attempted rape
Sexual assault
Number Percent
Number Percent
38,960
100%
23,020
100%
12,490
32
6,250
27
4,860
12
1,280*
6
1,400*
4
1,930*
8
5,510
14
1,530*
7
720*
2
580*
3
0*
0
930*
4

Note: Detail may not add to total due to rounding. By NCVS definition, all victims of completed
rape were injured.
*Based on 10 or fewer sample cases.
---Less than 0.5%.

were reported to the police. A greater
percentage of reported victimizations,
compared to nonreported victimiza-

tions, involved medical treatment of the
victims. Fifty-nine percent of victims of
a reported completed rape, compared

59% of female rape victims whose victimization was reported to police received
medical treatment, compared to 17% of victims whose crime went unreported
Completed rape
131,950

to 17% of victims of an unreported
completed rape, received medical
attention (figure 1).
U.S. females age 12 or older were
victims of an estimated 98,970
attempted rapes, annually. Thirty-nine
percent of attempted rape victims were

__________________________________________

Injured
(100%)

Reasons for not reporting to law
enforcement authorities

______________________________________________

Reported to police
47,960 (36%)

Not reported to police
83,700 (63%)

Treated
28,130 (59%)

Treated
14,100 (17%)

Not treated
19,830 (41%)

Not treated
69,600 (83%)

When victims of rape, attempted
rape, and sexual assault did not
report the crime to the police, the
most often cited reason was that the
victimization was a personal matter:

Note: All victims of rape are considered to have been injured. Detail may not add
to totals because of rounding and omission of Don't know responses. Counts are annual
averages, 1992-2000.
Figure 1

Of the 99,000 female victims of attempted rape, 39% were injured:
42% of the injured and 29% of the uninjured said the crime was reported
Attempted rape
98,970
__________________________________________

Injured
Not injured
38,960 (39%)
60,010 (61%)
________________________________
__________________________________
Reported to police
Not reported to police Reported to police
Not reported to police
16,450 (42%)
22,510 (58%)
17,110 (29%)
42,100 (70%)
Treated
7,440 (45%)

Treated
5,050 (22%)

Not treated
9,010 (55%)

Not treated
17,460 (78%)

Figure 2

Of the 135,600 female victims of sexual assault, 17% were injured, and 42%
of the injured said the crime was reported. A fourth of the injured were treated.
Attempted and completed sexual assault
135,550

__________________________________________

Injured
Not injured
23,020 (17%)
112,520 (83%)
________________________________
__________________________________
Reported to police
Not reported to police Reported to police
Not reported to police
9,540 (41%)
13,130 (57%)
25,290 (22%)
86,700 (77%)
Treated
2,350 (18%)

Not treated
5,990 (63%)

Not treated
10,790 (82%)

Note: Detail may not add to totals because of rounding and omission
of Don't know responses. Counts are annual averages, 1992-2000.

Attempted rape: personal matter,
16.8%; fear of reprisal, 11.3%;
protect offender, 9.9%.
Completed and attempted sexual
assault: personal matter, 25.3%;
reported to different official, 12.4%;
fear of reprisal, 11.3%.

The victim-offender relationship
and informing the police
The closer the relationship between
the female victim and the offender,
the greater the likelihood that the
police would not be told about the
rape or sexual assault.

Note: Detail may not add to totals because of rounding and omission
of Don't know responses. Counts are annual averages, 1992-2000.

Treated
3,550 (37%)

Rape: personal matter, 23.3%; fear of
reprisal, 16.3%; police biased, 5.8%.

When the offender was a current or
former husband or boyfriend, about
three-fourths of all victimizations
were not reported to police (77% of
completed rapes, 77% of attempted
rapes, and 75% of sexual assaults
not reported).
When the offender was a friend or
acquaintance, 61% of completed
rapes, 71% of attempted rapes, and
82% of sexual assaults were not
reported.
When the offender was a stranger,
54% of completed rapes, 44% of
attempted rapes, and 34% of sexual
assaults were not reported to the
police.

Figure 3

Reporting to Police and Medical Attention, 1992-2000

3

injured. Among injured victims, 42%
stated the violence was reported to
police. Among injured victims, a higher
percentage of reported attempted
rapes (45%), compared to unreported
attempted rapes (22%), received
medical treatment (figure 2).
Seventeen percent (or 23,020) of the
135,550 completed or attempted
sexual assaults annually against
females age 12 or older resulted in an
injury. Most sexual assault victims
were not injured (83%). Most uninjured
sexual assault victims stated that the
violence went unreported to the police
(77%).
Of those victims injured during a
sexual assault, 41% of the violence
was reported to police, and 57% went
unreported. Among injured sexual
assault victims, a higher percentage
of those whose assault was reported
(37%), compared to victims of
unreported crimes (18%), received
treatment (figure 3).

U.S. Department of Justice
Office of Justice Programs
Bureau of Justice Statistics
Washington, DC 20531

Official Business
Penalty for Private Use $300

4 Rape and Sexual Assault

This report uses the definitions of
offenses included in Intimate Partner
Violence, a BJS Special Report, May
2000, NCJ 178247.

This report and additional data,
analyses, and graphs about criminal
victimization in the United States are
available on the Internet at
Http://www.ojp.usdoj.gov/bjs/

The Bureau of Justice Statistics
is the statistical agency of the
U.S. Department of Justice.
Lawrence A. Greenfeld is
director.

For questions or comments about
this or any BJS report, email to
ASKBJS@ojp.usdoj.gov.

Callie Marie Rennison wrote this
Selected Findings under the supervision of Michael Rand. Cathy Maston
provided statistical review. Tom
Hester produced and edited the
report. Jayne Robinson prepared
the report for final publication.

Data presented in this report can be
obtained from the National Archive
of Criminal Justice Data at the
University of Michigan, 1-800-9990960. The archive can also be
accessed through the BJS Web site.
When at the archive site, search for
dataset ICPSR 3140.

August 2002, NCJ 194530

PRESORTED STANDARD
POSTAGE & FEES PAID
DOJ/BJS
Permit No. G-91