
Prisoners in 2006, DOJ BJS, 2006
Download original document:
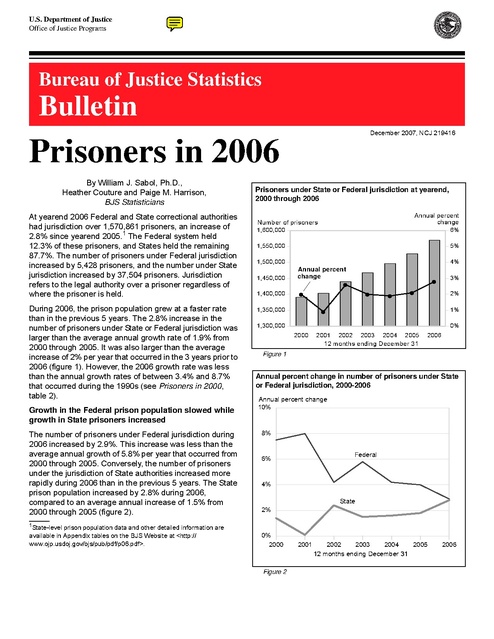
Document text
Document text
This text is machine-read, and may contain errors. Check the original document to verify accuracy.
U.S. Department of Justice
Office of Justice Programs

Bureau of Justice Statistics

Bulletin
December 2007, NCJ 219416

Prisoners in 2006
By William J. Sabol, Ph.D.,
Heather Couture and Paige M. Harrison,
BJS Statisticians
At yearend 2006 Federal and State correctional authorities
had jurisdiction over 1,570,861 prisoners, an increase of
2.8% since yearend 2005.1 The Federal system held
12.3% of these prisoners, and States held the remaining
87.7%. The number of prisoners under Federal jurisdiction
increased by 5,428 prisoners, and the number under State
jurisdiction increased by 37,504 prisoners. Jurisdiction
refers to the legal authority over a prisoner regardless of
where the prisoner is held.
During 2006, the prison population grew at a faster rate
than in the previous 5 years. The 2.8% increase in the
number of prisoners under State or Federal jurisdiction was
larger than the average annual growth rate of 1.9% from
2000 through 2005. It was also larger than the average
increase of 2% per year that occurred in the 3 years prior to
2006 (figure 1). However, the 2006 growth rate was less
than the annual growth rates of between 3.4% and 8.7%
that occurred during the 1990s (see Prisoners in 2000,
table 2).
Growth in the Federal prison population slowed while
growth in State prisoners increased
The number of prisoners under Federal jurisdiction during
2006 increased by 2.9%. This increase was less than the
average annual growth of 5.8% per year that occurred from
2000 through 2005. Conversely, the number of prisoners
under the jurisdiction of State authorities increased more
rapidly during 2006 than in the previous 5 years. The State
prison population increased by 2.8% during 2006,
compared to an average annual increase of 1.5% from
2000 through 2005 (figure 2).
_______
1State-level

prison population data and other detailed information are
available in Appendix tables on the BJS Website at <http://
www.ojp.usdoj.gov/bjs/pub/pdf/p06.pdf>.

Prisoners under State or Federal jurisdiction at yearend,
2000 through 2006
Annual percent
change
6%

Number of prisoners
1,600,000
1,550,000

5%

1,500,000

4%

1,450,000

Annual percent
change
J

1,400,000

J

1,350,000

J
J

J

3%
2%

J

1%

J

1,300,000

0%
2000

2001 2002 2003 2004 2005
12 months endin g December 31

2006

Figure 1

Annual percent change in number of prisoners under State
or Federal jurisdiction, 2000-2006
Annual percent change
10%

8%

Federal

6%

4%

State

2%

0%
2000

Figure 2

2001

2002
2003
2004
2005
12 months ending December 31

2006

During 2006 the prison population increased in
41 States and declined in the remaining 9 States
(table 1). New Hampshire (10.9%), Nevada
(9.5%), and Rhode Island (9.4%) had the largest
percentage increase in the size of their prison
population. South Dakota (-3.0%), Hawaii
(-2.9%), and Kansas (-2.8%) had the largest
percentage decrease in prisoners.
The growth rate for 30 of the 41 States
experiencing an increase in 2006 exceeded the
average annual rate of growth for the 5-year
period from 2000 through 2005. Three of these
States (New Jersey, New York, and Illinois)
experienced a decline in the growth rate during
the 5-year period, but had small increases
during 2006.
Eight States had absolute increases that
exceeded 2,000 prisoners in 2006: California,
Georgia, Florida, Pennsylvania, Michigan, Ohio,
Texas, and Arizona. California (4,836), Georgia
(4,043), and Ohio (3,312) had the largest
absolute increase. Collectively, these 8 States
accounted for 66% of the total change in the
number of prisoners under State jurisdiction.
Growth rates accelerated in States with the
largest prison populations
Of the 10 States that had the largest prison
populations in 2000, 9 experienced an increase
in the size and rate of growth of their prison
populations during 2006. (See Appendix table
1). These 10 States included Texas, California,
New York, Michigan, Ohio, Illinois, Georgia,
Pennsylvania, Louisiana, and Florida. Florida is
the only State among the 10 that did not have an
increase in the rate of growth during 2006. Its
prison population increased by 3.6% during
2006 which represented a decrease from the
average annual growth rate of 4.7% from 2000
to 2005.
Combined, the prison population in these 10
States grew by 3.2% during 2006, a rate that
was more than 3 times the 0.9% average annual
growth rate that occurred in these States from
2000 through 2005 (table 2). Among the 10
large States, prison populations in Georgia
(8.3%), Ohio (7.2%), and Pennsylvania (4.8%)
grew fastest during 2006. New York’s prison
population increased by 0.9% during 2006,
reversing a 5-year decline of 2.2% per year.
Illinois’ prison population, which declined by
0.2% per year from 2000 through 2005, also
increased by 0.4% during 2006.

2 Prisoners in 2006

Table 1. Prisoners under the jurisdiction of State or Federal correctional
authorities, by region and jurisdiction, 2000, 2005, and 2006
Region and
jurisdiction
U.S. total
Federal
State

Number of prisoners
Percent change
12/31/00 12/31/05 12/31/06 2000-2005a 2005-2006
1,391,261 1,527,929
145,416
187,618
1,245,845 1,340,311

1,570,861
193,046
1,377,815

1.9%
5.8%
1.5

2.8%
2.9%
2.8

Northeast
Connecticutb
Maine
Massachusetts
New Hampshire
New Jersey
New York
Pennsylvania
Rhode Islandb
Vermontb

174,826
18,355
1,679
10,722
2,257
29,784
70,199
36,847
3,286
1,697

172,910
19,442
2,023
10,701
2,530
27,359
62,743
42,380
3,654
2,078

177,817
20,566
2,120
11,032
2,805
27,371
63,315
44,397
3,996
2,215

-0.2%
1.2
3.8
0.0
2.3
-1.7
-2.2
2.8
2.1
4.1

2.8%
5.8
4.8
3.1
10.9
0.0
0.9
4.8
9.4
6.6

Midwest
Illinois
Indiana
Iowab
Kansas
Michigan
Minnesota
Missouri
Nebraska
North Dakota
Ohio
South Dakota
Wisconsin

237,378
45,281
20,125
7,955
8,344
47,718
6,238
27,543
3,895
1,076
45,833
2,616
20,754

254,683
44,919
24,455
8,737
9,068
49,546
9,281
30,823
4,455
1,385
45,854
3,463
22,697

261,446
45,106
26,091
8,875
8,816
51,577
9,108
30,167
4,407
1,363
49,166
3,359
23,431

1.4%
-0.2
4.0
1.9
1.7
0.8
8.3
2.3
2.7
5.2
0.0
5.8
1.8

2.7%
0.4
6.7
1.6
-2.8
4.1
-1.9
-2.1
-1.1
-1.6
7.2
-3.0
3.2

South
Alabama
Arkansas
Delawareb
District of Columbiac
Florida
Georgiad
Kentucky
Louisiana
Maryland
Mississippi
North Carolina
Oklahoma
South Carolina
Tennessee
Texas
Virginia
West Virginia

561,214
26,332
11,915
6,921
7,456
71,319
44,232
14,919
35,207
23,538
20,241
31,266
23,181
21,778
22,166
166,719
30,168
3,856

608,138
27,888
13,541
6,966
~
89,768
48,749
19,662
36,083
22,737
20,515
36,365
26,676
23,160
26,369
169,003
35,344
5,312

623,563
28,241
13,729
7,206
~
92,969
52,792
20,000
37,012
22,945
21,068
37,460
26,243
23,616
25,745
172,116
36,688
5,733

1.7%
1.2
2.6
0.1
~
4.7
2.0
5.7
0.5
-0.7
0.3
3.1
2.8
1.2
3.5
0.3
3.2
6.6

2.5%
1.3
1.4
3.4
~
3.6
8.3
1.7
2.6
0.9
2.7
3.0
-1.6
2.0
-2.4
1.8
3.8
7.9

West
Alaskab
Arizonad
California
Colorado
Hawaiib
Idaho
Montana
Nevada
New Mexico
Oregon
Utah
Washington
Wyoming

272,427
4,173
26,510
163,001
16,833
5,053
5,535
3,105
10,063
5,342
10,580
5,637
14,915
1,680

304,580
4,812
33,565
170,676
21,456
6,146
6,818
3,532
11,782
6,571
13,411
6,382
17,382
2,047

314,969
5,069
35,892
175,512
22,481
5,967
7,124
3,572
12,901
6,639
13,707
6,430
17,561
2,114

2.3%
2.9
4.8
0.9
5.0
4.0
4.3
2.6
3.2
4.2
4.9
2.5
3.1
4.0

3.4%
5.3
6.9
2.8
4.8
-2.9
4.5
1.1
9.5
1.0
2.2
0.8
1.0
3.3

~Not applicable. See footnote d.
Average annual percentage increase.
bPrisons and jails form one integrated system. Data include total jail and prison
population.
c
D.C. prisoners were transferred to the Federal Bureau of Prisons in 2001.
d
Population based on custody counts.
a

In the 10 States having the largest prison population in
2000, the increase of 24,241 prisoners during 2006
accounted for 64.6% of the total change (37,504) in the
number of prisoners under State jurisdiction. By
comparison, from 2000 through 2005 these 10 large States
accounted for 32.7% of the overall change in the number of
prisoners under State jurisdiction. The increase in
California (4,836 prisoners) and Georgia (4,043 prisoners)
accounted for 23.6% of the total change in State prisoners.

Table 2. Growth in the number of prisoners under State
jurisdiction, by size of State prison population in 2000-2005
and 2005-2006
Rank of States in
2000a

Change in number of prisoners
Percent change
Percent of total increase
2000-2005b 2005-2006 2000-2005 2005-2006

All Statesa
10 largest
2nd 10
3rd 10
4th 10
10 smallest

Growth rates in the 10 smallest States (those holding fewer
than 1,100 prisoners in 2000) were higher than growth
rates in larger States. The number of prisoners in the 10
smallest jurisdictions increased at an average of 3.9%
annually between 2000 and 2005, and by 4.0% in 2006.

100%
32.7
27.5
23.5
11.1
5.2

100%
64.6
10.9
17.1
4.2
3.2

aExcludes

prisoners for the District of Columbia in 2000. After 2001,
sentenced felons from D.C. were under Federal jurisdictions.

bAverage

During 2006 the number of women in prison increased by
4.5%, reaching 112,498 prisoners (table 3; see also
Appendix table 2). This was larger than the male growth
rate of 2.7%. The growth rate for female prisoners during
2006 was larger than the average annual growth rate of
2.9% from 2000 through 2005. Over the 5-year period,
female prisoners increased by an average of 2,878 inmates
per year. In 2006 the number of female prisoners increased
by 4,872 women.

annual change.

Table 3. Prisoners under State or Federal jurisdiction,
by gender, 2000, 2005, and 2006

At yearend 2006, females made up 7.2% of the population
under State or Federal jurisdiction, up from 6.7% in 2000.
The largest proportion of women inmates were in Hawaii
(12.3%), followed by North Dakota and Wyoming (both
11.5%). Oklahoma had the highest female incarceration
rate in the Nation (129 inmates per 100,000 women),
followed by Louisiana (108) and Idaho (106).

Year

Total

2000
2005
2006

1,391,261
1,527,929
1,570,861

Male
1,298,027
1,420,303
1,458,363

Female
93,234
107,626
112,498

Percent change, 2005-2006

2.8%

2.7%

4.5%

Average annual growth rate,
2000-2005

1.9%

1.8%

2.9%

Change in the number of
prisoners under jurisdiction
2000-2005
2005-2006

136,668
42,932

122,276
38,060

14,392
4,872

Note: See table 1 and Appendix tables 2 and 3.

Number of inmates in
custody
2005
2006

Total incarcerated population at yearend 2006

For more information on custody populations, see
box on Inmates in custody in State or Federal
prisons or in local jails on page 4 and box on U.S.
Immigration and Customs Enforcement (ICE)
detainees at yearend 2006 on page 9.

2.8%
3.2
1.4
3.5
2.1
4.0

Note: See Appendix table 1 for the States in each group.

Number of female prisoners under jurisdiction rose
faster during 2006 than over the previous 5 years

At yearend 2006 correctional facilities in the United
States held an estimated 2,385,213 inmates in
custody, including inmates in Federal and State
prisons, territorial prisons, local jails, facilities
operated by or exclusively for U.S. Immigration and
Customs Enforcement (ICE), military facilities, jails in
Indian country, and youth in juvenile facilities. During
2006 the total incarcerated population increased by
2.8%, or 64,579 inmates.

2.0%
0.9
2.1
2.8
3.2
3.9

Total
Federal and State prisonsa
Territorial prisons
Local jailsb
ICE facilities
Military facilities
Jails in Indian countryc
Juvenile facilitiesd

Percent change,
2005-2006

2,320,634

2,385,213

1,448,344
15,735
747,529
10,104
2,322
1,745
94,875

1,492,973
15,205
766,010
14,482
1,944
1,745
92,854

2.8%
3.1
-3.4
2.5
43.3
-16.3
0.0
-2.1

Note: Data are based on custody counts. See Appendix table 11 for custody counts in U.S. territories and commonwealths and Appendix table 12
for counts by military branch..
aExcludes
b
c

State and Federal prisoners housed in local jails.

As of June 30 of each year.

As of June 30, 2004.

d

Counts are from the Census of Juveniles in Residential Placement
(CJRP), conducted by Office of Juvenile Justice and Delinquency Prevention. The 2005 count is for October 22, 2003; for 2006, the count is as of
March 29, 2006.

Prisoners in 2006 3

total decrease was 703 prisoners. Eighteen States had no
prisoners in private facilities on December 31, 2006.

Eight jurisdictions held more than half of the 112,498
women under State or Federal jurisdiction: Texas, the
Federal system, California, Florida, Ohio, Georgia, Arizona,
and Virginia. Three jurisdictions —Texas, the Federal
system, and California — collectively held more than a third
of the women under jurisdiction at yearend 2006. These 3
jurisdictions also held more than a third of the male prison
population.

Texas and Colorado had the largest absolute increase in
the number of inmates held in private facilities at yearend
2006. Indiana more than doubled the number of inmates in
private facilities, reaching 1,290 inmates, and Pennsylvania
nearly doubled, reaching 962 inmates.

States increased the use of privately operated facilities
by more than 6% during 2006

Inmates in privately operated
prisons, 2005-2006
Change in
number of Percent of total
prisoners increase

Number of
prisoners,
2006

A total of 113,791 State and Federal prisoners were held in
privately operated facilities at yearend 2006. This
represented an increase of 5.4% (or 5,851 prisoners) over
the 107,940 held in private facilities at the end of 2005.
(See Appendix table 4).

Jurisdictions with
increases
Texas
Colorado
Federal
Indiana
Pennsylvania
Other (19 States)

During 2006, 24 jurisdictions had increases in the number
of prisoners held in privately operated facilities, and 9 had
decreases. The total increase was 6,554 prisoners; the

100,269
18,627
4,855
27,726
1,290
962
46,809

6,554
1,110
816
680
668
459
2,821

100%
16.9
12.5
10.4
10.2
7.0
43.0

Inmates in custody in State or Federal prisons or in local jails at yearend 2006
At yearend 2006, 2.26 million inmates were in custody
in State and Federal prisons and in local jails. This
was an incarceration rate of 751 inmates per 100,000
U.S. residents, or 1 in every 133 residents.

military facilities, U.S. Immigration and Customs
Enforcement facilities, jails in Indian country, and
juvenile facilities. (See box on Total incarcerated
population at yearend 2006 on page 3.)

Custody count includes inmates held in State or
Federal public prison facilities, inmates held in
privately operated facilities, and inmates held in local
jails. It excludes inmates held in U.S. Territories,

During 2006 the number of people in custody
increased by 2.9%, up from the average annual
growth rate of 2.6% from yearend 2000 through 2005.

Number of persons held in State or Federal prisons or in local jails, 2000-2006
2000
Total inmates in custody
1,937,482
Federal prisonersb
Total
140,064
Prisons
133,921
Federal facilities
124,540
Privately operated
facilities
9,381
Community Corrections
Centersc
6,143
State prisoners
Total
1,176,269
State prison facilities
1,121,326
Privately operated
facilities
75,292
Inmates held in local jailsd
621,149
Incarceration ratee

684

Average
Percent change change
2005-2006
2000-2005a

2001

2002

2003

2004

2005

2006

1,961,247

2,033,022

2,081,580

2,135,335

2,195,873

2,258,983

2.9%

2.6%

149,852
143,337
130,601

158,216
151,618
137,942

168,144
161,673
146,279

177,600
170,535
152,832

186,364
179,220
159,318

190,844
183,381
163,118

2.4%
2.3
2.4

5.3%
5.4
4.6

12,736

13,676

15,394

17,703

19,902

20,263

1.8

13.7

6,515

6,598

6,471

7,065

7,144

7,463

4.5

3.3

1,180,155
1,125,957

1,209,331
1,153,982

1,222,135
1,167,865

1,243,745
1,186,133

1,261,980
1,198,705

1,302,129
1,224,205

3.2%
2.1

1.7%
1.5

71,661
631,240

73,638
665,475

73,842
691,301

73,860
713,990

80,387
747,529

86,065
766,010

7.1
2.5

2.3
3.6%

685

701

712

723

737

751

Note: Counts include all inmates held in public and private adult correctional facilities and in local jails.
a

Average annual percentage increase from 2000 through 2005.

b

As a result of the National Revitalization Act of 1997, District of Columbia (D.C.) inmates sentenced to more than 1 year were transferred to the
Federal Bureau of Prisons. This transfer was completed in 2001.

cNon-secure,

privately operated community corrections centers.

d

Inmates held in local jails are for June 30 each year. Counts were estimated from the Annual Survey of Jails in every year except 2005
when a Census was conducted.
e

Number of prison and jail inmates per 100,000 U.S. residents as of January 1 in each year following the reference year.

4 Prisoners in 2006

Three States housed more than a third of their prisoners in
privately operated facilities: New Mexico (44%), Wyoming
(37%), and Alaska (33%). An additional 7 States housed
more than 20% of their prison population in private
facilities. (See Appendix table 4).
States increased the use of privately operated facilities
more rapidly than did the Federal system in 2006 (figure 3).
The number of State prisoners housed privately increased
by 6.4% during 2006, reaching 86,065 inmates, while the
number of Federal prisoners housed privately increased by
2.5%, reaching 27,726 prisoners. From yearend 2000 to
2006, the number of Federal prisoners housed in private
facilities increased 79%; State prisoners, by 15%.
Number of prisoners held in local jails increased by
6.6%
The number of State and Federal prisoners held in local
jails increased at yearend 2006, from 73,164 to 77,987 (up
6.6%) (table 4). This increase accounted for 11.2% of the
overall increase in the prison population under jurisdiction.
The Federal system nearly doubled the number of inmates
held in local jails, from 1,044 at yearend 2005 to 2,010 at
yearend 2006 (table 4). Inmates under State jurisdiction
held in local jails increased by 5.3%, a rate faster than the
3.5% average annual growth from 2000 to 2005.
Thirty-five States and the Federal system held prisoners in
local jails at yearend 2006. Six jurisdictions held more than
20% of their prisoners in local jails, led by Louisiana (44%),
Kentucky (30%), and Tennessee (25%). Louisiana held the
largest absolute number of inmates in local jails (16,230),
followed by Texas (15,091).
Number of prisoners under State or Federal jurisdiction
held in private facilities, 2000-2006
Number of inmates in privately operated facilities
120,000

Figure 3

2002

2003

Design capacity is the number of inmates that planners or
architects intended for the facility.
Highest capacity is the sum of the maximum number of
beds and inmates reported by a jurisdiction across the 3
capacity measures, and the lowest capacity is the minimum
of these 3 measures within a jurisdiction. Estimates of
prison population as a percentage of capacity are based on
the jurisdiction’s custody population. In general, a
jurisdiction’s capacity and custody counts exclude inmates
held in private facilities. Some jurisdictions include
prisoners held in private facilities as part of the capacity of
their prison systems. Where this occurs, prison population
as a percent of capacity includes private prisoners.
The Federal system reported capacity of 119,243 beds at
yearend 2006. (See Appendix table 5.) Among States
reporting capacity counts for yearend 2006, the highest
capacity was 1,253,261 and the lowest capacity was
1,074,570 (table 5). Both measures of capacity increased
since yearend 2005. Highest capacity increased by 3.4%
and lowest capacity increased by 2.5% during 2006.
At yearend 2006, 23 States and the Federal system
operated at more than 100% of their highest capacity.
Seventeen States operated at between 90% and 99% of
their highest capacity. The Federal prison system was
operating at 37% above its rated capacity at yearend 2006.

Year

Federal
2001

Operational capacity is the number of inmates that can be
accommodated based on a facility’s staff, existing
programs, and services.

State

40,000

0
2000

Rated capacity is the number of beds or inmates assigned
by a rating official to institutions within the jurisdiction.

Table 4. Number of State and Federal inmates held
in local jails and percent of all prisoners under jurisdiction,
2000-2006

60,000

20,000

Jurisdictions provided three measures of their capacity for
yearend 2006:

Total
100,000
80,000

States expanded prison capacity during 2006

2004

2005

2006

2000
2001
2002
2003
2004
2005
2006
Percent change, 20052006
Average annual growth
rate, 2000-2005

Total

State

63,140
70,681
72,550
73,440
74,445
73,164
77,987

60,702
67,760
69,713
70,162
73,246
72,120
75,977

Percent of all
Federal prisoners*
2,438
2,921
3,377
3,278
1,199
1,044
2,010

6.6%

5.3%

92.5%

3.0%

3.5%

-15.6%

4.5%
5.0
5.0
5.0
5.0
4.8
5.0

Note: See Appendix table 4 for State-level data.
*Percent is the total number in local jails over the total number of prisoners under jurisdiction of State or Federal authorities.

Prisoners in 2006 5

By comparison, in 1995 States operated at 114% of their
highest capacity and 125% of their lowest reported
capacity. The Federal system was operating at 26% over
reported capacity in 1995.
Prison incarceration rate for sentenced prisoners
reached 501 per 100,000 residents in 2006
About 96% of prisoners under State or Federal jurisdiction
(or 1,502,179 prisoners) were sentenced to more than 1
year in prison (table 6). During 2006 the sentenced prison
population increased by 2.7% or 39,313 prisoners,
accounting for 92% of the overall increase in the jurisdiction
prison population.
The incarceration rate for prisoners sentenced to more
than 1 year was 501 per 100,000 U.S. residents. This rate
equaled about 1 in every 200 U.S. residents serving a
prison term of more than 1 year on December 31, 2006.
Among the States, the incarceration rate for prisoners
sentenced to more than 1 year ranged from a high of 846
per 100,000 persons in Louisiana to a low of 151 per
100,000 in Maine.

White women made up almost half of sentenced female
prisoners in 2006; number of black women has
decreased
Of the 103,100 female prisoners sentenced to more than 1
year in State or Federal prison, nearly half (48% or 49,100
prisoners) were white females (table 7). Black women (an
estimated 28,600 inmates) made up 28% of all sentenced
female prisoners, and Hispanic women, 17%.
Since 2000 the number and percentage of white women
among sentenced female prisoners have increased. Over
the same period, both the number and percentage of black
women among sentenced female prisoners declined. At
yearend 2000, the estimated 33,300 white women
accounted for 40% of sentenced female prisoners, while
the estimated 32,000 black women accounted for 38% of
sentenced female prisoners.
Women ages 35 to 39 made up the largest percentage of
sentenced female prisoners overall (19%). This age group
also made up the largest percentage of all 3 groups of
sentenced female prisoners — white, 18%, black, 19%,
and Hispanic,18%. (See Appendix table 7.)

Table 5. State prison population as a percent of capacity,
1995 and 2000-2006
Year
1995
2000
2001
2002
2003
2004
2005
2006
State capacity, 2006

Highest capacity
114%
100
101
101
100
99
99
98
1,253,261

Table 7. Number of sentenced prisoners under State or
Federal jurisdiction by gender, race, and Hispanic origin,
2000-2006

Lowest capacity
125%
115
116
117
116
115
114
114
1,074,570

Characteristic

Notes: Capacity excludes prisoners held in local jails and in privately operated facilities, with exceptions. See Appendix table 5 for
State-level data and States that include private facilities in capacity.

Table 6. Number of prisoners under State or Federal
jurisdiction sentenced to more than 1 year and change
in number of prisoners, by gender, 2000-2006
Year
2000
2005
2006

Total
1,331,278
1,462,866
1,502,179

Male
1,244,454
1,364,178
1,399,075

Female
84,913
98,688
103,104

Percent change, 2005-2006

2.7%

2.6%

4.5%

Average annual growth rate,
2000-2005

1.9%

1.9%

3.1%

Incarceration rate per 100,000
U.S. residents
2000
2005
2006

478
491
501

915
929
943

59
65
68

Note: See Appendix table 6 for jurisdiction level data on sentenced
prisoners.

6 Prisoners in 2006

2000a

Total
1,321,100
1,237,500
Malec
398,800
Whited
528,300
Black or African-Americand
Hispanic or Latino
240,700
83,700
Femalec
33,300
Whited
32,000
Black or African-Americand
Hispanic or Latino
13,000
Percent of sentenced
prisoners
Malec
Whited
Black or African-Americand
Hispanic or Latino
Femalec
Whited
Black or African-Americand
Hispanic or Latino

100%
93.7%
30.2
40.0
18.2
6.3%
2.5
2.4
1.0

2005b

2006a

1,461,100
1,362,500
459,700
547,200
279,000
98,600
45,800
29,900
15,900

1,502,200
1,399,100
478,000
534,200
290,500
103,100
49,100
28,600
17,500

100%
93.3%
31.4
37.5
19.1
6.7%
3.1
2.0
1.1

100%
93.1%
31.8
35.6
19.3
6.9%
3.3
1.9
1.2

Note: Data are for prisoners sentenced to more than 1 year. See
Appendix table 7 for age distributions by age and sex.
a
See Estimating Age-Specific Incarceration Rates in Methodology.
Data for 2000 are updated from previously published data.
b
See Prisoners in 2005, table 10.
cTotals include American Indians, Alaska Natives, Asians, Native
Hawaiians, other Pacific Islanders, and persons identifying two or
more races.
d
Excludes Hispanic or Latino persons.

Number of black men among sentenced male
prisoners declined slightly since 2000

The rate of incarceration increased for white women,
declined for black women

Black men represented the largest proportion of sentenced
male inmates at yearend 2006 (38%); white men made up
34%; and Hispanic men, 21%.

White women were about one-third as likely as black
women to be incarcerated and slightly more than half as
likely as Hispanic women. There were 48 sentenced white
female prisoners under State or Federal jurisdiction per
100,000 white women in the general population at yearend
2006 (table 9). Black women were incarcerated at a rate of
148 per 100,000, and Hispanic women at a rate of 81 per
100,000.

Black men ages 25 to 29 made up nearly one-fifth (19%) of
sentenced black male prisoners, followed by black men
ages 30 to 34 (17%). The largest percentage of sentenced
Hispanic male prisoners were also in these two age groups
(21% for Hispanic men ages 25 to 29 and 18% for those
ages 30 to 34). White male prisoners were older than black
and Hispanic men. Eighteen percent of white men were
ages 45 to 54 and 16% were ages 40 to 44.
From 2000 through 2006, the number of sentenced black
male prisoners increased slightly, from an estimated
528,300 to 534,200. The percentage of black men among
all sentenced male prisoners declined to 38% from 43%.
Among all sentenced male prisoners, Hispanic men
increased from 20% in 2000 to 21% in 2006.

The incarceration rate for black women declined from 175
per 100,000 at yearend 2000 to 148 per 100,000 at
yearend 2006. At the same time, the rate for white women
increased from 33 per 100,000 to 48 per 100,000, and the
rate for Hispanic women increased from 78 per 100,000 to
81 per 100,000. The decrease in the black female
incarceration rate occurred as the number of sentenced
black female prisoners decreased (from 32,000 to 28,600).
The number of white and Hispanic females both increased.

Declining percentage of blacks among sentenced
prisoners
Comparisons of changes in the racial composition of prison
populations over time are constrained by new data
collection methodologies. Following guidelines provided by
the Office of Management and Budget, beginning in 2005
BJS estimated racial composition of the prison population
separately for persons identifying with one race (97%) and
those identifying with two or more races (3%). These
guidelines have reduced the number and percent of
persons identified as non-Hispanic white and non-Hispanic
black prisoners. In addition, administrative data on the race
and Hispanic origin of prisoners reported to BJS by
corrections officials also overstate the number of nonHispanic white and black prisoners and understate the
number of Hispanics and persons of two or more races.2
Both administrative and estimated data indicate an overall
decline among black prisoners from 2000 through 2006.
The 2006 administrative data show a decline from 46.2% to
41.6%, while the estimated data indicate a decline from
42.4% to 37.5% (table 8).
_____

2Some jurisdictions are not able to report Hispanics or persons of two or
more races as a separate category as requested under OMB guidelines.

Table 8. Percent of sentenced State or Federal prisoners,
by race and Hispanic origin, 2000 and 2006
Percent of sentenced State or Federal prisonersa
Estimatesb
Administrative datac
2000
2006
2000
2006
Total
Race and Hispanic
origin
Whited
Black or African
Americand
Otherd,e
Two or more racesd
Hispanic or Latino

100%

100%

100%

100%

32.7

35.1

35.7

40.0

42.4
2.4
3.2
19.2

37.5
3.7
3.2
20.5

46.2
1.7
-16.4

41.6
2.7
0.2
15.5

Note: See Appendix table 8 for age distribution by race and gender.
-- Not reported.
aBased

year.

on jurisdiction counts of inmates with a sentence of more than 1

b

Estimates for State prisoners based on inmates’ self-report of race and
Hispanic origin from the 2004 Survey of Inmates in State Correctional
Facilities and updated from jurisdiction counts at yearend. Estimates for
Federal prisoners based on Federal Justice Statistics Program data. See
Methodology.

cYearend reports of race of prisoners under State or Federal jurisdictions, as reported by correctional administrators in BJS NPS-1 survey.
See Methodology.
dExcludes

Hispanic or Latino persons; administrative data on race of
prisoner may include Hispanic or Latino persons.

e
Includes Asian, American Indian or Alaska Native, and Native Hawaiian
or other Pacific Islander.

Prisoners in 2006 7

The changes in incarceration rates were associated with
changes in the relative rates of incarceration. Black
women—who in 2000 were 5.3 times as likely as white
women to be incarcerated—were 3.1 times as likely as
white women to be incarcerated at yearend 2006 (table
10). The incarceration rate for Hispanic women relative to
white women declined slightly from 2.4 in 2000 to 1.7 at
yearend 2006.
Black males ages 30 to 34 incarcerated at the highest
rate
Nearly 8% of black men ages 30 to 34 were incarcerated
as sentenced prisoners under State or Federal jurisdiction
at yearend 2006. (See Appendix table 7.) This rate was the
highest rate for males among the estimated age, race, and
Hispanic origin groups. Among white men, those ages 30
to 34 also had the highest incarceration rate. About 1.2% of
white men in this age group were incarcerated. Among
Hispanic men, those ages 25 to 29 were incarcerated at the
highest rates (about 2.5%).
Overall, black men had an incarceration rate of 3,042 per
100,000 black men in the United States at yearend 2006
(See Appendix table 8). About 1 in every 33 black men was
a sentenced prisoner. For white men, the incarceration rate
for 2006 was 487 per 100,000 (or about 1 in every 205
white men). For Hispanic men, the rate was 1,261 per
100,000 (or 1 in every 79 Hispanic men).
Violent offenders made up more than half of all
sentenced inmates in State prisons at yearend 2004
At yearend 2004 (the most recent data available for
estimating offense distributions by gender and race) more
than half (52%) of all sentenced inmates in State prisons
were sentenced for a violent offense (table 11) (See
Appendix tables 9 and 10). Property offenses were the
most serious charge for 21% of State prisoners, and drug
offenses, 20%.
Offense distributions differed between sentenced male and
female State prisoners. More than half of males (53%) were
sentenced for violent offenses, compared to 34% of
females. Among State prisoners, sentenced females were
more likely than sentenced males to be sentenced for
property (31% vs. 20%) and drug offenses (29% vs. 19%).
There were also differences in offense distributions at
yearend 2004 by race and Hispanic origin. A majority of
black (53%) and Hispanic (54%) prisoners were sentenced
for violent offenses, compared to about half (50%) of white
prisoners. Blacks and Hispanics were more likely than
whites to be sentenced for drug offenses (23% of blacks,
21% of Hispanics, and 15% of whites). Whites were more
likely (26%) than blacks (18%) or Hispanics (18%) to be
sentenced for property offenses.

8 Prisoners in 2006

Table 9. Incarceration rates for prisoners under State
or Federal jurisdiction sentenced to more than 1 year
Incarceration rate per 100,000
U.S. residents
2000
2005
2006

Gender, race,
Hispanic origin
Total
Male
White*
Black or African-American*
Hispanic or Latino
Female
White*
Black or African-American*
Hispanic or Latino

473
904
410
3,188
1,419
59
33
175
78

491
929
471
3,145
1,224
65
45
156
76

501
943
487
3,042
1,261
68
48
148
81

Note: See Appendix table 8.
*Excludes Hispanic or Latino persons.

Table 10. Ratio of incarceration rates for prisoners under
State or Federal jurisdiction sentenced to more than 1
year, by gender, race, and Hispanic origin
Gender, race,
Hispanic origin

Ratios of incarceration rates per 100,000 U.S.
residents

Male
Black to whitea
Hispanic to whiteb
Female
Black to whitea
Hispanic to whiteb

2000
7.8
3.5

2005
6.7
2.6

2006
6.2
2.6

5.3
2.4

3.5
1.7

3.1
1.7

Note: Number of sentenced prisoners under State or Federal jurisdiction per 100,000 U.S. residents. See Appendix table 7 for distributions by age and gender.
aExcludes

Hispanic or Latino persons.

b

Hispanic refers to Hispanic or Latino persons. White excludes Hispanic or Latino persons. Black or African-American excluded from
both categories.

Table 11. Number and estimated percentage of sentenced
prisoners under State jurisdiction, by offense, gender, race,
and Hispanic origin, yearend 2004
Percent of prisoners
Number of
prisoners
All inmates
1,274,600
Gender
Male
1,188,800
Female
85,800
Race and Hispanic
origin
White*
445,400
Black or African
American*
492,300
Hispanic or Latino
242,700

Violent

Property

Public
Drug order

52.1%

20.8%

19.5% 7.0%

53.4%
34.0

20.1%
30.9

18.9% 7.1%
28.7
5.5

49.8%

26.2%

14.8% 8.5%

53.0
53.8

17.8
17.8

22.9
21.4

5.9
6.5

Note: Data are for inmates with a sentence of more than 1 year under
the jurisdiction of State correctional authorities. For estimates, see
Methodology. Detail may not add to total due to rounding. See Appendix tables 9 and 10 for detailed offense categories.
*Excludes Hispanic or Latino persons.

Drug, weapons offenders accounted for nearly threequarters of the increase in Federal prisoner since 2000
On September 30, 2006, (the latest available data from the
Federal Justice Statistics Program on offenses of Federal
prisoners) drug, weapons, and immigration offenders made
up more than three-quarters (78%) of the 176,268
sentenced Federal prison population (table 12). Drug
offenders made up more than half (53%); weapons
offenders, 14%; and immigration offenders, 11%.
From 2000 to 2006, the number of sentenced offenders in
Federal prison increased by more than a third, from
131,739 to 176,268 in 2006. The number of weapons
offenders more than doubled; immigration offenders
increased by 43%; and drug offenders, by 26%. These
three offense categories accounted for 87% of the growth
in Federal prisoners.

Table 12. Number of sentenced inmates in Federal prison,
by most serious offense, 2000, 2003 and 2006
Offense

Number of sentenced inmates
in Federal prison
Percent change,
2000
2003
2006 2000-2006

Total
Violenta
Property
Drug
Immigration
Weapons
Other public-order
Other/unspecifiedb

131,739 158,426
13,740 16,688
10,135
11,283
74,276 86,972
13,676 16,903
10,822 16,377
7,827
9,045
1,263
1,158

176,268
16,507
10,015
93,751
19,496
24,298
10,542
1,659

33.8%
20.1
-1.2
26.2
42.6
124.5
34.7
31.4

Note: All data are from the BJS Federal justice database for September
30, and based on all sentenced inmates regardless of sentence length.
See Appendix table 13 for detailed offense distributions.

a

Includes murder, non-negligent manslaughter, and manslaughter by
negligence.

b

Includes offenses not classified.

Detainees held by U.S. Immigration and Customs Enforcement (ICE) increased 41% from 2005 to 2006
At yearend 2006, 27,634 detainees were under the jurisdiction of U.S. Immigration and Customs Enforcement
(ICE). This represented a 41% increase (or 8,072 detainees) from yearend 2005.
Facility type
Total
ICE-operated facilities
Private facilities under
exclusive contract to ICE
Federal Bureau of Prisons
Other Federal facilities
Intergovernmental agreements
State prisons
Local jails
Other facilities

Number of detainees
2000
2005 2006
19,528 19,562 27,634
4,785
3,782 6,079
1,829
1,444
178

Percent change,
2005-2006
41.3%
60.7

2,365 3,358
860
574
46
18

42.0
-33.3
-60.9

11,281 12,509 17,605
369
276
96
8,886
8,322 12,482
2,026
3,911 5,027

40.7
-65.2
50.0
28.5

Four border States (Arizona, California, New Mexico, and
Texas) contributed to 67.2% of this growth. The largest
growth occurred in New Mexico and Texas. New Mexico
nearly doubled the number of detainees, increasing from
429 in 2005 to 1,035 in 2006. The detainee population in
Texas increased 76% (or 3,261 detainees). California and
Arizona had similar growth rates (32% and 31%, respectively) and ranked third and fourth in detainee growth.

Honduras. Another 2,643 individuals said they had Mexican citizenship. These groups collectively contributed to
81% of the growth from yearend 2005 to 2006.
Over half (50.7% or 14,015) of the detainees were held on
immigration law violations, 40% were held for criminal
offenses, and the remaining 9.3% were pending charges
or disposition. From yearend 2005 to 2006, the percentage
of detainees held for immigration law violations increased
by 79%. Comparatively, the number of detainees held for
pending charges increased 62% and the number of detainees held for criminal offenses increased 8.9%.
Change, 2005-2006
Number of Percent
detainees change

Reason held

2005

2006

Total
Immigration law
violation
Criminal offense
Pending charge/
disposition

19,562

27,634

8,072

100%

7,826
10,153

14,015
11,052

6,189
899

79.1
8.9

1,583

2,567

984

62.2

Of ICE detainees, 3,881 said their country of origin was in
Central America, specifically El Salvador, Guatemala, and

Prisoners in 2006 9

Methodology

Military Corrections Statistics

National Prisoner Statistics

BJS obtains yearend counts of prisoners in the custody of
U.S. military authorities from the Department of Defense
Corrections Council. In 1994 the Council, comprised of
representatives from each branch of military services,
adopted a standardized report (DD Form 2720) with a
common set of items and definitions. This report obtains
data on persons held in U.S. military confinement facilities
inside and outside of the continental United States, by
branch of service, gender, race, Hispanic origin, conviction
status, sentence length, and offense. It also provides data
on the number of facilities and their design and rated
capacities.

Begun in 1926 under a mandate from Congress, the
National Prisoner Statistics (NPS) program collects
statistics on prisoners at midyear and yearend. The Census
Bureau serves as the data collection agent for BJS. BJS
depends entirely upon the voluntary participation of State
Departments of Corrections and the Federal Bureau of
Prisons for NPS data.
The NPS distinguishes between prisoners in custody and
prisoners under jurisdiction. To have custody of a prisoner,
a State or the Federal system must hold that prisoner in
one of its facilities. To have jurisdiction over a prisoner, a
State or the Federal system must have legal authority over
the prisoner. Some States are unable to provide both
custody and jurisdiction counts.
The NPS jurisdiction counts include inmates held within a
jurisdiction’s facilities, including prisons, penitentiaries,
correctional facilities, halfway houses, boot camps, farms,
training/treatment centers, and hospitals. They include
inmates who are:
• temporarily absent (less than 30 days), out to court, or
on work release
• held in privately-operated facilities, local jails, other State
or Federal facilities
• serving a sentence for a responding jurisdiction and
another jurisdiction at the same time.
The NPS custody counts include all inmates held within a
responding jurisdiction’s facilities, including inmates
housed for other jurisdictions. The custody counts exclude
inmates held in local jails and in other jurisdictions. With a
few exceptions for several responding jurisdictions, the
NPS custody counts exclude inmates held in privatelyoperated facilities.
The NPS counts also include all inmates in State-operated
facilities in Alaska, Connecticut, Delaware, Hawaii, Rhode
Island, and Vermont which have combined jail-prison
systems. Since 2001, NPS prisoner counts have excluded
inmates held by the District of Columbia, which as of
yearend 2001 operated only a jail system. Prisoners
sentenced under the District of Columbia criminal code are
housed in Federal facilities. For more information about the
NPS data collection instruments, see: <http://www.ojp.
usdoj.gov/bjs/correct.htm#Programs>.

10 Prisoners in 2006

Other inmate counts
In 1995 BJS began collecting yearend counts of prisoners
from the Departments of Corrections in the U.S. Territories
(American Samoa, Guam, and the U.S. Virgin Islands) and
U.S. Commonwealths (Northern Mariana Islands and
Puerto Rico). These counts include all inmates for whom
the Territory or Commonwealth had legal authority
(jurisdiction) and all inmates in physical custody (held in
prison or local jail facilities). The counts are collected by
gender, race, Hispanic origin, and sentence length. In
addition, BJS obtains reports on the design, rated, and
operational capacities of these correctional facilities.
BJS obtains yearend counts of persons detained by U.S.
Immigration and Customs Enforcement (ICE), an agency
within the Department of Homeland Security. Formerly the
U.S. Immigration and Naturalization Service, ICE holds
persons for immigration violations in Federal, State, and
locally operated prisons and jails, as well as in privately
operated facilities that are under exclusive contract and in
ICE-operated facilities.
Data on the number of inmates held in the custody of local
jails are from the BJS Annual Survey of Jails (ASJ). The
ASJ provides data on inmates in custody at midyear. For
more information about the ASJ, see Methodology in
Prison and Jail Inmates at Midyear 2006.
Data on the number of juveniles held in residential
placement facilities were obtained from the Office for
Juvenile Justice and Delinquency Prevention, which
conducts a Census of Juveniles in Residential Placement
(CJRP). In this report, CJRP data have a reference date of
March 29, 2006.

Data on Federal prisoners are obtained from BJS’ Federal
Justice Statistics Program (FJSP). The FJSP obtains from
the Federal Bureau of Prisons individual-level records of
prisoners in Federal facilities as of September 30. The
FJSP provides counts of sentenced Federal inmates by
gender, race, Hispanic origin, and offense.
Estimating age-specific incarceration rates
Estimates are provided for the number of sentenced
prisoners under State or Federal jurisdiction by gender
(within genders by age group), race (non-Hispanic white
and non-Hispanic black), and Hispanic origin. The detailed
race and Hispanic origin categories exclude estimates of
persons identifying two or more races. For 2000 and 2006,
estimates were produced separately for inmates under
State and Federal jurisdiction and then combined to obtain
a total estimated population. State estimates were
prepared by combining information about the gender of
prisoners from the NPS with information on self-reported
race and Hispanic origin from the 2004 Survey of Inmates
of State Correctional Facilities.
For the estimates of Federal prisoners, the distributions of
FJSP counts of sentenced Federal inmates by gender, age,
race, and Hispanic origin on September 30, 2006, were
applied to the NPS counts of sentenced Federal inmates by
gender at yearend 2006.
Estimates of the U.S. resident population for January 1,
2007, by age, gender, race, and Hispanic origin, were
generated by applying the July 1, 2006 age distributions
within gender, race, and Hispanic origin groups to the
January 1, 2007 population estimates by gender. The
population estimates were provided by the U.S. Census
Bureau.
Age-specific rates of incarceration for each demographic
group were calculated by dividing the estimated number of
sentenced prisoners within each age group by the
estimated number of U.S. residents in each age group,
multiplying the quotient by 100,000, and then rounding to
the nearest whole number. Totals by gender include all
prisoners and U.S. residents regardless of racial or
Hispanic origin, while incarceration rates for detailed race
and Hispanic origin groups exclude persons identifying two
or more races.

Prisoners in 2006

11

U.S. Department of Justice
Office of Justice Programs
Bureau of Justice Statistics

*NCJ~219416*

PRESORTED STANDARD
POSTAGE & FEES PAID
DOJ/BJS
Permit No. G-91

Washington, DC 20531

Official Business
Penalty for Private Use $300

This report in portable document format and in
ASCII and its related statistical data and tables are
available at the BJS World Wide Web Internet site:
<http://www.ojp.usdoj.gov/bjs/abstract/p06.htm>.

The Bureau of Justice Statistics is the statistical agency
of the U.S. Department of Justice. Jeffrey L. Sedgwick
is the director.

Office of Justice Programs

This Bulletin was written by William J. Sabol, Ph.D.,
Heather Couture, and Paige M. Harrison. Lara Allen
verified the report. Tina Dorsey produced and edited the
report, and Jayne Robinson prepared the report for final
printing, under the supervision of Doris J. James.

Innovation • Partnerships • Safer Neighborhoods
http://www.ojp.usdoj.gov

BJS Bulletins present the first release of findings from
permanent data collection programs.

December 2007, NCJ 219416.

12 Prisoners in 2006

NPS jurisdiction notes
Alaska — Prisons and jails form one integrated system. All NPS data include jail
and prison populations housed in State
and out of State. Jurisdictional counts
include inmates admitted to electronic and
special monitoring programs.
Arizona — Population counts are based
on custody data and inmates in contracted
beds. The number of inmates housed in
private facilities increased. Interstate
cases are excluded.
Colorado — Population counts include
201 male inmates and 12 female inmates
in the Youthful Offender System.
Capacity figures exclude 6 privately run
facilities under contract with the Department of Corrections.
Federal — Custody counts include
inmates housed in secure facilities where
the BOP had a direct contract with a private operator or a sub-contract with a private provider at a local government facility.
Custody includes inmates held in nonsecure privately operated community corrections centers (or Halfway Houses) and
on home confinement.
Florida — Custody counts not comparable to 2005 estimates because some private facilities were inadvertently included
in the 2005 count. Jurisdiction counts are
not comparable to 2005 because inmates
with a sentence of 365 days were included
in counts for inmates with sentences of
more than 1 year instead of 1 year or less.
Iowa — Population counts are based on
custody data. Counts for inmates with a
sentence of more than 1 year include an
undetermined number of inmates with a
sentence of less than 1 year and unsentenced inmates. Iowa does not differentiate between these groups in its data system. Due to a change in reporting this
year, out of State inmates have been
included in jurisdiction counts.
Illinois — Population counts are based on
jurisdiction data. Counts of inmates with a
sentence of more than 1 year include an
undetermined number of inmates with a
sentence of 1 year.
Louisiana — Counts are as of December
27, 2006 and include 14,953 males and
1,244 females housed in local jails as a
result of a partnership with the Louisiana
Sheriffs’ Association and local authorities.
Custody and jurisdiction counts include
evacuees from Hurricane Katrina and
other pre-trial offenders from Orleans and

Jefferson parish jails. Due to the effects of
Hurricane Katrina, Orleans and Jefferson
parish prison capacities are down. Therefore, local jail population is down from the
2004 numbers.
Massachusetts — By law, offenders may
be sentenced to terms of up to 2 1⁄2 years
in locally operated jails and correctional
institutions. Such populations are included
in counts and rates for local jails and correctional institutions. About 6,200 inmates
with sentences of more than 1 year were
held in local jails. Jurisdiction and custody
counts include an undetermined number
of inmates who were remanded to court,
transferred to the custody of another
State, Federal, or locally operated system,
and subsequently released.
Minnesota — Counts include inmates
temporarily housed in local jails or private
contract facilities, or on work release and
community work crew programs.
Mississippi — Operational and design
capacities include private prison capacities.
Missouri — Custody and jurisdiction
counts for 2005 and 2006 are not comparable because 2 Community Release Centers were excluded in the 2005 data.
Design capacities are not available for
older prisons. Operational capacity is
defined as the number of available beds
including those temporarily offline. Missouri Department of Corrections does not
have updated design capacity for prison
extension or improvements.
Montana — Population counts include a
small number of inmates with unknown
sentence length.
Capacity figures include 2 county operated regional prisons (an estimated 300
beds), 1 private prison (500 beds), and a
State operated boot camp (60 beds).
New Jersey- Population counts of
inmates with a sentence of more than 1
year include an undetermined number of
inmates with sentences of 1 year. The
Department of Corrections has no jurisdiction over inmates with sentences of less
than 1 year or over unsentenced inmates.
Rated capacity figures are not maintained.

Oklahoma — Population counts for
inmates with sentences of less than 1 year
consist mainly of offenders ordered by the
court to the Delayed Sentencing Program
for Young Adults pursuant to 22 O.S. 996
through 996.3.
As of November 4, 1998, Oklahoma has 1
type of capacity which includes State prisons, private prisons, and contract jails.
Pennsylvania — As of May 31, 2004, the
Department began using a new capacity
reporting system based on design as well
as other critical factors such as facility
infrastructure, support services, and programming.
South Carolina — Population counts
include 36 inmates who were unsentenced, under safekeeping, or ICC status.
As of July 1, 2003, South Carolina Department of Corrections (SCDC) began
releasing inmates due for release and
housed in SCDC institutions on the 1st
day of each month. Since January 1,
2007, was a holiday, inmates eligible for
release on January 1 were released on
December 31, 2006. Therefore the inmate
count was at its lowest point for the month
on December 31, 2006.
Texas — Jurisdiction counts include
inmates serving time in a pre-parole transfer (PPT) or intermediary sanctions facility
(ISF), substance abuse felony punishment
facility (SAFPF), private facilities, halfway
houses, temporary releases to counties,
and paper-ready inmates in local jails.
Capacity figures exclude county jail beds.
Virginia — Rated capacity is the Department of Corrections’ count of beds, which
takes into account the number of inmates
that can be accommodated based on staff,
programs, services and design.
Washington — A recently revised law
allows increasing numbers of certain
inmates with sentences of less than 1 year
to be housed in prison.
Wisconsin — Operational capacity
excludes contracted local jails, Federal,
and other State and private facilities.
Counts include 943 offenders admitted as
temporary probation and parole placements.

North Carolina — Capacity figures refer
to standard operating capacity, based on
single occupancy per cell and 50 square
feet per inmate in multiple occupancy
units.
Prisoners in 2006

13

Appendix table 1. Growth in the number of prisoners under State jurisdiction 2000-2006, by rank in 2000
Change, 2000-2005
Average
Percent
12/31/06 annual change changea

Region and
jurisdiction

12/31/00

U.S. total
Stateb

1,391,261 1,527,929 1,570,861
1,238,389 1,340,311 1,377,815

12/31/05

Change, 2005-2006
Annual
change
Percent change

27,334
20,384

1.9%
1.6

42,932
37,504

2.8%
2.8

10 largest
Texas
California
Florida
New York
Michigan
Ohio
Illinois
Georgiac
Pennsylvania
Louisiana

726,356
166,719
163,001
71,319
70,199
47,718
45,833
45,281
44,232
36,847
35,207

759,721
169,003
170,676
89,768
62,743
49,546
45,854
44,919
48,749
42,380
36,083

783,962
172,116
175,512
92,969
63,315
51,577
49,166
45,106
52,792
44,397
37,012

6,673
457
1,535
3,690
-1,491
366
4
-72
903
1,107
175

0.9%
0.3
0.9
4.7
-2.2
0.8
0.0
-0.2
2.0
2.8
0.5

24,241
3,113
4,836
3,201
572
2,031
3,312
187
4,043
2,017
929

3.2%
1.8
2.8
3.6
0.9
4.1
7.2
0.4
8.3
4.8
2.6

2nd 10
North Carolina
Virginia
New Jersey
Missouri
Arizonac
Alabama
Maryland
Oklahoma
Tennessee
South Carolina

262,266
31,266
30,168
29,784
27,543
26,510
26,332
23,538
23,181
22,166
21,778

290,286
36,365
35,344
27,359
30,823
33,565
27,888
22,737
26,676
26,369
23,160

294,368
37,460
36,688
27,371
30,167
35,892
28,241
22,945
26,243
25,745
23,616

5,604
1,020
1,035
-485
656
1,411
311
-160
699
841
276

2.1%
3.1
3.2
-1.7
2.3
4.8
1.2
-0.7
2.8
3.5
1.2

4,082
1,095
1,344
12
-656
2,327
353
208
-433
-624
456

1.4%
3.0
3.8
0.0
-2.1
6.9
1.3
0.9
-1.6
-2.4
2.0

3rd 10
Wisconsin
Mississippi
Indiana
Connecticutd
Colorado
Kentucky
Washington
Arkansas
Massachusetts
Oregon

159,359
20,754
20,241
20,125
18,355
16,833
14,919
14,915
11,915
10,722
10,580

183,262
22,697
20,515
24,455
19,442
21,456
19,662
17,382
13,541
10,701
13,411

189,666
23,431
21,068
26,091
20,566
22,481
20,000
17,561
13,729
11,032
13,707

4,781
389
55
866
217
925
949
493
325
-4
566

2.8%
1.8
0.3
4.0
1.2
5.0
5.7
3.1
2.6
0.0
4.9

6,404
734
553
1,636
1,124
1,025
338
179
188
331
296

3.5%
3.2
2.7
6.7
5.8
4.8
1.7
1.0
1.4
3.1
2.2

4th 10
Nevada
Kansas
Iowac
Delawared
Minnesota
Utah
Idaho
New Mexico
Hawaiid
Alaskad

65,261
10,063
8,344
7,955
6,921
6,238
5,637
5,535
5,342
5,053
4,173

76,563
11,782
9,068
8,737
6,966
9,281
6,382
6,818
6,571
6,146
4,812

78,135
12,901
8,816
8,875
7,206
9,108
6,430
7,124
6,639
5,967
5,069

2,260
344
145
156
9
609
149
257
246
219
128

3.2%
3.2
1.7
1.9
0.1
8.3
2.5
4.3
4.2
4.0
2.9

1,572
1,119
-252
138
240
-173
48
306
68
-179
257

2.1%
9.5
-2.8
1.6
3.4
-1.9
0.8
4.5
1.0
-2.9
5.3

10 smallest
Nebraska
West Virginia
Rhode Islandd
Montana
South Dakota
New Hampshire
Vermontd
Wyoming
Maine
North Dakota

25,147
3,895
3,856
3,286
3,105
2,616
2,257
1,697
1,680
1,679
1,076

30,479
4,455
5,312
3,654
3,532
3,463
2,530
2,078
2,047
2,023
1,385

31,684
4,407
5,733
3,996
3,572
3,359
2,805
2,215
2,114
2,120
1,363

1,066
112
291
74
85
169
55
76
73
69
62

3.9%
2.7
6.6
2.1
2.6
5.8
2.3
4.1
4.0
3.8
5.2

1,205
-48
421
342
40
-104
275
137
67
97
-22

4.0%
-1.1
7.9
9.4
1.1
-3.0
10.9
6.6
3.3
4.8
-1.6

a

Average annual percentage increase.

bExcludes

D.C. prisoners.

cPopulation
d

based on custody counts.

Prisons and jails form one integrated system. Data include total jail and prison population.

14 Prisoners in 2006

Appendix table 2. Female inmates under jurisdiction of State or Federal correctional authorities, yearend 2000, 2005, 2006
Number of female inmates
2006

Change, 2000-2005
Average annual Percent
change
changea

107,626
12,422
95,204

112,498
12,975
99,523

2,878
435
2,443

2.9%
4.2
2.9

4,872
553
4,319

4.5%
4.5
4.5

68
7
60

9,082
1,406
66
663
120
1,650
3,280
1,579
238
80

9,202
1,489
129
788
133
1,449
2,802
2,029
231
152

9,730
1,594
145
846
172
1,428
2,859
2,249
280
157

24
17
13
25
3
-40
-96
90
-1
14

0.3%
1.2
14.3
3.5
2.1
-2.6
-3.1
5.1
-0.6
13.7

528
105
16
58
39
-21
57
220
49
5

5.7%
7.1
12.4
7.4
29.3
-1.4
2.0
10.8
21.2
3.3

29
44
20
13
23
32
28
34
13
33

Midwest
Illinois
Indiana
Iowa
Kansas
Michigan
Minnesota
Missouri
Nebraska
North Dakota
Ohio
South Dakota
Wisconsin

14,598
2,849
1,452
592
504
2,131
368
1,993
266
68
2,808
200
1,367

16,852
2,725
1,884
800
674
2,111
604
2,511
423
155
3,260
356
1,349

17,674
2,720
2,167
791
638
2,170
562
2,579
413
157
3,701
350
1,426

451
-25
86
42
34
-4
47
104
31
17
90
31
-4

2.9%
-0.9
5.3
6.2
6.0
-0.2
10.4
4.7
9.7
17.9
3.0
12.2
-0.3

822
-5
283
-9
-36
59
-42
68
-10
2
441
-6
77

4.9%
-0.2
15.0
-1.1
-5.3
2.8
-7.0
2.7
-2.4
1.3
13.5
-1.7
5.7

52
42
67
52
46
42
22
86
42
50
63
89
47

South
Alabama
Arkansas
Delawarec
District of Columbiad
Floridae
Georgia
Kentucky
Louisiana
Maryland
Mississippi
North Carolina
Oklahoma
South Carolina
Tennessee
Texas
Virginia
West Virginia

39,652
1,826
772
597
356
4,105
2,758
1,061
2,219
1,219
1,669
1,903
2,394
1,420
1,369
13,622
2,059
303

45,240
1,965
1,146
558
~
6,153
2,893
2,004
2,309
1,097
1,786
2,589
2,550
1,514
2,022
13,506
2,668
480

47,112
2,050
1,042
573
~
6,489
3,557
2,058
2,389
1,081
1,789
2,686
2,571
1,603
1,958
13,799
2,893
574

1,118
28
75
-8
~
410
27
189
18
-24
23
137
31
19
131
-23
122
35

2.8%
1.5
8.2
-1.3
~
8.4
1.0
13.6
0.8
-2.1
1.4
6.4
1.3
1.3
8.1
-0.2
5.3
9.6

1,872
85
-104
15
~
336
664
54
80
-16
3
97
21
89
-64
293
225
94

4.1%
4.3
-9.1
2.7
~
5.5
23.0
2.7
3.5
-1.5
0.2
3.7
0.8
5.9
-3.2
2.2
8.4
19.6

77
82
72
52
~
70
74
92
108
35
103
41
129
66
63
97
74
61

Region and jurisdiction

2000

U.S. total
Federal
State

93,234
10,245
82,989

Northeast
Connecticutc
Maine
Massachusetts
New Hampshire
New Jersey
New York
Pennsylvania
Rhode Islandc
Vermontc

2005

Change, 2005-2006
Annual
Percent
change
change

Incarceration
rate, 2006b

Prisoners in 2006

15

Appendix table 2. Female inmates under jurisdiction of State or Federal correctional authorities, yearend 2000, 2005, 2006
(cont.)
Number of female inmates
Region and jurisdiction

2000

2005

2006

West
Alaskac
Arizona
California
Colorado
Hawaiic
Idaho
Montana
Nevada
New Mexico
Oregon
Utah
Washington
Wyoming

19,657
284
1,964
11,161
1,333
561
493
306
846
511
596
381
1,065
156

23,910
465
2,902
11,667
2,120
732
791
356
944
666
1,015
575
1,455
222

25,007
518
3,156
11,977
2,302
734
777
361
1,136
667
1,020
620
1,496
243

Change, 2000-2005
Average annual Percent
change
changea
851
36
188
101
157
34
60
10
20
31
84
39
78
13

4.0%
10.4
8.1
0.9
9.7
5.5
9.9
3.1
2.2
5.4
11.2
8.6
6.4
7.3

Change, 2005-2006
Annual
Percent
change
change
1,097
53
254
310
182
2
-14
5
192
1
5
45
41
21

4.6%
11.4
8.7
2.7
8.6
0.3
-1.8
1.4
20.3
0.2
0.5
7.8
2.8
9.5

Incarceration
rate, 2006b
67
74
82
63
97
77
106
76
91
63
54
47
46
95

~Not applicable. See footnote d.
a

Average annual percentage increase.

bThe

number of prisoners with a sentence of more than 1 year per 100,000 U.S. residents. Data based on January 1, 2007, Census
Population Estimates.

cPrisons
d
e

and jails form one integrated system. Data include total jail and prison population.

D.C. prisoners were transferred to the Federal Bureau of Prisons in 2001.
Growth since 2000 may be slightly overestimated due to a change in reporting from custody to jurisdiction counts.

16 Prisoners in 2006

Appendix table 3. Male inmates under the jurisdiction of State or Federal correctional authorities, yearend 2000, 2005, 2006
Number of male inmates
Region and jurisdiction

Change, 2005-2006
Annual
Percent
change
change

Incarceration
rate, 2006b

2000

2005

1,298,027
135,171
1,162,856

1,420,303
175,196
1,245,107

1,458,363
180,071
1,278,292

24,455
8,005
16,450

1.8%
5.9%
1.4

38,060
4,875
33,185

2.7%
2.8%
2.7

943
110
835

Northeast
Connecticutc
Maine
Massachusettsd
New Hampshire
New Jersey
New York
Pennsylvania
Rhode Islandc
Vermontc

165,744
16,949
1,613
10,059
2,137
28,134
66,919
35,268
3,048
1,617

163,708
17,953
1,894
9,913
2,397
25,910
59,941
40,351
3,423
1,926

168,087
18,972
1,975
10,186
2,633
25,943
60,456
42,148
3,716
2,058

-407
201
56
-29
52
-445
-1,396
1,017
75
62

-0.2%
1.2
3.3
-0.3
2.3
-1.6
-2.2
2.7
2.3
3.6

4,379
1,019
81
273
236
33
515
1,797
293
132

2.7%
5.7
4.3
2.8
9.8
0.1
0.9
4.5
8.6
6.9

593
758
288
489
397
607
643
690
404
497

Midwest
Illinois
Indiana
Iowa
Kansas
Michigan
Minnesota
Missouri
Nebraska
North Dakota
Ohio
South Dakota
Wisconsin

222,780
42,432
18,673
7,363
7,840
45,587
5,870
25,550
3,629
1,008
43,025
2,416
19,387

237,831
42,194
22,571
7,937
8,394
47,435
8,677
28,312
4,032
1,230
42,594
3,107
21,348

243,792
42,386
23,924
8,084
8,178
49,407
8,546
27,588
3,994
1,206
45,465
3,009
22,005

3,010
-48
780
115
111
370
561
552
81
44
-86
138
392

1.3%
-0.1
3.9
1.5
1.4
0.8
8.1
2.1
2.1
4.1
-0.2
5.2
1.9

5,961
192
1,353
147
-216
1,972
-131
-724
-38
-24
2,871
-98
657

2.5%
0.5
6.0
1.9
-2.6
4.2
-1.5
-2.6
-0.9
-2.0
6.7
-3.2
3.1

740
668
765
545
594
994
331
962
435
377
811
764
742

South
Alabama
Arkansas
Delawarec
District of Columbiae
Floridaf
Georgia
Kentucky
Louisiana
Maryland
Mississippi
North Carolina
Oklahoma
South Carolina
Tennessee
Texas
Virginia
West Virginia

521,562
24,506
11,143
6,324
7,100
67,214
41,474
13,858
32,988
22,319
18,572
29,363
20,787
20,358
20,797
153,097
28,109
3,553

562,898
25,923
12,395
6,408
~
83,615
45,856
17,658
33,774
21,640
18,729
33,776
24,126
21,646
24,347
155,497
32,676
4,832

576,451
26,191
12,687
6,633
~
86,480
49,235
17,942
34,623
21,864
19,279
34,774
23,672
22,013
23,787
158,317
33,795
5,159

8,267
283
250
17
~
3,280
876
760
157
-136
31
883
668
258
710
480
913
256

1.6%
1.1
2.2
0.3
~
4.5
2.0
5.0
0.5
-0.6
0.2
2.8
3.0
1.2
3.2
0.3
3.1
6.3

13,553
268
292
225
~
2,865
3,379
284
849
224
550
998
-454
367
-560
2,820
1,119
327

2.4%
1.0
2.4
3.5
~
3.4
7.4
1.6
2.5
1.0
2.9
3.0
-1.9
1.7
-2.3
1.8
3.4
6.8

1,033
1,140
914
951
~
964
1,057
847
1,624
781
1,248
692
1,215
1,008
801
1,274
894
578

U.S. total
Federal
State

2006

Change, 2000-2005
Average annual Percent
change
changea

Prisoners in 2006

17

Appendix table 3. Male inmates under the jurisdiction of State or Federal correctional authorities, yearend 2000, 2005, 2006
(cont.)
Number of male inmates
Region and jurisdiction

2000

West
Alaskac
Arizona
California
Colorado
Hawaiic
Idaho
Montana
Nevada
New Mexico
Oregon
Utah
Washington
Wyoming

252,770
3,889
24,546
151,840
15,500
4,492
5,042
2,799
9,217
4,831
9,984
5,256
13,850
1,524

2005
280,670
4,347
30,663
159,009
19,336
5,414
6,027
3,176
10,838
5,905
12,396
5,807
15,927
1,825

2006

Change, 2000-2005
Average annual Percent
change
changea

289,962
4,551
32,736
163,535
20,179
5,233
6,347
3,211
11,765
5,972
12,687
5,810
16,065
1,871

5,580
92
1,223
1,434
767
184
197
75
324
215
482
110
415
60

2.1%
2.3
4.6
0.9
4.5
3.8
3.6
2.6
3.3
4.1
4.4
2.0
2.8
3.7

Change, 2005-2006
Annual
Percent
change
change
9,292
204
2,073
4,526
843
-181
320
35
927
67
291
3
138
46

3.3%
4.7
6.8
2.8
4.4
-3.3
5.3
1.1
8.6
1.1
2.3
0.1
0.9
2.5

Incarceration
rate, 2006b
806
824
934
887
836
597
850
671
902
589
683
442
498
711

~Not applicable. See footnote d.
a
b

Average annual percentage increase.
The number of prisoners with a sentence of more than 1 year per 100,000 U.S. residents. Data based on January 1, 2007, census estimates.

cPrisons

and jails form one integrated system. Data include total jail and prison population.

dIncarceration
e

rate includes 6,200 male inmates sentenced to more than 1 year, but held in local jails or houses of correction.

D.C. prisoners were transferred to the Federal Bureau of Prisons in 2001.

fGrowth

since 2000 may be slightly overestimated due to a change in reporting from custody to jurisdiction counts.

18 Prisoners in 2006

Appendix table 4. Number of State and Federal prisoners held in private facilities or local jails, yearend 2005 and 2006

Region and jurisdiction

2005

Private facilities
Percent of
2006
inmatesa

Local jails
2005

2006

Percent of
inmatesa

107,940
27,046
80,894

113,791
27,726
86,065

7.2%
14.4%
6.2

73,164
1,044
72,120

77,987
2,010
75,977

5.0%
1.0%
5.3

Northeast
Connecticut
Maine
Massachusetts
New Hampshire
New Jersey
New York
Pennsylvania
Rhode Island
Vermont

3,580
0
20
0
0
2,600
0
503
0
457

4,107
0
19
0
0
2,602
0
962
0
524

2.3%
0.0
0.9
0.0
0.0
9.5
0.0
2.2
0.0
23.7

1,990
~
0
212
13
1,754
11
0
~
~

2,022
~
0
177
13
1,821
11
0
~
~

1.1%
~
0.0
1.6
0.5
6.7
0.0
0.0
~
~

Midwest
Illinois
Indiana
Iowa
Kansas
Michigan
Minnesota
Missouri
Nebraska
North Dakota
Ohio
South Dakota
Wisconsin

3,514
0
622
0
0
0
760
0
0
47
2,075
10
0

4,387
0
1,290
0
0
0
979
0
0
0
2,080
12
26

1.7%
0.0
4.9
0.0
0.0
0.0
10.7
0.0
0.0
0.0
4.2
0.4
0.1

3,238
0
1,773
0
0
53
674
0
0
45
0
99
594

2,545
0
1,180
0
0
62
508
0
0
48
0
61
686

1.0%
0.0
4.5
0.0
0.0
0.1
5.6
0.0
0.0
3.5
0.0
1.8
2.9

South
Alabama
Arkansas
Delaware
Florida
Georgia
Kentucky
Louisiana
Maryland
Mississippi
North Carolina
Oklahoma
South Carolina
Tennessee
Texas
Virginia
West Virginia

51,823
320
0
0
6,261
4,778
2,224
2,952
129
4,779
210
5,908
14
5,162
17,517
1,569
0

53,205
9
0
0
6,350
5,075
2,507
3,066
121
4,860
194
5,708
13
5,126
18,627
1,549
0

8.5%
0.0
0.0
0.0
6.8
9.6
12.5
8.3
0.5
23.1
0.5
21.8
0.1
19.9
10.8
4.2
0.0

60,621
2,281
1,056
~
41
4,948
5,674
16,183
142
4,426
0
1,850
384
7,112
10,569
4,679
1,276

65,212
1,160
842
~
34
4,970
5,921
16,230
162
4,684
0
1,955
381
6,451
15,091
5,965
1,366

10.5%
4.1
6.1
~
0.0
9.4
29.6
43.9
0.7
22.2
0.0
7.4
1.6
25.1
8.8
16.3
23.8

West
Alaska
Arizona
California
Colorado
Hawaii
Idaho
Montana
Nevada
New Mexico
Oregon
Utah
Washington
Wyoming

21,977
1,365
4,800
2,801
4,039
1,902
1,596
895
0
2,843
0
0
890
846

24,366
1,681
5,213
3,147
4,855
1,915
1,925
963
0
2,930
0
0
954
783

7.7%
33.2
14.5
1.8
21.6
32.1
27.0
26.9
0.0
44.1
0.0
0.0
5.4
37.0

6,271
~
185
2,518
393
~
569
687
148
122
48
1,246
332
23

6,198
~
42
2,468
430
~
459
682
148
140
55
1,328
424
22

2.0%
~
0.1
1.4
1.9
~
6.4
19.1
1.1
2.1
0.4
20.7
2.4
1.0

U.S. total
Federalb
State

~Not applicable. Prison and jails form an integrated system.
a
b

Based on the total number of inmates under jurisdiction.
Includes Federal inmates held in non-secure privately operated facilities (7,144 in 2005 and 7,463 in 2006).

Prisoners in 2006

19

Appendix table 5. Reported State and Federal prison capacities, yearend 2006
Region and jurisdiction
Federal

Type of capacity measure
Rated
Operational
Design

Custody population as a percent of—
Highest capacitya Lowest capacitya

119,243

...

...

137%

137%

Northeast
Connecticutb
Maine
Massachusetts
New Hampshire
New Jersey
New York
Pennsylvania
Rhode Island
Vermont

...
1,885
...
2,354
...
59,962
38,547
3,892
1,732

...
1,885
...
...
23,357
61,388
38,547
3,892
1,732

...
1,885
7,802
2,354
16,876
57,763
38,547
4,085
1,371

...
110%
138
114
98
104
112
91
98

...
110%
138
114
136
110
112
95
123

Midwest
Illinois
Indiana
Iowa
Kansas
Michigan
Minnesota
Missouri
Nebraska
North Dakota
Ohio
South Dakota
Wisconsinc

33,971
...
...
9,397
...
...
...
...
1,044
37,610
...
...

33,971
24,808
...
...
51,986
7,955
30,797
3,969
991
...
3,594
17,412

59,959
...
7,256
...
...
...
...
3,175
1,044
...
...
...

75%
95
122
94
99
99
98
111
128
123
92
130

133%
95
122
94
99
99
98
139
135
123
92
130

...
12,516
5,772
...
...
...
20,815
...
...
...
24,919
...
20,122
162,508
31,741
3,655

25,310
13,189
5,359
91,789
55,984
13,752
20,352
23,430
22,116
33,366
24,919
23,450
19,670
158,902
...
4,346

12,686
12,516
4,423
69,471
...
...
...
...
22,116
...
24,919
...
...
162,508
...
3,775

95%
97
122
92
103
95
115
97
74
113
92
98
70
86
92
101

190%
103
159
121
103
95
117
97
74
113
92
98
72
88
92
119

3,058
31,200
...
...
...
6,075
...
11,061
...
...
...
13,171
1,511

3,206
35,514
168,150
14,360
3,487
5,771
2,521
10,811
6,885
13,188
6,429
15,114
1,436

...
29,351
83,551
13,027
2,451
6,075
...
8,326
6,419
13,188
6,639
15,114
1,428

105%
86
103
120
147
116
114
115
54
100
76
111
83

110%
104
206
132
103
115
114
153
58
100
78
128
88

South
Alabamad
Arkansas
Delaware
Floridae
Georgiae
Kentucky
Louisianae
Maryland
Mississippie
North Carolinad
Oklahomae
South Carolina
Tennessee
Texasc
Virginia
West Virginia
West
Alaska
Arizona
California
Colorado
Hawaii
Idahoe
Montanac
Nevada
New Mexicoe
Oregon
Utah
Washington
Wyoming
...Data not available.
aPopulation

counts are based on the number of inmates held in facilities operated by the jurisdiction.
Excludes inmates held in local jails, in other States, or in private facilities.

bConnecticut
cExcludes
d

no longer reports capacity because of a law passed in 1995.

capacity of county facilities and inmates housed in them.

Capacity definition differs from BJS definition, see Jurisdiction notes.

eIncludes

capacity of private and contract facilities and inmates housed in them.

20 Prisoners in 2006

Appendix table 6. Number of sentenced prisoners under jurisdiction of State or Federal correctional authorities,
yearend 2000, 2005, and 2006
Change, 2000-2005
Average annual Percent
12/31/06 change
changea

Region and
jurisdiction

12/31/00

U.S. total
Federal
State

1,331,278 1,462,866 1,502,179
125,044
166,173
173,533
1,206,234 1,296,693 1,328,646

12/31/05

Change, 2005-2006
Annual
Percent
change
change

Incarceration
rate, 2006b

26,318
8,226
18,092

1.9%
6.6
1.5

39,313
7,360
31,953

2.7%
4.4
2.5

501
58
445

Northeast
Connecticutc
Maine
Massachusettsd
New Hampshire
New Jerseye
New York
Pennsylvania
Rhode Islandc
Vermontc

166,632
13,155
1,635
9,479
2,257
29,784
70,199
36,844
1,966
1,313

162,383
13,121
1,905
9,081
2,520
27,359
62,485
42,345
2,025
1,542

166,078
13,746
1,997
9,472
2,737
27,371
62,974
43,998
2,149
1,634

-850
-7
54
-80
53
-485
-1,543
1,100
12
46

-0.5%
-0.1
3.1
-0.9
2.2
-1.7
-2.3
2.8
0.6
3.3

3,695
625
92
391
217
12
489
1,653
124
92

2.3%
4.8
4.8
4.3
8.6
0.0
0.8
3.9
6.1
6.0

303
392
151
243
207
313
326
353
202
262

Midwest
Illinoise
Indiana
Iowae,f
Kansase
Michigan
Minnesota
Missourie
Nebraska
North Dakota
Ohioe
South Dakota
Wisconsin

236,458
45,281
19,811
7,955
8,344
47,718
6,238
27,519
3,816
994
45,833
2,613
20,336

253,662
44,919
24,416
8,737
9,068
49,546
9,281
30,803
4,330
1,327
45,854
3,454
21,927

259,610
45,106
26,055
8,838
8,816
51,577
9,108
30,146
4,204
1,363
49,166
3,350
21,881

3,441
-72
921
156
145
366
609
657
103
67
4
168
318

1.4%
-0.2
4.3
1.9
1.7
0.8
8.3
2.3
2.6
5.9
0.0
5.7
1.5

5,948
187
1,639
101
-252
2,031
-173
-657
-126
36
3,312
-104
-46

2.3%
0.4
6.7
1.2
-2.8
4.1
-1.9
-2.1
-2.9
2.7
7.2
-3.0
-0.2

391
350
411
296
318
511
176
514
237
214
428
426
393

South
Alabama
Arkansas
Delawarec
District of Columbiag
Florida
Georgiaf
Kentucky
Louisiana
Maryland
Mississippi
North Carolina
Oklahomae
South Carolina
Tennesseee
Texas
Virginia
West Virginia

538,997
26,034
11,851
3,937
5,008
71,318
44,141
14,919
35,207
22,490
19,239
27,043
23,181
21,017
22,166
158,008
29,643
3,795

584,301
27,003
13,383
3,972
~
89,766
48,741
19,215
36,083
22,143
19,335
31,522
24,414
22,464
26,369
159,255
35,344
5,292

597,828
27,526
13,713
4,195
~
92,874
52,781
19,514
36,376
22,316
19,219
32,219
23,889
22,861
25,745
162,193
36,688
5,719

9,061
194
306
7
~
3,690
920
859
175
-69
19
896
247
289
841
249
1,140
299

1.7%
0.7
2.5
0.2
~
4.7
2.0
5.2
0.5
-0.3
0.1
3.1
1.0
1.3
3.5
0.2
3.6
6.9

13,527
523
330
223
~
3,108
4,040
299
293
173
-116
697
-525
397
-624
2,938
1,344
427

2.3%
1.9
2.5
5.6
~
3.5
8.3
1.6
0.8
0.8
-0.6
2.2
-2.2
1.8
-2.4
1.8
3.8
8.1

547
595
485
488
~
509
558
462
846
396
658
360
664
525
423
683
477
314

Prisoners in 2006

21

Appendix table 6. Number of sentenced prisoners under jurisdiction of State or Federal correctional authorities,
yearend 2000, 2005, and 2006 (cont.)
Region and
jurisdiction
West
Alaskac
Arizonaf
California
Coloradoe
Hawaiic
Idaho
Montana
Nevada
New Mexico
Oregon
Utah
Washington
Wyoming

12/31/00

12/31/05

264,147
2,128
25,412
160,412
16,833
3,553
5,535
3,105
10,063
4,666
10,553
5,541
14,666
1,680

296,347
2,781
31,411
168,982
21,456
4,422
6,818
3,509
11,644
6,292
13,390
6,275
17,320
2,047

Change, 2000-2005
Average annual Percent
12/31/06 change
changea
305,130
3,116
31,830
173,942
22,481
4,373
7,124
3,547
12,753
6,361
13,667
6,339
17,483
2,114

6,440
131
1,200
1,714
925
174
257
81
316
325
567
147
531
73

Change, 2005-2006
Annual
Percent
change
change

2.3%
5.5
4.3
1.0
5.0
4.5
4.3
2.5
3.0
6.2
4.9
2.5
3.4
4.0

8,783
335
419
4,960
1,025
-49
306
38
1,109
69
277
64
163
67

3.0%
12.0
1.3
2.9
4.8
-1.1
4.5
1.1
9.5
1.1
2.1
1.0
0.9
3.3

Incarceration
rate, 2006b
437
462
509
475
469
338
480
374
503
323
367
246
271
408

Note: Sentenced prisoner is defined as a prisoner sentenced to more than 1 year.
~Not applicable. See footnote g.
aAverage
b

annual percentage increase.

The number of prisoners with a sentence of more than 1 year per 100,000 U.S. residents.

cPrisons
d

and jails form one integrated system. Data include total jail and prison population.

The incarceration rate includes an estimated 6,200 inmates sentenced to more than 1 year, but held in local jails or houses of
corrections.

eIncludes
f

some inmates sentenced to 1 year or less.

Population figures based on custody counts.

gD.C.

prisoners were transferred to the Federal Bureau of Prisons in 2001.

22 Prisoners in 2006

Appendix table 7. Estimated number of sentenced prisoners under State or Federal
jurisdiction, by gender, race, Hispanic origin, and age, yearend 2006
b

Malea

c

Age group

Total

White

Total
18-19
20-24
25-29
30-34
35-39
40-44
45-54
55 or older

1,399,100
22,100
197,500
245,000
227,700
213,800
197,600
216,700
76,500

478,000
6,300
58,500
68,300
68,200
72,800
75,100
88,300
40,100

c

b

Black

Hispanic

Total

534,200
9,000
77,500
99,200
90,900
82,600
74,100
78,900
21,100

290,500
4,900
46,600
60,000
53,200
44,100
35,000
34,800
11,500

103,100
1,000
11,500
16,100
17,200
19,300
17,900
16,200
3,700

Femalea
Whitec
Blackc
49,100
400
5,400
7,500
8,200
9,100
8,700
7,700
2,200

28,600
300
2,900
4,300
4,700
5,500
5,200
4,700
800

Hispanic
17,500
200
2,400
3,300
3,000
3,200
2,500
2,300
500

Note: State sentenced prisoner counts are based on estimates by gender, race, Hispanic origin, and age from
the 2004 Survey of Inmates in State Correctional Facilities and updated from jurisdiction counts by gender at
yearend 2006. Federal sentenced prisoner counts are based on data from the BJS Federal Justice Statistics
Program for September 30, 2006 and updated from jurisdiction counts at yearend 2006.
a

Sentenced prisoners are limited to those sentenced to more than 1 year.

bTotal

includes American Indians, Alaskan Natives, Asians, Native Hawaiians, other Pacific Islanders, and persons identifying two or more races.

c

Excludes Hispanics and persons identifying two or more races.

Appendix table 8. Estimated number of sentenced prisoners under State or Federal jurisdiction
per 100,000 U.S. residents, by gender, race, Hispanic origin, and age, yearend 2006
Age group
Total
18-19
20-24
25-29
30-34
35-39
40-44
45-54
55 or older

All malesb
943
515
1,800
2,302
2,270
1,997
1,755
1,012
248

Malea
Whitec
487
236
877
1,103
1,159
1,071
989
566
162

Blackc
3,042
1,454
5,153
7,384
7,657
6,685
5,705
3,436
820

Hispanic
1,261
670
2,277
2,573
2,480
2,326
2,120
1,515
510

All femalesb
68
23
113
159
177
183
158
73
10

Femalea
Whitec
48
15
85
122
142
135
114
49
7

Blackc
148
44
200
304
360
399
352
177
23

Hispanic
81
31
142
179
165
194
168
103
18

Note: Based on estimates of the U.S. resident population on January 1, 2007, by gender, race, Hispanic origin,
and age. Detailed categories exclude persons identifying two or more races.
a

Sentenced prisoners are limited to those serving sentences of more than 1 year.

bIncludes

American Indians, Alaska Natives, Asians, Native Hawaiians, other Pacific Islanders, and persons
identifying two or more races.
cExcludes

Hispanics and persons identifying two or more races.

Prisoners in 2006

23

Appendix table 9. Estimated number of sentenced prisoners under State
jurisdiction, by offense, gender, race, and Hispanic origin, yearend 2004
All inmates

Male

Female

Whitea

Blacka

Hispanic

1,274,600

1,188,800

85,800

445,400

492,300

242,700

Violent
Murderb
Manslaughter
Rape
Other sexual assault
Robbery
Assault
Other violent

633,700
151,500
17,700
59,700
94,100
178,900
129,400
32,300

634,500
143,000
16,000
59,300
92,900
171,700
121,700
29,900

29,100
8,500
1,700
400
1,300
7,200
7,600
2,400

221,900
44,500
7,000
28,800
51,400
37,800
40,100
12,300

260,800
62,900
6,500
19,500
19,100
93,600
48,100
11,300

130,500
30,800
2,900
7,400
20,000
31,200
32,100
6,200

Property
Burglary
Larceny
Motor vehicle theft
Fraud
Other property

265,600
135,700
50,400
22,300
32,600
24,600

239,100
130,100
42,100
20,900
23,200
22,800

26,500
5,600
8,300
1,400
9,400
1,800

116,900
57,400
21,600
8,700
17,100
12,100

87,600
46,100
17,900
6,200
10,100
7,300

43,200
23,500
7,200
6,200
2,800
3,600

Drug offenses

249,400

224,800

24,600

65,900

112,500

51,800

88,900

84,200

4,700

37,800

29,100

15,900

6,900

6,200

800

3,000

2,200

1,200

Total

Public-order

offensesc

Other/unspecified

d

Note: Data are for inmates sentenced to more than 1 year under the jurisdiction of state correctional authorities. The estimates for gender were based upon jurisdiction counts at yearend (NPS1B). The estimates by race and Hispanic origin were based on data from the 2004 Survey of
Inmates in State Correctional Facilities and updated by yearend jurisdiction counts; estimates
within offense categories were based upon offense distributions from the National Corrections
Reporting Program, 2004, updated by yearend jurisdiction counts. All estimates were rounded to
the nearest 100. Detail may not add to total due to rounding.
a
b

Excludes Hispanics.
Includes negligent manslaughter.

cIncludes

weapons, drunk driving, court offenses, commercialized vice, morals and decency
offenses, liquor law violations, and other public-order offenses.
dIncludes

juvenile offenses and other unspecified offense categories.

24 Prisoners in 2006

Appendix table 10. Estimated percent of sentenced prisoners under State jurisdiction,
by offense, gender, race, and Hispanic origin, yearend 2004
Offense

All inmates

Total

Male

Female

Whitea

Blacka

Hispanic

100%

100%

100%

100%

100%

100%

Violent
Murderb
Manslaughter
Rape
Other sexual assault
Robbery
Assault
Other violent

52.1%
11.9
1.4
4.7
7.4
14.1
10.1
2.5

53.4 %
12.0
1.3
5.0
7.8
14.4
10.2
2.5

34.0%
9.9
2.0
0.5
1.5
8.4
8.9
2.8

49.8%
10.0
1.6
6.5
11.6
8.5
9.0
2.8

53.0%
12.8
1.3
4.0
3.9
19.0
9.8
2.3

53.8%
12.7
1.2
3.0
8.2
12.9
13.2
2.5

Property
Burglary
Larceny
Motor vehicle theft
Fraud
Other property

20.8%
10.6
4.0
1.8
2.6
1.9

20.1%
10.9
3.5
1.8
2.0
1.9

30.9%
6.5
9.7
1.6
10.9
2.1

26.2%
12.9
4.8
2.0
3.8
2.7

17.8%
9.4
3.6
1.3
2.0
1.5

17.8%
9.7
2.9
2.6
1.2
1.5

Drug offenses

19.6%

18.9%

28.7%

14.8%

22.9%

21.4%

7.0%

7.1%

5.5%

8.5%

5.9%

6.5%

0.5%

0.5%

0.9%

0.7%

0.5%

0.5%

Public-order

offensesc
d

Other/unspecified

Note: Data are for inmates with a sentence of more than 1 year under the jurisdiction of State correctional authorities.
Detail may not add to total due to rounding.
a

Excludes Hispanics.

bIncludes
cIncludes

negligent manslaughter.

weapons, drunk driving, court offenses, commercialized vice, morals and decency offenses, liquor law
violations, and other public-order offenses.
dIncludes

juvenile offenses and other unspecified offense categories.

Appendix table 11. Prisoners in custody of correctional authorities in the U.S. territories and commonwealths,
yearend 2005 and 2006
Total
Jurisdiction
Total
American Samoa
Guam
Commonwealth of the
Northern Marina Islands
Commonwealth of Puerto Rico
U.S. Virgin Islands

2005

2006

15,735
222
505

15,205
210
495

149
14,263
596

126
13,788
586

Percent change,
2005-2006
-3.4%
-5.4
-2.0
-15.4
-3.3
-1.7

2005

Sentenced to more than 1 year
Percent change, Incarceration
2006
2005-2006
rate, 2006*

12,399
174
238

11,743
113
337

-5.3%
-35.1
41.6

301
139

83
11,469
435

76
10,789
428

-8.4
-5.9
-1.6

101
292
401

*The number of prisoners with a sentence of more than 1 year per 100,000 persons in the resident population. July 1, 2006 population
estimates were provided by the U.S. Census Bureau, International Data Base.

Prisoners in 2006

25

Appendix table 12. Prisoners under military jurisdiction, by branch of service,
yearend 2005 and 2006
Total
Branch of service
Total
To which prisoners belonged
Air Force
Army
Marine Corps
Navy
Coast Guard
Holding prisoners
Air Force
Army
Marine Corps
Navy

2005

2006

Percent change,
2005-06

2,322

1,944

-16.3%

422
949
527
406
18

328
880
407
315
14

120
1,059
470
673

92
996
329
527

1,340

1,135

-22.3
-7.3
-22.8
-22.4
-22.2

258
638
209
223
12

215
542
167
201
10

-16.7
-15.0
-20.1
-9.9
-16.7

-23.3
-5.9
-30.0
-21.7

24
818
133
365

20
711
98
306

-16.7
-13.1
-26.3
-16.2

Appendix table 13. Number of sentenced inmates in Federal
prisons, by most serious offense, 2000, 2003, 2006
Offense
Total
Violent offensesa
Homicide
Robbery
Other violent
Property
Burglary
Fraud
Other property
Drug offenses
Public-order
offenses
Immigration
Weapons
Other
Other/unspecifiedb

Number of sentenced inmates
in Federal prisons
2000
2003
2006

Percent change,
2000-2006

131,739
13,740
1,363
9,712
2,665
10,135
462
7,506
2,167
74,276

158,426
16,688
2,632
10,398
3,658
11,283
567
8,241
2,475
86,972

176,268
16,507
2,923
9,645
3,939
10,015
519
6,437
3,059
93,751

33.8%
20.1%
114.5
-0.7
47.8
-1.2%
12.3
-14.2
41.2
26.2%

32,325
13,676
10,822
7,827
1,263

42,325
16,903
16,377
9,045
1,158

54,336
19,496
24,298
10,542
1,659

68.1%
42.6
124.5
34.7
31.4%

Note: All data are from the BJS Federal Justice Statistics Program.
Data are for September 30 and based on all sentenced inmates,
regardless of sentence length.

aIncludes

murder, non-negligent manslaughter, and manslaughter by
negligence.

b

Includes offenses not classified.

26 Prisoners in 2006

Sentenced to more than 1 year
Percent change,
2005
2006
2005-06
-15.3%