
Bojs Profile of State Prisoners Under 18 2000
Download original document:
Document text
Document text
This text is machine-read, and may contain errors. Check the original document to verify accuracy.
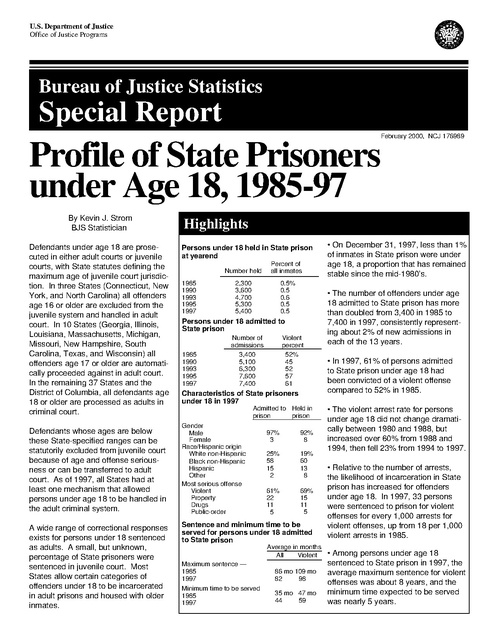
U.S. Department of Justice Office of Justice Programs Bureau of Justice Statistics Special Report February 2000, NCJ 176989 Profile of State Prisoners under Age 18, 1985-97 By Kevin J. Strom BJS Statistician Defendants under age 18 are prosecuted in either adult courts or juvenile courts, with State statutes defining the maximum age of juvenile court jurisdiction. In three States (Connecticut, New York, and North Carolina) all offenders age 16 or older are excluded from the juvenile system and handled in adult court. In 10 States (Georgia, Illinois, Louisiana, Massachusetts, Michigan, Missouri, New Hampshire, South Carolina, Texas, and Wisconsin) all offenders age 17 or older are automatically proceeded against in adult court. In the remaining 37 States and the District of Columbia, all defendants age 18 or older are processed as adults in criminal court. Defendants whose ages are below these State-specified ranges can be statutorily excluded from juvenile court because of age and offense seriousness or can be transferred to adult court. As of 1997, all States had at least one mechanism that allowed persons under age 18 to be handled in the adult criminal system. A wide range of correctional responses exists for persons under 18 sentenced as adults. A small, but unknown, percentage of State prisoners were sentenced in juvenile court. Most States allow certain categories of offenders under 18 to be incarcerated in adult prisons and housed with older inmates. Highlights Persons under 18 held in State prison at yearend 1985 1990 1993 1995 1997 Number held Percent of all inmates 2,300 3,600 4,700 5,300 5,400 0.5% 0.5 0.6 0.5 0.5 Persons under 18 admitted to State prison 1985 1990 1993 1995 1997 Number of admissions 3,400 5,100 6,300 7,600 7,400 Violent percent 52% 45 52 57 61 Characteristics of State prisoners under 18 in 1997 Admitted to Held in prison prison Gender Male Female Race/Hispanic origin White non-Hispanic Black non-Hispanic Hispanic Other Most serious offense Violent Property Drugs Public-order 97% 3 92% 8 25% 58 15 2 19% 60 13 8 61% 22 11 5 69% 15 11 5 Sentence and minimum time to be served for persons under 18 admitted to State prison Average in months All Violent Maximum sentence — 1985 1997 Minimum time to be served 1985 1997 86 mo 109 mo 82 98 35 mo 47 mo 44 59 • On December 31, 1997, less than 1% of inmates in State prison were under age 18, a proportion that has remained stable since the mid-1980’s. • The number of offenders under age 18 admitted to State prison has more than doubled from 3,400 in 1985 to 7,400 in 1997, consistently representing about 2% of new admissions in each of the 13 years. • In 1997, 61% of persons admitted to State prison under age 18 had been convicted of a violent offense compared to 52% in 1985. • The violent arrest rate for persons under age 18 did not change dramatically between 1980 and 1988, but increased over 60% from 1988 and 1994, then fell 23% from 1994 to 1997. • Relative to the number of arrests, the likelihood of incarceration in State prison has increased for offenders under age 18. In 1997, 33 persons were sentenced to prison for violent offenses for every 1,000 arrests for violent offenses, up from 18 per 1,000 violent arrests in 1985. • Among persons under age 18 sentenced to State prison in 1997, the average maximum sentence for violent offenses was about 8 years, and the minimum time expected to be served was nearly 5 years. States utilize three general types of transfer mechanisms States use different provisions for transferring persons under age 18 to criminal court. These include statutory exclusion laws, prosecutorial direct-file provisions, and judicial waiver. As documented in State Legislative Responses to Violent Juvenile Crime: 1996-97 Update by Patricia Torbet and Linda Szymanski (NCJ 172835), all but 10 States modified their transfer statutes from 1992 to 1995. Statutory exclusion laws (also called mandatory transfer) automatically exclude certain offenders under age 18 from juvenile court jurisdiction, with legislatures typically specifying age and offense criteria. As of 1997, 28 States had some type of statutory exclusion law in place. Prosecutor direct-file provisions give prosecutors the ability to file certain juvenile cases in either juvenile or criminal court. In 1997, 15 States had direct-file statutes in place. Number of persons under age 18 held in juvenile or adult correctional facilities, 1997 Year Total number of persons under 18 in custody State prisona Local jailsb Juvenile facilitiesc Public Private 1997 100,510 5,400 9,100 63,670 22,340 Incarceration rated 509 a See Methodology for calculation of State prison population estimates. b Jail estimates are midyear counts from the Annual Survey of Jails. c Data on persons held in juvenile facilities are from the Census of Juveniles in Residential Placement (1997). These data include only persons under age 18 committed or detained in juvenile facilities and exclude status offenders and nonoffenders. In the Federal system, persons under 18 sentenced to prison are confined in contract juvenile correctional facilities. d Rates are based on the number of persons under age 18 in custody per 100,000 U.S. residents ages 13 to 17 on July 1, 1997, and have been adjusted for Census undercount. 5% of confined persons under 18 were held in State prison In 1997 law enforcement agencies made an estimated 2.8 million arrests of persons under age 18, including 123,000 arrests for violent Index offenses and 700,000 for property Index crimes. Although State prison admissions relative to arrests increased from 1985 to 1997, most confined young offenders continued to be held in juvenile correctional facilities. the Census of Juveniles in Residential Placement Facilities. Prior to 1997 juvenile facility figures were drawn from the Children in Custody survey, collecting aggregate data on persons in juvenile facilities. This survey did not distinguish between delinquents and nondelinquents under 18. Incarceration rates were higher among offenders 18 or older than among persons under age 18 Relative to the number of U.S. residents ages 13 to 17, the rate of At yearend 1997 an estimated 100,510 incarceration for persons under 18 in persons under age 18 were in custody 1997 was 509 inmates per 100,000 of adult or juvenile correctional facilitU.S. residents. This rate includes all ies in the United States. About 86,000 delinquents under age 18 in custody or 86% of these offenders were held in of juvenile or adult correctional facilipublic (64%) or private (22%) juvenile ties. The incarceration rate was greater for offenders age 18 or older facilities, 9% were held in local jails, and 5% were confined in State held in State or Federal prison or in prisons. local jails. Overall, in 1997 there were 864 inmates per 100,000 U.S. adult residents. Comparable statistics do not exist for years before 1997, the first year for 2 Profile of State Prisoners under Age 18, 1985-97 Judicial waiver allows juvenile court judges to waive jurisdiction over a juvenile case and transfer it to criminal court. There are three general forms of judicial waiver: • In 1997, 46 States and the District of Columbia allowed discretionary waiver, giving juvenile judges the ability to waive juvenile cases at their discretion. • 14 States had mandatory waiver statutes in which a juvenile court judge, after finding probable cause, is required to waive jurisdiction. • 14 States and the District of Columbia had presumptive waiver provisions, in which certain categories of juvenile offenders must be waived unless they prove they are amenable to juvenile rehabilitation. This report includes data on all persons under age 18 in State prison, regardless of whether the individual was under the original jurisdiction of the juvenile or adult criminal system. States using blended sentences link adult and juvenile systems Many States have developed blended sentencing options that allow the juvenile or criminal court to impose sanctions in both the juvenile and adult correctional systems (OJJDP, 1996). Statutes in Minnesota, Connecticut, and Montana are examples of sentencing options in which the juvenile court can impose a sanction that typically suspends the adult portion of the sentence barring a future violation of the law. Statutes in Arkansas and Missouri are examples where the criminal court can administer a blended sentence, with the adult sanction often suspended unless there is a violation. States vary in their correctional responses for persons under 18 sentenced as adults Among the incarceration practices for offenders under age 18 sentenced as adults, States apply straight adult incarceration, graduated incarceration, and segregated incarceration. (See page 10 for further discussion.) Table 1. Number of persons under 18 held in State prison at yearend, 1985-97 Year 1985 1986 1987 1988 1989 1990 1991 1992 1993 1994 1995 1996 1997 Number held * 2,300 2,400 2,700 2,900 3,300 3,600 4,400 4,600 4,700 5,000 5,300 5,400 5,400 Note: Data for 1985-89, 1991-94, and 1996-97 were estimated using the 1986, 1991, and 1997 Survey of Inmates in State Correctional Facilities and the National Prisoner Statistics program (see Methodology for details). Data for 1990 and 1995 are based on the Census of State and Federal Correctional Facilities. *Includes all persons under age 18 held in State prison Nearly three-fourths of State inmates under age 18 were black or Hispanic The majority of State prisoners under age 18 were black or Hispanic, according to the 1997 Survey of Inmates in State Correctional Facilities. An estimated 60% of the inmates under 18 were black, 19% were white, 13% were Hispanic, and 8% were Asian or American Indian. Most State inmates under age 18 were male (92%). Characteristic Gender Male Female 92% 8 94% 6 Race/Hispanic origin White* Black* Hispanic Other 19% 60 13 8 34% 46 17 3 69% 47% 13 2 37 13 13 9 14 9 Property offenses Burglary Larceny 15% 8 5 22% 11 4 Drug offenses 11% 21% 5% 10% Most serious offense Violent offenses Murder/nonnegligent manslaughter Rape/sexual assault Robbery Assault About 7 in 10 State inmates under age 18 in 1997 were incarcerated for a violent offense, including 37% for robbery, 13% for murder, and 13% for aggravated assault. An additional 15% of inmates under 18 were confined for property crimes, 11% for drug offenses, and 6% for publicorder offenses. Public-order offenses Half of 1% of State inmates were under age 18 at yearend 1997 Approximately 5,400 State prisoners were under age 18 on December 31, 1997, up from 2,300 at yearend 1985 (table 1). These figures reflect the estimated 1-day count of persons under 18 in custody of State prison authorities. As a percentage of all inmates, State prisoners under age 18 have consistently represented about 0.5% of the State prison population since the mid-1980’s. The total State prison population increased from about 451,800 inmates at yearend 1985 to 1,075,000 at yearend 1997. Prison admissions rose 7% per year among persons under age 18 New admissions (or new court commitments) of offenders under age 18 increased from 3,400 in 1985 to an estimated 7,400 persons in 1997, representing an annual increase of about 7% per year (figure 1). The number of persons admitted under 18 peaked at 7,600 in 1995, then decreased slightly during 1996 and 1997. State prison inmates Under Age 18 18 or older *Excludes Hispanics. On average, the increase in new admissions was greater among persons under age 18 (up 7% per year) than for persons of all ages entering prison (up 5% per year). The total number of persons admitted to State prison as new court commitments rose from 183,100 in 1985 to 323,000 in 1990, and then increased more slowly to 334,500 in 1997. mated to reflect national totals for admissions among persons under age 18. (See Methodology for details.) To ensure greater comparability across jurisdictions, cases in this analysis were restricted to offenders whose sentence was greater than 1 year. As a result of these procedures, the estimates in this report differ from those produced in the Office of Juvenile Justice and Delinquency Prevention’s (OJJDP) Juvenile Victims and Offenders: 1999 National Report (NCJ 178257). The National Corrections Reporting Program (NCRP) generally reports about 90% of all admissions. The data presented in this report were reesti- New court commitments to State prison, 1985-97 Persons of all ages Persons under age 18 Number of State prisoners Number of State prisoners 400,000 10,000 8,000 300,000 6,000 200,000 4,000 100,000 2,000 0 1985 1987 1989 1991 1993 1995 1997 0 1985 1987 1989 1991 1993 1995 1997 Figure 1 Profile of State Prisoners under Age 18, 1985-97 3 The number of persons under age 18 The largest increases among persons admitted under 18 were for robbery and admitted for violent offenses nearly aggravated assault. The number tripled in 13 years admitted for robbery nearly tripled Violent offenses were the main compo- between 1985 and 1997 (from 930 to nent to the growth in under-18 prison 2,360) and the number admitted for admissions between 1985 and 1997, aggravated assault increased more representing 70% of the total increase. than fourfold (from 230 to 1,060). During 1997, 4,510 persons under 18 were admitted to State prison for violent The number of offenders under age 18 offenses, up from about 1,730 in 1985 admitted to prison for drug offenses (table 2). As a percentage of all increased twelvefold (from 70 to 840) persons admitted under 18, violent between 1985 to 1997. By 1997 drug admissions rose from 52% in 1985 to offenders made up 11% of admissions 61% in 1997. among persons under 18 compared to Table 2. Number of persons under age 18 admitted to State prison, by most serious offense, 1985-97 Most serious offense New court commitments of persons under age 18 to State prisons 1985 1990 1997 Number Percent Number Percent Number Percent 3,400 100% 5,100 100% 7,400 100% Violent offenses Murdera Sexual assaultb Robbery Aggravated assault 1,730 230 230 930 230 52% 7 7 28 7 2,270 310 180 1,020 570 45% 6 4 20 11 4,510 500 300 2,360 1,060 61% 7 4 32 14 Property offenses Burglary Larceny/theft Motor vehicle theft 1,410 930 230 110 42% 28 7 3 1,780 940 300 320 35% 19 6 6 1,590 950 230 160 22% 13 3 2 70 2% 820 16% 840 11% 140 4% 200 4% 360 5% All offenses Drug offenses Public-order offenses Note: All data are estimated. Includes only those with a sentence of more than 1 year. In 1997, 1% of offenders under 18 were admitted for “other” offense types. Other offense types are not shown in detail. See Methodology for procedures used for calculating national estimates. a Includes nonnegligent manslaughter. b Includes forcible rape and other sexual assaults. 2% in 1985. In contrast, the percentage admitted for property offenses decreased from 42% in 1985 to 22% in 1997. This drop was largely a consequence of a sharp decline in the percentage of offenders under 18 admitted for burglary. In 1996, 9,160 persons under 18 were convicted of violent felonies; nearly 4,200 were sent to prison In 1996, the latest year for which felony conviction data are available, nearly 138,500 persons ages 13 to 17 were arrested for violent offenses, including murder, nonnegligent manslaughter, forcible rape, robbery, aggravated assault, and other sexual assault (table 3). For comparable violent offenses, State courts convicted more than 9,100 persons under 18 and State prisons admitted 4,180 persons under age 18. The majority of persons arrested under age 18 in 1996 were handled in the juvenile justice system. Although data on individual cases tracked from time of arrest to final disposition are not available for persons under age 18, simple ratios of convictions to arrests and prison admissions to convictions approximate the likelihood of conviction and incarceration given an arrest. These ratios suggest that of persons under age 18 in criminal Table 3. Felony convictions and admissions to State prison relative to the number of arrests for persons under age 18, 1996 Most serious offense National Corrections Reporting Program National Judicial Reporting Program (NJRP) Number of Number of felony Number of admissions to State Uniform Crime Reports (UCR) Number of prison per 1,000 Number of persons felony convictions per admissions to arrested ages 13-17 convictions 1,000 arrests State prison felony convictions Violent offensesa Murderb Sexual assaultc Robbery Aggravated assault 138,470 2,820 18,970 47,340 69,340 9,161 998 793 4,375 2,995 66 354 42 92 43 4,180 500 310 2,280 1,090 456 501 391 521 364 Property offensesd Burglary Larceny/theft Motor vehicle theft 622,720 119,040 433,390 70,290 8,750 5,256 2,877 617 14 44 7 9 1,420 1,030 240 150 162 196 83 243 Drug offenses 207,120 6,019 29 860 143 Note: All data are estimated. See Methodology for estimation of arrests (UCR), felony convictions in State courts (NJRP), and State prison admissions (NCRP) by offense. NJRP estimates a total of 29,000 State felony convictions of persons under age 18 at time of arrest. a Includes only murder, sexual assault, robbery, and aggravated assault. b Includes nonnegligent manslaughter. c Includes forcible rape and other sexual assault. d Includes only burglary, larceny/theft, and motor vehicle theft. 4 Profile of State Prisoners under Age 18, 1985-97 court, those arrested for murder and robbery were the most likely to receive a prison sentence. In 1996 for every 1,000 persons under age 18 arrested for murder, there were 354 persons convicted of murder in State court and 177 persons sentenced to prison. For every 1,000 persons under age 18 arrested for robbery, there were 92 convicted of robbery and 48 sentenced to prison. These ratios were substantially lower among other offense types. As aggregates these rates are not based on individual cases tracked through the criminal system. Persons arrested for one offense may be convicted of a different crime. Cases initiated in one year may be disposed of in subsequent years. In addition, persons arrested or convicted under 18 may not be under 18 at the time of prison admission. State prison admissions grew faster than arrests Between 1985 and 1997, the likelihood of incarceration relative to arrests increased for persons under age 18 (table 4). In 1997 an estimated 33 persons under 18 were admitted to State prison for violent offenses for every 1,000 arrests, up from 18 per 1,000 violent arrests in 1985. Prison admissions more than doubled among male offenders under age 18 Table 4. Number of admissions of persons under age 18 to State prison per 1,000 arrests of persons under age 18, 1985-97 Most serious offense Number of new court commitments per 1,000 arrests 1985 1992 1997 1990 1994 Violent offensesa Murderb Sexual assaultc Robbery Aggravated assault 18 153 12 29 6 17 98 9 27 10 21 136 9 33 12 23 150 11 34 12 33 200 15 63 16 Property offensesd Burglary Larceny/theft Motor vehicle theft 2 6 1 2 3 8 1 4 3 8 1 4 2 7 1 3 2 8 1 2 Drug offenses 1 10 10 6 4 Note: All data are estimated. Arrests reflect the proportion of persons age 13 to 17 for a given offense by the total estimated number of persons arrested by offense (UCR). a Includes only murder, sexual assault, robbery, and aggravated assault. b Includes nonnegligent manslaughter. c Includes forcible rape and other sexual assault. d Includes only burglary, larceny/theft, and motor vehicle theft. Table 5. Number of males under age 18 admitted to State prison, by race and most serious offense, 1985-97 Most serious offense 1985 White Black 1990 White Black 1997 White Black 1,300 1,900 1,500 3,300 2,600 4,300 Violent offenses Murder Sexual assault Robbery Aggravated assault 440 80 80 160 90 1,180 120 160 710 140 470 70 60 130 140 1,650 250 110 810 400 1,400 170 160 580 390 2,730 260 140 1,640 540 Property offenses Burglary Larceny/theft Motor vehicle theft 770 510 110 50 600 390 120 60 890 540 120 120 780 350 150 180 940 610 130 70 670 360 100 100 Total Drug offenses 20 30 50 720 120 640 Public-order offenses 50 80 60 130 120 230 The number of admissions relative to arrests grew for murder, sexual assault, robbery, aggravated assault, and drug offenses between 1985 and 1997. In this period the number of admissions per 1,000 arrests for robbery, drug offenses, and aggravated assault more than doubled. For every 1,000 arrests for robbery, 29 persons under age 18 entered prison in 1985 and 63 persons in 1997. For every 1,000 arrests for aggravated assault, 6 persons under age 18 entered prison in 1985 and 16 persons in 1997. Among those under age 18 arrested for property offenses, the likelihood of prison, lower than for violent offenses, fluctuated across the 13 years. From 1985 to 1997, the number of black and white males admitted under age 18 to State prison more than doubled (table 5). In 1997, 4,300 black males under 18 entered State prison, compared to 1,900 in 1985. An increase in admissions for violent offenses, largely robbery, from 1,180 to 2,730 was responsible for 65% of the overall growth. Increased admissions for drugs accounted for another 25%. A similar pattern of growth in violent offenders existed for white males under age 18. The number of white males under age 18 admitted to State prison doubled between 1985 and 1997, from 1,300 to 2,600. Admissions for violent offenses accounted for 73% of the total growth in admissions of young white males. Property offenses accounted for an additional 13% of the growth. During 1985, an estimated 20 white males and 30 black males under age 18 were admitted to State prison for drug offenses. In 1997 black males under age 18 outnumbered white males of the same age by more than 5 to 1 (640 to 120 admissions for drug offenses). Note: All data are estimated. Data are not disaggregated by Hispanic origin. Includes only those with a sentence of more than 1 year. Other offense types not shown in detail. See Methodology for calculation of national totals by race estimated from NCRP. Profile of State Prisoners under Age 18, 1985-97 5 Table 6. Selected characteristics of persons under age 18 admitted to State prison, 1985-97 Characteristics New commitments to State prison for persons under age 18 1985 1997 1990 Gender Male Female 97% 3 98% 2 97% 3 Race/Hispanic origin White* Black* Hispanic Other 32% 53 14 1 21% 61 15 1 25% 58 15 2 Age at admission 14 or under 15 16 17 0% 2 18 80 0% 3 17 80 1% 4 21 74 Education 8th grade or less 9th-11th grade High school graduate Some college Other 32% 63 4 0 1 28% 68 3 0 1 28% 66 5 0 1 Note: Detail may not add to total because of rounding. Includes only those with a sentence of more than 1 year. High school graduate includes GED. *Excludes Hispanics. Nearly two-thirds of offenders admitted to State prison under age 18 were sentenced for a violent offense compared to a third of those ages 18-24 An estimated 111,100 offenders under age 25 were admitted to State prison as new court commitments in 1997. At the time of admission, 51% were ages 21 to 24, 42% were 18 to 20, and 7% were under 18. Persons admitted under 18 were more likely to be black males sentenced to prison for a violent offense, especially robbery and aggravated assault (not shown in table). Nearly 30% of offenders admitted under 18 in 1997 were black males convicted of robbery or aggravated assault, compared to 16% of those ages 18 to 20 and 11% of persons 21 to 24. Persons admitted as new court commitments, 1997 — Under 18 18-20 21-24 Total 100 % 100 % 100 % Gender Male Female 97 % 3 96 % 4 94 % 6 Race/Hispanic origin White* Black* Hispanic Other 25 % 58 15 2 31 % 50 17 2 30 % 47 21 2 Most serious offense Violent Property Drug Public-order 61 % 21 11 5 39 % 30 22 7 32 % 28 31 8 Note: Includes only offenders with a sentence of more than 1 year. Detail may not add to total due to rounding. *Excludes Hispanics. 6 Profile of State Prisoners under Age 18, 1985-97 Nearly 6 out of 10 offenders admitted to State prison under age 18 were black Fifty-eight percent of offenders admitted under 18 in 1997 were black and 25% were white, representing a gradual change from 1990, when blacks comprised 61% of admissions and whites 21% (table 6). The racial characteristics of persons admitted under 18 had shifted more dramatically between 1985 and 1990. During this period the percentage of black admissions increased from 53% to 62%, and the percentage of whites fell from 32% to 21%. Hispanic admissions, as a proportion of all persons under age 18 entering State prison, have remained stable from 1985 to 1997. Two percent of persons admitted under age 18 in 1997 were Asian or American Indian. Black offenders were more likely than offenders of other racial groups to be admitted to prison for violent offenses. For every 10 violent offenders admitted under age 18 in 1997, 6 were black, 2 were white, and 2 were Hispanic. Whites accounted for more than half of property offenders admitted under age 18 in 1997. The vast majority of offenders admitted under age 18 were male, with females representing about 3% of admissions in 1997. Among these young female offenders, 72% were sentenced to State prison for violent offenses, including 21% for assault, 33% for robbery, and 9% for murder. Age at admission decreased since the mid-1980’s. In 1997, 26% of persons admitted under 18 were 16 or younger at time of admission, including 5% who were under age 16. In 1985 and 1990, 20% of offenders were 16 or younger at the time of admission to prison. Nine out of ten offenders had not graduated from high school at the time of admission. Among persons admitted under 18 in 1997, 96% of blacks, 95% of Hispanics, and 90% of whites had not gone beyond the 11th grade. Maximum sentences for violent offenders under age 18 were shorter on average in 1997 Recent sentencing reforms are linked to reducing the difference between the imposed sentence and the time actually served, and to increasing time served (see Truth in Sentencing in State Prisons. BJS Report, NCJ 170032). The mean sentence length imposed on offenders under 18 entering prison decreased from 86 months in 1985 to 82 months in 1997 (table 7). However, the projected minimum time expected to be served for persons under 18 increased between 1985 and 1997. If parole eligibility requirements, goodtime credits, and early release policies are taken into account, persons under 18 entering prison in 1997 were expected to serve a minimum of 44 months in prison, up from 35 months in 1985. Among violent offenders entering prison under 18, sentences have declined from an average of 109 months in 1985 to 98 months in 1997. On average, violent offenders admitted under 18 in 1997 were expected to serve 12 months longer than those admitted in 1985 (or a minimum of 59 months versus 47 months). The average sentence length for robbery offenders admitted under 18 declined from 89 months in 1985 to 85 months in 1997. Yet, the minimum time expected to be served for these offenders increased 12 months over this time period, from 33 months to 45 months. Among person under 18 sentenced for By offense, the largest monthly weapons offenses, the average increase in average sentence length sentence length decreased 15 months between 1985 and 1997 was for murder between 1985 and 1997 (60 months to offenders, up from 231 months to 244 45 months) but the minimum time to be months. Offenders under 18 admitted served increased from 22 months to 28 to prison for murder in 1997, without a months. life sentence, were expected to serve 40 months longer than offenders admit- Offenders under 18 admitted in 1997 ted in 1985 (180 months versus 140 for drug offenses were sentenced to an months). average of 54 months in prison, a 7 month decline from 1990. These Overall, 3% of offenders admitted young offenders were expected to under age 18 in 1997 were sentenced serve 4 months longer in 1997 than in to life imprisonment. Among those 1990 (24 months versus 20 months). convicted of murder/nonnegligent manslaughter, 32% were sentenced to life, 5% were sentenced to life without parole, and 1% were sentenced to death. Table 7. Maximum sentence and minimum time to be served, by offense for persons admitted under age 18, 1985-97 Most serious offense New commitments to State prison for persons under age 18 Mean minimum time to be servedb Mean maximum sentence lengtha 1985 1997 1990 1990 1985 1997 86 mo 82 mo 82 mo 35 mo 41 mo 44 mo 109 mo 231 138 151 135 89 79 65 112 mo 246 144 127 119 90 94 68 98 mo 244 115 131 96 85 77 63 47 mo 140 58 67 54 33 35 27 59 mo 121 72 57 58 41 60 57 59 mo 180 59 72 58 45 40 31 Property offenses Burglary Larceny/theft Motor vehicle theft Other property 60 mo 65 47 48 44 57 mo 65 52 45 40 57 mo 63 52 43 43 19 mo 20 15 11 26 27 mo 30 18 24 25 25 mo 27 17 26 20 Drug offenses Possession Trafficking Other unspecified drug 51 mo 43 57 39 61 mo 52 70 48 54 mo 54 55 49 18 mo 17 15 25 20 mo 19 22 14 24 mo 20 27 14 Public-order offenses Weapons Other public-order 57 mo 60 56 46 mo 49 44 47 mo 45 51 19 mo 22 17 25 mo 22 27 25 mo 28 20 All offenses Violent offenses Murder/nonnegligent manslaughter Negligent manslaughter Rape Other sexual assault Robbery Assault Other violent Note: Includes only offenders with a sentence of more than 1 year. Excludes life sentences and persons sentenced to death. Detail may not add to total because of rounding. a Maximum sentence length an offender may be required to serve for the most serious offense. b Minimum time to be served is the jurisdiction’s estimate of the shortest time each admitted prisoner must serve before becoming eligible for release. Profile of State Prisoners under Age 18, 1985-97 7 A growing number of inmates released from prison had been admitted under age 18 Among persons admitted under 18, an increasing percentage are released from prison unconditionally In 1997 an estimated 9,300 inmates released from prison had been admitted on their current sentence prior to their 18th birthday (not shown in table). This represented a 66% increase from 1985, when approximately 5,600 inmates were released from prison who had been admitted under the age of 18. Of persons released from State prison in 1990, an estimated 6,500 had been admitted on their current sentence while under age 18, an increase of 16% from 1985. The percentage of offenders who had been admitted to prison under 18 and then released unconditionally grew from 1985 to 1997 (table 8). Persons released unconditionally cannot be returned to prison for any remaining portion of their current sentence. In 1997, 21% of offenders were released who had served their entire prison sentence (or expired their sentence), up from 17% in 1985. Among persons admitted under age 18 and exiting prison in 1997, 71% were released on a conditional basis, including 41% who were released at the discretion of the parole board. This represented a decline from 1985, when 78% of comparable offenders were released conditionally from State prison, 51% by the parole board. Table 8. Method of release for persons admitted under age 18 and released from State prison in 1985, 1989, and 1997 Method of release Among persons admitted under age 18, percent of first releases 1985 1997 1990 100% 100% 100% Conditional releases Parole board Mandatory parole Probation release Other conditional 78% 51 18 8 1 78% 56 10 11 1 71% 41 16 11 3 Unconditional releases Expiration Commutation/pardon Other unconditional 18% 17 0 1 17% 15 0 2 22% 21 0 1 Death 0% 0% 0% Escape/AWOL 2% 2% 1% Other releases 2% 2% 6% All methods Note: In 1990, 1989 data were substituted for Florida because of more complete reporting in that year. Table includes only offenders with a total sentence of 1 year released for the first time on their current sentence. Other releases includes transfers, releases on appeal or bond, and other methods of release from State prison. Detail may not add to total because of rounding. Nearly half of prisoners released in 1997 were sentenced to prison for a violent crime Among persons admitted to prison under age 18, sentences for violent offenses accounted for 48% of persons released in 1997 and 58% of those released in 1985 (table 9). The percentage of drug offenders grew among released inmates, from 1% to 17%, while the percentage of property offenders declined from 37% to 28%. Fifty-nine percent of persons admitted to prison under age 18 and released in 1997 were black, 21% were white, and 18% were of Hispanic origin. Compared to inmates released in 1985, the proportion of whites decreased in the exiting population and the proportion of Hispanics increased. Table 9. Selected characteristics of persons admitted under age 18 and released from State prison in 1985, 1990, and 1997 Demographic characteristic Among persons admitted under age 18, percent of first releases 1985 1997 1990 100% 100% 100% Gender Male Female 97% 3 98% 2 97% 3 Race/Hispanic origin White* Black* Hispanic Other 28% 58 13 1 24% 60 15 1 21% 59 18 2 Education 8th grade or less 9th-11th grade High school graduate Some college Other 37% 59 4 0 0 30% 66 4 0 1 26% 64 9 0 1 Offense type Violent offenses Property offenses Drug offenses Public-order offenses Other offenses 58% 37 1 4 0 40% 42 14 4 1 48% 28 17 6 1 Total Note: Excludes death, transfers, escape/AWOL, other releases and cases missing release type. Includes only offenders with a total sentence of 1 year released for the first time on their current sentence. High school graduate includes GED. Detail may not add to total because of rounding. *Excludes Hispanics. 8 Profile of State Prisoners under Age 18, 1985-97 Released violent offenders admitted under 18 had served 53% of their sentences in 1997 and 46% in 1985 State prisoners admitted under age 18 and released for the first time on their current offense in 1997, served on average 37 months, or 33 months in prison and 4 months in jail (table 10). This represented little change from prior years. Offenders admitted under 18 and released in 1990 served an average of 35 months, or 31 months in prison and 4 months in jail, while comparable offenders released in 1985 served 37 months, 33 months in prison and 4 months in jail. The average total time served has fluctuated for violent offenders under age 18. Following an increase between 1985 to 1990 (44 months to 55 months), total time served for violent offenders fell to 46 months for those released in 1997. Only violent offenders admitted under age 18 for murder/nonnegligent manslaughter (69 months versus 106 months) and rape (63 months versus 80 months) served appreciably longer sentences in 1997 than in 1985. The patterns of time served for nonviolent offenders differed from that for violent offenders. Between 1985 and 1997, the average time served for property offenders increased from 26 months to 33 months. The greatest increase among property offenders, was for those sentenced for larceny/ theft who served on average 18 months longer in 1997 than in 1985. The average total time served for drug offenses fell from 26 months in 1985 to 22 months in 1997. The proportion of the total sentence that offenders actually served in jail and prison increased from 1985 to 1997. Overall, offenders admitted under 18 and released in 1997 served 50% of their total maximum sentence Table 10. Time served and percent of sentence served among persons admitted under age 18 and released from State prison in 1985, 1990, and 1997 Most serious offense All offenses Among persons admitted under age 18 and released Percent of sentence servedb Mean total time serveda 1985 1985 1997 1990 1997 1990 37 mo 35 mo 37 mo 46% 45% 50% 44 mo 55 mo 46 mo 46% 51% 53% Violent offenses Murder/nonnegligent manslaughter Negligent manslaughter Rape Other sexual assault Robbery Assault Other violent 69 60 63 49 40 39 -- Property offenses Burglary Larceny/theft Motor vehicle theft Other property 26 mo 28 21 26 12 25 mo 30 15 25 21 Drug offenses Possession Trafficking Other unspecified drug 26 mo -16 -- 16 mo 14 17 14 115 59 83 38 47 37 -- 106 53 80 49 42 41 24 35 55 51 49 46 53 -- 47 62 66 32 49 53 -- 53 53 56 59 52 58 47 33 mo 33 39 29 21 41% 42 36 55 48 40% 40 31 50 50 50% 47 57 60 47 22 mo 26 21 20 50% -29 -- 30% 29 28 30 37% 42 34 42 26 mo 23 mo 27 mo 46% 51% 51% Public-order offenses Weapons 30 25 27 63 52 51 Other public-order 26 18 26 43 45 47 Note: Includes only offenders with a sentence of more than a year released for the first time on the current sentence. Excludes prisoners released by escape, death, transfer, appeal or detainer. Details may not add to total because of rounding. a Total time served in prison includes average time served in prison and average time spent in jail credited towards current sentence. b Based on the mean total time served and mean total maximum sentence length by offense. -- Fewer than 10 cases. compared to 46% in 1985. During this 13-year period, the proportion of the total sentence served increased for both violent offenders (46% to 53%) and property offenders (41% to 50%). Drug offenders served the smallest proportion of their given sentence, about 37% for those released in 1997, up from 30% in 1990. Persons under 18 admitted to facilities under contract to the Federal Bureau of Prisons During fiscal year 1997, 189 persons under age 18 were admitted to juvenile correctional facilities under contract to the Federal Bureau of Prisons. The Federal Bureau of Prisons does not have its own facilities for persons under 18. Half of these offenders had been adjudicated delinquent for a violent offense and nearly a third for a property offense. Seventy-two percent of persons admitted under 18 were Native Americans, 18% were white, 7% were black, and 3% were Asian. About 10% of persons admitted under 18 were of Hispanic origin. The majority of confined offenders were U.S. citizens (95%), 4% were Mexican citizens, and 1% were citizens of Honduras or Colombia. Characteristic Percent admitted under 18 Gender Male Female 95% 5 Race White Black American Indian Asian 18% 7 72 3 Hispanic origin Hispanic Non-Hispanic 11% 89 Offense type Violent Property Drug Public-order 52% 31 6 11 Country of origin United States Mexico Other 95% 4 1 Number of admissions 189 Source: Bureau of Prisons, Sentry system data file, fiscal year ending September 30, 1997. Profile of State Prisoners under Age 18, 1985-97 9 Among persons under age 18, 78% expected to be released by age 21 Correctional officials report the minimum time to be served, an estimate of how long prisoners are expected to remain in prison, given their sentence and release policies. Of persons under age 18 when admitted to State prison in 1997, an estimated 8% were expected to be released before their 18th birthday. Over a third of the offenders were expected to be release before age 19, and over three-fourths before age 22. Overall, 93% of offenders admitted under 18 in 1997 would have served their minimum sentence in State prison before reaching age 28. Estimated age of release for persons under age 18 admitted to State prison Percent released based on minimum time to be served 100% Methodology Data sources National Corrections Reporting Program (NCRP) This report presents data primarily from the NCRP, which collects individual level data for persons admitted to and released from State prison in each calendar year. These data cover prisoners admitted to or released from custody regardless of the jurisdiction where the prisoner was sentenced. The analysis is limited to prisoners with a total sentence of more than a year. The NCRP data sets are available from the National Archive of Criminal Justice Data at the University of Michigan and can be downloaded via the Internet. A codebook, explanatory notes, and sample SPSS and SAS database setup files are included with each data set. The data sets for 1983 through 1996 are also available on a series of nine CD-ROM’s. 80% 60% 40% 20% National Prisoner Statistics (NPS) 0% Under 18 18 19 20 21 22 23 24 Age at release 25 26 27 28 Note: Minimum time served was provided in 51% of all cases involving persons admitted to State prison under 18 in 1997 (NCRP). The expected age of release was estimated by adding age at admission to minimum time to be served. These calculations are estimates of the earliest possible release age and are not the actual age of release from prison. The NPS program obtains year-end and midyear counts of prisoners from departments of correction in each of the 50 States, the District of Columbia, and the Federal Bureau of Prisons. In an effort to collect comparable data from State correctional systems differ in their housing and program assignments of inmates under age 18 States correctional responses available for persons under 18 who are sentenced to prison include straight adult incarceration, graduated incarceration, and segregated incarceration. The description of State correctional responses was summarized from State Responses to Serious and Violent Juvenile Crime (OJJDP, 1996). Straight adult incarceration refers to persons under 18 incarcerated as adults with little differentiation in programming between inmates. Most States allow underage inmates to be housed in State correctional facilities with other adult offenders. Six States (Arizona, Hawaii, Kentucky, Montana, Tennessee, and West Virginia) require separate housing for State inmates under age 18. In North Dakota and California no person under age 16 can be held in an adult prison. transferring or releasing offenders varies across States. Eight States (Florida, South Carolina, Colorado, Kentucky, New Mexico, Wisconsin, California, and New York) Graduated incarceration is employed in apply segregated incarceration assign12 States (Delaware, Georgia, ing certain underage offenders to Maryland, Missouri, North Dakota, specific facilities based on age and Ohio, Oregon, Tennessee, Texas, programming needs. In Florida Utah, Washington, and West Virginia). persons under 18 convicted in criminal Inmates under 18 begin their sencourt can be sentenced to the youthful tences in a juvenile facility until they offender program that separates ages reach a certain age (usually 18). The 14-18 from ages 19-24. These offender can then be transferred to an programs offer youthful offenders specialized educational, vocational, adult facility to serve the remainder of the sentence, or, if the State chooses, and life skills training, as well as substance abuse treatment. can be released. The mechanism for 10 Profile of State Prisoners under Age 18, 1985-97 Estimating State court conviction offenses for persons under age 18 all jurisdictions, National Prisoner Statistics (NPS) distinguishes prisoners in custody from those under State jurisdiction. To have custody of a prisoner, a State must hold that person in one of its facilities. Excluded from NPS counts are persons confined in locally administered confinement facilities who are under the jurisdiction of local authorities. proportion of new court commitments under age 18 reported in NCRP in each year by the total number of new court commitments with a sentence of more than 1 year (as reported in NPS). To obtain offense-specific estimates, the offense distribution of persons admitted under age 18 was multiplied by the estimated number of new court commitments under 18 for each year. Survey of Inmates in State Correctional Facilities (SISCF) To obtain national estimates for persons admitted under 18 by race and gender, the proportion of male admissions under 18 by race (NCRP) was multiplied by the total number of black and white males admitted to State prison as new court commitments (see table 1.20 in Correctional Populations in References the United States, 1996, NCJ 170013). Correctional Populations in the United States, 1995, BJS report, NCJ 163916, To obtain national estimates for prison releases by age at admission, the May 1997. proportion of persons admitted under Correctional Populations in the United 18 in each release year (NCRP) was States, 1996, BJS report, NCJ 170013, multiplied by the total number of April 1999. releases with a sentence of more than 1 year (NPS). Releases excluded Crime in the United States, published escapees, AWOL’s, and transfers. annually 1985 - 97. FBI, Uniform Crime Reports. Estimating persons under 18 in State Juvenile Felony Defendants in Criminal prison Courts, BJS Special Report, NCJ 165815, September 1998. To calculate the number of persons The SISCF, conducted every 5 to 6 years, provides data on the individual characteristics of prison inmates. Based on scientifically selected samples of facilities and of inmates held in them, these surveys provide information unavailable from any other source. For this report, information on the sex, race/Hispanic origin, and most serious offense of persons under age 18 was drawn from the 1997 survey. Annual Survey of Jails (ASJ) The ASJ collects information on the number of inmates held in local jails. Prior to 1994, jail inmate counts include only persons under 18 defined by State statute as juveniles and subject initially to juvenile court jurisdiction. In 1994 the definition was changed to include all under 18 in custody of State prison persons under age 18. authorities at yearend, the total number of State inmates in custody (from NPS) National Judicial Reporting Program was multiplied by the proportion of (NJRP) State inmates under age 18 (from SISCF, 1986, 1991, 1997). State The NJRP is a biennial survey largely prison custody number for 1990 and based on court and prosecutors’ 1995 were based on the Census of records. It compiles information on the State and Federal Correctional Facilinumber and characteristics of persons ties. convicted of a felony in State criminal courts nationwide. Estimating arrests of persons ages 13 to 17 from the FBI’s Uniform Crime Estimation procedures Reports (UCR) Estimating State prison admissions To account for law enforcement and releases agencies that did not report to the UCR, among reporting agencies and for each The NCRP generally reports over 90% Index offense, the proportion of arrests of all State prison admissions and releases. In order to account for differ- of persons ages 13-17 to all arrests for ences in State participation and data was calculated. This proportion was reported and to draw year-to-year then multiplied by the FBI’s nationally comparisons, national totals were estimated number of arrests per estimated for each year. These figures offense, which considers reporting were estimated by multiplying the and nonreporting agencies. To account for cases in which the defendant's age at arrest was unknown, the offense distribution for offenders under age 18 at the time of arrest, conviction, or sentencing was calculated. Then a national total for persons under 18 convicted in State courts was generated (29,000 persons), which included an adjustment for missing data from New York. This readjusted national total was multiplied by the distribution of conviction offenses known for 21,000 persons under 18. Juveniles Prosecuted in State Criminal Courts, BJS Special Report, NCJ 164265, March 1997. Prison and Jail Inmates at Midyear 1998, BJS Bulletin, NCJ 173414, March 1999. Juvenile Arrests 1997. OJJDP, NCJ 173938, July 1999. State Legislative Responses to Violent Juvenile Crime: 1996-97 Update. OJJDP, NCJ 172835, November 1998. State Responses to Serious and Violent Juvenile Crime. OJJDP, NCJ 161565, July 1996. Truth in Sentencing in State Prisons. BJS Special Report, NCJ 170032. January 1999. Profile of State Prisoners under Age 18, 1985-97 11 The Bureau of Justice Statistics is the statistical agency of the U.S. Department of Justice. Jan M. Chaiken, Ph.D., is director. This report and others from the Bureau of Justice Statistics are available through the Internet http://www.ojp.usdoj.gov/bjs/ BJS Special Reports address a specific topic in depth from one or more datasets that cover many topics. Kevin J. Strom wrote this report under the supervision of Allen J. Beck and Steven K. Smith. Howard Snyder and Melissa Sickmund from the National Center for Juvenile Justice provided assistance and helpful comments, while Joseph Moone of Office of Juvenile Justice and Delinquency Prevention supplied analysis on juvenile facility statistics. At BJS, Paula Ditton provided statistical assistance and review. Tom Hester and Tina Dorsey edited the report. Jayne Robinson prepared the report for publication. The data from National Corrections Reporting Program, the Surveys of Inmates in State Correctional Facilities, and the Annual Survey of Jails are available from the National Archive of Criminal Justice Data, maintained by the Institute for Social Research at the University of Michigan, 1-800-999-0960. The archive may also be accessed through the BJS Internet site. February 2000, NCJ 176989 12 Profile of State Prisoners under Age 18, 1985-97