
BOP COVID-19 Results as of 4-6-20
Download original document:
Document text
Document text
This text is machine-read, and may contain errors. Check the original document to verify accuracy.
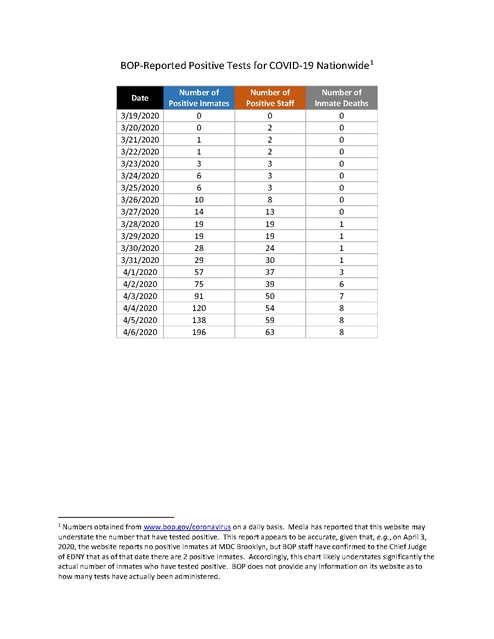
BOP-Reported Positive Tests for COVID-19 Nationwide1
Date
3/19/2020
3/20/2020
3/21/2020
3/22/2020
3/23/2020
3/24/2020
3/25/2020
3/26/2020
3/27/2020
3/28/2020
3/29/2020
3/30/2020
3/31/2020
4/1/2020
4/2/2020
4/3/2020
4/4/2020
4/5/2020
4/6/2020

1

Number of
Positive Inmates
0
0
1
1
3
6
6
10
14
19
19
28
29
57
75
91
120
138
196

Number of
Positive Staff
0
2
2
2
3
3
3
8
13
19
19
24
30
37
39
50
54
59
63

Number of
Inmate Deaths
0
0
0
0
0
0
0
0
0
1
1
1
1
3
6
7
8
8
8

Numbers obtained from www.bop.gov/coronavirus on a daily basis. Media has reported that this website may
understate the number that have tested positive. This report appears to be accurate, given that, e.g., on April 3,
2020, the website reports no positive inmates at MDC Brooklyn, but BOP staff have confirmed to the Chief Judge
of EDNY that as of that date there are 2 positive inmates. Accordingly, this chart likely understates significantly the
actual number of inmates who have tested positive. BOP does not provide any information on its website as to
how many tests have actually been administered.

BOP-Reported Positive Tests for COVID-19 Nationwide
250
200
150
100
50
0

Number of Positive Inmates

Number of Positive Staff

Number of Inmate Deaths

BOP-Reported Positive Tests for COVID-19 Nationwide
250
200
150
100
50
0

Number of Positive Inmates

Number of Positive Staff

Number of Inmate Deaths

Percentage of Increase of Infected BOP People (Inmates and Staff)
Since 3/20/20202

2

Date

Number
of BOP
Cases

3/20/2020
3/21/2020
3/23/2020
3/24/2020
3/26/2020
3/27/2020
3/29/2020
3/30/2020
3/31/2020
4/1/2020
4/2/2020
4/3/2020
4/4/2020
4/5/2020
4/6/2020

2
3
6
9
18
27
38
52
59
94
114
141
174
197
259

BOP Percentage
Increase Since
3/20/2020
0%
50%
200%
350%
800%
1250%
1800%
2500%
2850%
4600%
5600%
6950%
8600%
9750%
12850%

National
Percentage
Increase Since
3/20/2020
0%
31%
135%
190%
355%
451%
651%
772%
892%
1036%
1176%
1379%
1526%
1665%
1845%

Number of U.S.
Cases
18,747
24,583
44,183
54,453
85,356
103321
140904
163539
186101
213144
239279
277205
304826
330891
364723

National numbers obtained from www.cdc.gov and
https://gisanddata.maps.arcgis.com/apps/opsdashboard/index.html#/bda7594740fd40299423467b48e9ecf6

Percentage of Increase of Infected People Since 3/20/2020
14000%

12000%

10000%

8000%

6000%

4000%

2000%

0%
3/18/2020 3/20/2020 3/22/2020 3/24/2020 3/26/2020 3/28/2020 3/30/2020 4/1/2020
BOP Percentage Increase Since 3/20/2020

4/3/2020

4/5/2020

National Percentage Increase Since 3/20/2020

4/7/2020