
Bureau of Justice Statistics - American Indian and Alaska Natives in Local Jails, 1999-2014, 2017
Download original document:
Document text
Document text
This text is machine-read, and may contain errors. Check the original document to verify accuracy.
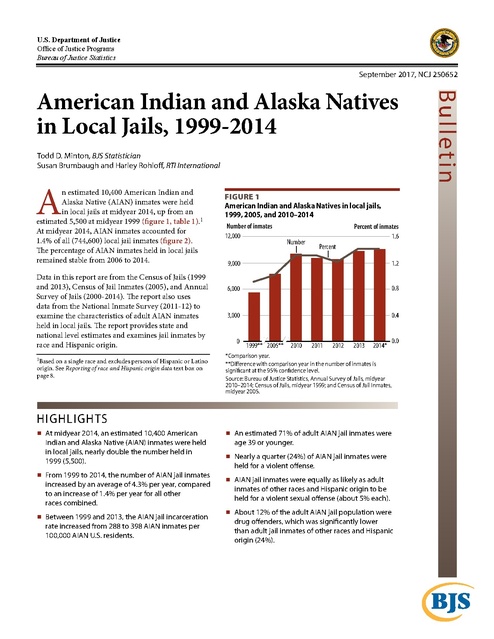
U.S. Department of Justice Office of Justice Programs Bureau of Justice Statistics September 2017, NCJ 250652 Todd D. Minton, BJS Statistician Susan Brumbaugh and Harley Rohloff, RTI International A n estimated 10,400 American Indian and Alaska Native (AIAN) inmates were held in local jails at midyear 2014, up from an estimated 5,500 at midyear 1999 (figure 1, table 1).1 At midyear 2014, AIAN inmates accounted for 1.4% of all (744,600) local jail inmates (figure 2). The percentage of AIAN inmates held in local jails remained stable from 2006 to 2014. Data in this report are from the Census of Jails (1999 and 2013), Census of Jail Inmates (2005), and Annual Survey of Jails (2000-2014). The report also uses data from the National Inmate Survey (2011-12) to examine the characteristics of adult AIAN inmates held in local jails. The report provides state and national level estimates and examines jail inmates by race and Hispanic origin. 1Based on a single race and excludes persons of Hispanic or Latino origin. See Reporting of race and Hispanic origin data text box on page 8. Figure 1 American Indian and Alaska Natives in local jails, 1999, 2005, and 2010–2014 Number of inmates 12,000 Percent of inmates 1.6 Number Percent 9,000 1.2 6,000 0.8 3,000 0.4 0 1999** 2005** 2010 2011 2012 2013 2014* 0.0 *Comparison year. **Difference with comparison year in the number of inmates is significant at the 95% confidence level. Source: Bureau of Justice Statistics, Annual Survey of Jails, midyear 2010–2014; Census of Jails, midyear 1999; and Census of Jail Inmates, midyear 2005. HIGHLIGHTS At midyear 2014, an estimated 10,400 American Indian and Alaska Native (AIAN) inmates were held in local jails, nearly double the number held in 1999 (5,500). From 1999 to 2014, the number of AIAN jail inmates increased by an average of 4.3% per year, compared to an increase of 1.4% per year for all other races combined. Between 1999 and 2013, the AIAN jail incarceration rate increased from 288 to 398 AIAN inmates per 100,000 AIAN U.S. residents. An estimated 71% of adult AIAN jail inmates were age 39 or younger. Nearly a quarter (24%) of AIAN jail inmates were held for a violent offense. AIAN jail inmates were equally as likely as adult inmates of other races and Hispanic origin to be held for a violent sexual offense (about 5% each). About 12% of the adult AIAN jail population were drug offenders, which was significantly lower than adult jail inmates of other races and Hispanic origin (24%). Bul l etin American Indian and Alaska Natives in Local Jails, 1999-2014 Figure 2 Inmates of races and Hispanic origin other than American Indians and Alaska Natives in local jails, 1999, 2005, and 2010-2014 Number of inmates 800,000 Number 640,000 Percent of inmates 100 Percent 99.5 480,000 99.0 320,000 98.5 160,000 98.0 0 1999** 2005 2010 2011 2012 2013 2014* 97.5 *Comparison year. **Difference with comparison year in the number of inmates is significant at the 95% confidence level. Source: Bureau of Justice Statistics, Annual Survey of Jails, midyear 2010–2014; Census of Jails, midyear 1999; and Census of Jail Inmates, midyear 2005. Local jail facilities include confinement facilities administered by local or regional law enforcement agencies and private facilities operated under contract to such agencies. They exclude jails administered by federal, state prison, or tribal authorities. This analysis includes 15 locally operated jails in Alaska, but excludes the combined jails and prison systems in Alaska, Connecticut, Delaware, Hawaii, Rhode Island, and Vermont. In addition to the 10,400 AIAN inmates held in local jails, 21,600 were held in state and federal prisons in 2014. (See the text box More than 34,000 American Indian and Alaska Natives were held in local jails and in state and federal prisons in 2014.) The number of AIANs held in local jails nearly doubled from 1999 to 2014 While AIAN inmates made up a small proportion of the jail population, the number of AIAN inmates held in county and city jails increased nearly 90% from 1999 to 2014. Non-Hispanic white inmates accounted for 47% of the jail population in 2014, up from 41% in 1999.2 In comparison, the percentage of non-Hispanic black inmates held in local jails declined from 42% in 1999 to 35% in 2014. Hispanics accounted for 15% of the jail population, which was unchanged from 1999 to 2014. 2See Jail Inmates in 2015, NCJ 250394, BJS web, December 2016. Table 1 Estimated number and percent of inmates in local jails, by race and Hispanic origin, 1999–2000 and 2005–2014 Total Year 1999 2000 2005 2006 2007 2008 2009 2010 2011 2012 2013 2013b 2014* Average annual changec 1999–2005 2005–2010 2010–2014 1999–2014 Number 605,900** 621,100** 747,500 765,800** 780,200** 785,500** 767,400** 748,700 735,600 744,500 731,200 731,600 744,600 Percent 100% 100% 100% 100% 100% 100% 100% 100% 100% 100% 100% 100% 100% 3.6%** 0.0 -0.1 1.4** American Indian and Alaska Nativea Number Percent 5,500** 0.9% 5,500** 0.9 7,600** 1.0 8,400 1.1 8,600 1.1 9,000 1.1 9,400 1.2 9,900 1.3 9,400 1.3 9,300 1.2 10,200 1.4 8,800 1.2 10,400 1.4 All other races and Hispanic origin Number Percent 600,400** 99.1% 615,600** 99.1 739,900 99.0 757,400** 98.9 771,500** 98.9 776,600** 98.9 758,100** 98.8 738,800 98.7 726,200 98.7 735,300 98.8 721,000 98.6 722,800 98.7 734,200 98.6 5.5%** 5.4** 1.2 4.3** 3.5%** 0.0 -0.2 1.4** Note: Detail may not sum to total due to rounding. Excludes jails in Indian country, jails under federal jurisdiction, and combined jail and prison systems in Alaska, Connecticut, Delaware, Hawaii, Rhode Island, and Vermont. Includes 15 locally operated jails in Alaska. Data are adjusted for survey and item nonresponse. Unless noted, data are based on the number of inmates held on the last weekday in June. See appendix table 1 for reported data, appendix table 2 for standard errors, and appendix table 3 for confidence intervals. *Comparison year. **Difference with comparison year is significant at the 95% confidence level. aExcludes persons of Hispanic or Latino origin. bData are based on the number of inmates held on December 31, 2013. cComparisons for significance tests were based on each year group. Source: Bureau of Justice Statistics, Annual Survey of Jails, midyear 2000 and midyear 2006–2014; Census of Jails, midyear 1999; Census of Jail Inmates, midyear 2005; and Deaths in Custody Reporting Program, Annual Summary on Inmates Under Jail Jurisdiction, yearend 2013. A M E R I C A N I N D I A N A N D A L A S K A N AT I V E S I N LO C A L J A I L S , 1999 - 2014 | S E P T E M B E R 2017 2 From midyear 1999 to midyear 2014, the number of AIAN inmates held in local jails grew by an average of 4.3% each year, compared to an increase of 1.4% per year for all other races and Hispanic origin combined. The average annual growth of AIAN inmates from 1999 to 2005 was 5.5% and 5.4% from 2005 to 2010. In comparison, the number of jail inmates of all other races and Hispanic origin grew an average of 3.5% each year from 1999 to 2005, and remained stable from midyear 2005 to midyear 2014. The majority of AIAN jail inmates were held in the Midwest and West AIAN inmates made up 0.2% of all inmates in the Northeast, 0.4% in the South, 2.1% in the Midwest, and 3.0% in the West on December 31, 2013 (the latest year for which statelevel data were available) (not shown). AIAN inmates were held in local jails in nearly every state on December 31, 2013. About 80% of these inmates were held in jurisdictions located in the Midwest and West in 1999, 2005, and 2013 (figure 3, table 2). From 1999 to 2013, jails in Arizona reported the largest increase in the percentage of AIANs held in local jails, from 8% of the Arizona jail population in 1999 to 11% by yearend 2013. In comparison, jails in California reported the largest decline in percentages, from 9% in 1999 to 6% by yearend 2013. Based on the absolute jail population at yearend 2013, New Mexico jails held the greatest number of AIAN inmates (1,180), followed by jails in seven states that held at least 500 AIAN inmates: Arizona (970), Oklahoma (850), South Dakota (670), Washington (620), California (550), Wisconsin (540), and Minnesota (500). Eight states held fewer than 10 AIAN inmates at yearend 2013: Massachusetts (9), Mississippi (9), Ohio (7), New Hampshire (6), Georgia (6), West Virginia (3), and Alabama (1). The District of Columbia reported holding no AIAN inmates at yearend 2013. Figure 3 American Indian and Alaska Natives in local jails, by region, 1999, 2005, and 2013 1999 2005 2013 Percent 70 60 50 40 30 20 10 0 Northeast South Midwest West Source: Bureau of Justice Statistics, Census of Jails, midyear 1999; Census of Jail Inmates, midyear 2005; and Deaths in Custody Reporting Program, Annual Summary on Inmates Under Jail Jurisdiction, yearend 2013. A M E R I C A N I N D I A N A N D A L A S K A N AT I V E S I N LO C A L J A I L S , 1999 - 2014 | S E P T E M B E R 2017 3 Table 2 American Indian and Alaska Natives in local jails, by jurisdiction, 1999, 2005, and 2013 Region and jurisdiction U.S. total Northeast Maine Massachusetts New Hampshire New Jersey New York Pennsylvania Midwest Illinois Indiana Iowa Kansas Michigan Minnesota Missouri Nebraska North Dakota Ohio South Dakota Wisconsin South Alabama Arkansas District of Columbia Florida Georgia Kentucky Louisiana Maryland Mississippi North Carolina Oklahoma South Carolina Tennessee Texas Virginia West Virginia West Alaska Arizona California Colorado Idaho Montana Nevada New Mexico Oregon Utah Washington Wyoming 1999a 5,500 160 20 20 6 20 90 10 1,530 20 10 30 40 70 380 3 90 180 10 310 380 760 20 9 0 8 6 3 3 4 20 170 430 20 10 50 10 0 3,050 30 450 490 110 110 300 70 660 80 140 530 80 Number 2005a 7,600 240 10 20 3 100 60 40 1,980 5 10 30 70 80 470 10 160 230 6 430 470 1,230 20 5 1 20 6 10 7 9 70 240 740 20 10 80 10 1 4,120 30 820 590 120 120 530 100 810 100 200 590 120 2013b 8,800 200 20 9 6 20 100 50 2,480 30 20 50 60 100 500 10 150 340 7 670 540 1,420 1 10 0 30 6 10 40 10 9 340 850 10 10 30 30 3 4,680 30 970 550 90 140 460 120 1,180 100 300 620 130 1999a 100% 2.9% 0.4 0.4 0.1 0.4 1.6 0.2 27.8% 0.4 0.2 0.5 0.7 1.3 6.9 0.1 1.6 3.3 0.2 5.6 6.9 13.8% 0.4 0.2 0.0 0.1 0.1 0.1 0.1 0.1 0.4 3.1 7.8 0.4 0.2 0.9 0.2 0.0 55.5% 0.5 8.2 8.9 2.0 2.0 5.5 1.3 12.0 1.5 2.5 9.6 1.5 Percent 2005a 100% 3.2% 0.1 0.3 0.0 1.3 0.8 0.5 26.1% 0.1 0.1 0.4 0.9 1.1 6.2 0.1 2.1 3.0 0.1 5.7 6.2 16.2% 0.3 0.1 0.0 0.3 0.1 0.1 0.1 0.1 0.9 3.2 9.7 0.3 0.1 1.1 0.1 0.0 54.2% 0.4 10.8 7.8 1.6 1.6 7.0 1.3 10.7 1.3 2.6 7.8 1.6 2013b 100% 2.3% 0.2 0.1 0.1 0.2 1.1 0.6 28.2% 0.3 0.2 0.6 0.7 1.1 5.7 0.1 1.7 3.9 0.1 7.6 6.1 16.1% 0.0 0.1 0.0 0.3 0.1 0.1 0.5 0.1 0.1 3.9 9.7 0.1 0.1 0.3 0.3 0.0 53.2% 0.3 11.0 6.3 1.0 1.6 5.2 1.4 13.4 1.1 3.4 7.0 1.5 Note: Excludes jails in Indian country, jails under federal jurisdiction, and combined jail and prison systems in Alaska, Connecticut, Delaware, Hawaii, Rhode Island, and Vermont. Includes 15 locally operated jails in Alaska. Data are adjusted for survey and item nonresponse. The number of American Indian and Alaska Natives held in local jails excludes persons of Hispanic or Latino origin. State data are adjusted for item nonresponse and rounded to the nearest 10, except in states with an inmate populations of less than 10. The U.S. total is rounded to the nearest 100. aData are based on the last weekday in June. bData are based on the number of inmates held on December 31, 2013. Source: Bureau of Justice Statistics, Census of Jails, midyear 1999; Census of Jail Inmates, midyear 2005; and Deaths in Custody Reporting Program, Annual Summary on Inmates Under Jail Jurisdiction, yearend 2013. A M E R I C A N I N D I A N A N D A L A S K A N AT I V E S I N LO C A L J A I L S , 1999 - 2014 | S E P T E M B E R 2017 4 About 22% of jails held at least one AIAN inmate A small number of inmates were held for tribal authorities Approximately 700 local jail facilities (22% of all local jails nationwide) held at least one AIAN inmate on December 31, 2013 (figure 4). Ten facilities held more than 100 AIAN inmates at yearend (ranging from 124 to 353 inmates). In 4 of these 10 facilities, AIAN inmates made up more than 50% of their total population. In 2 of these 10 facilities, AIAN inmates made up less than 10% of their total inmate population. Three of these 10 facilities held about 10% of all AIAN inmates held in the 700 local jail facilities: San Juan County Adult Detention Center, New Mexico (353); Maricopa County Jail System, Arizona (324); and Pennington County Jail, South Dakota (262). Fifty-three local jail facilities held approximately 540 inmates for tribal authorities on December 31, 2013. Of these, 25 facilities held about 325 inmates for the Bureau of Indian Affairs (BIA), and 28 facilities held about 215 inmates for AIAN tribal governments.3 The 540 inmates held on behalf of tribal authorities made up a small portion of both the 731,600 inmates held on December 31, 2013, and the estimated 109,000 inmates held in local jails for all authorities (including federal, state, and tribal authorities). Of the approximately 700 facilities holding at least one AIAN inmate on December 31, 2013, 4 facilities reported that AIANs made up all of their inmate population (each of these facilities reported holding fewer than 10 inmates), 40 facilities reported that AIANs made up at least half of their inmate population, and 64 facilities reported AIANs made up at least a third of their inmate population. In comparison, 216 facilities reported that AIAN inmates made up less than 1% of their inmate population. The AIAN jail incarceration rate continued to increase At yearend 2013, local jails in the United States incarcerated 237 persons per 100,000 residents of all ages and races and Hispanic ethnicity. This was a slight increase from 1999 (228 per 100,000), but a decline from 259 persons per 100,000 residents in 2005 (table 3). For AIANs (single race, not of Hispanic or Latino origin), the jail incarceration rate in 2013 (398 per 100,000 AIAN U.S. residents) was higher than the national rate.4 Though the national incarceration rate decreased from 2005 to 2013, the AIAN incarceration rate increased from 359 in 2005 to 398 in 2013. While AIANs 3Inmates 4 held for the BIA and tribal governments were typically AIAN. Based on a single race and excludes persons of Hispanic or Latino origin. Figure 4 Geographic distribution of local jail facilities holding American Indian and Alaska Native inmates, December 31, 2013 Source: Bureau of Justice Statistics, Deaths in Custody Reporting Program, Annual Summary on Inmates Under Jail Jurisdiction, 2013. A M E R I C A N I N D I A N A N D A L A S K A N AT I V E S I N LO C A L J A I L S , 1999 - 2014 | S E P T E M B E R 2017 5 Table 3 Local jail inmates per 100,000 U.S. residents, by race and Hispanic origin and jurisdiction, 1999, 2005, and 2013 Region and jurisdiction U.S. total Northeast Maine Massachusetts New Hampshire New Jersey New York Pennsylvania Midwest Illinois Indiana Iowa Kansas Michigan Minnesota Missouri Nebraska North Dakota Ohio South Dakota Wisconsin South Alabama Arkansas District of Columbia Florida Georgia Kentucky Louisiana Maryland Mississippi North Carolina Oklahoma South Carolina Tennessee Texas Virginia West Virginia West Alaska Arizona California Colorado Idaho Montana Nevada New Mexico Oregon Utah Washington Wyoming 1999a 228 193 89 174 133 207 184 225 154 139 215 104 165 158 105 127 131 93 148 145 239 297 261 189 318 338 422 262 586 212 321 174 201 226 358 289 265 138 224 : 216 233 222 224 172 271 300 189 189 183 210 Total 2005a 259 197 117 197 132 202 153 277 187 157 280 123 252 179 137 180 176 148 173 185 258 343 332 220 645 358 496 402 704 221 391 198 270 287 406 291 349 224 242 : 261 227 292 265 242 294 442 180 273 202 305 2013b 237 183 132 154 139 171 137 287 176 160 253 130 237 165 118 189 186 171 157 199 212 309 322 291 378 268 417 437 669 194 448 188 329 228 410 250 347 217 216 : 210 214 221 207 282 244 427 143 247 174 251 American Indian and Alaska Native* 1999a 2005a 2013b 288 359 398 158 218 178 304 169 276 190 199 74 247 109 215 113 802 131 165 104 168 80 220 263 429 522 618 85 27 145 89 78 154 428 414 538 173 314 257 135 153 170 693 838 866 16 54 54 668 1,081 977 606 691 912 49 28 33 521 649 944 870 997 1,085 130 182 185 128 71 4 70 29 63 0 82 0 17 37 56 37 32 25 59 162 126 18 29 139 30 65 86 200 524 63 177 234 307 169 262 271 163 118 77 107 79 73 89 98 39 62 61 150 0 31 77 352 438 506 : : : 196 309 361 255 312 332 430 361 264 803 693 793 540 901 743 248 383 475 428 450 660 204 240 225 529 718 1,079 572 641 682 780 1,064 1,040 All other races and Hispanic origin 1999a 2005a 2013b 228 258 236 193 197 183 88 117 131 174 197 155 132 132 139 207 201 171 184 154 137 225 277 287 153 185 173 139 157 160 215 281 253 104 122 129 165 251 237 159 179 165 98 129 110 127 181 190 127 169 179 67 118 130 148 173 157 112 141 131 234 252 204 299 344 310 262 333 324 190 222 293 319 646 379 339 359 268 422 497 418 262 402 437 589 708 672 212 222 194 321 390 449 174 197 187 203 271 334 226 288 228 358 407 411 290 292 251 266 350 348 138 225 217 222 239 213 : : : 217 258 204 233 227 214 221 292 221 218 260 201 148 198 252 271 293 242 287 441 405 189 179 142 185 268 239 177 195 167 197 288 235 Note: Excludes jails in Indian country, jails under federal jurisdiction and combined jail and prison systems in Alaska, Connecticut, Delaware, Hawaii, Rhode Island, and Vermont. :Not calculated for 15 locally operated jails in Alaska due to low population counts. *Excludes persons of Hispanic or Latino origin and persons of two of more races. aData are based on the last weekday in June. bData are based on the number of inmates held on December 31, 2013. Source: Bureau of Justice Statistics, Census of Jails, midyear 1999; Census of Jail Inmates, midyear 2005; and Deaths in Custody Reporting Program, Annual Summary on Inmates Under Jail Jurisdiction, yearend 2013. Residential populations are based on Intercensal Estimates of the Resident Population for 1999, 2005, and 2013. A M E R I C A N I N D I A N A N D A L A S K A N AT I V E S I N LO C A L J A I L S , 1999 - 2014 | S E P T E M B E R 2017 6 in the U.S. resident population grew 16% from 1999 to 2013. the number of AIANs held in local jails increased 60%, which resulted in the higher incarceration rate in 2013. Wisconsin had the highest AIAN jail incarceration rate in 2013. From 1999 to 2013, its rate increased 25%, from 870 to 1,085 per 100,000 AIAN Wisconsin residents. The number of AIAN inmates held in Wisconsin jails increased 42% (160 inmates) during the same period, while its AIAN resident population increased by 15%. At yearend 2013, five other states had an AIAN jail incarceration rate of at least 900 per 100,000 residents of all ages: Utah (1,079 per 100,000), Wyoming (1,040), Nebraska, (977), South Dakota (944), and North Dakota (912). From 1999 to 2013, Utah's incarceration rate increased 104%, from 529 to 1,079. The number of AIAN inmates held in Utah jails increased 114% (up 160 inmates) during the same period, while its AIAN resident population increased by 7%. From 1999 to 2013, Wyoming's incarceration rate increased 33%, from 780 to 1,040. The number of AIAN inmates held in Wyoming jails increased 63% (up 50 inmates) during the same period, while its AIAN resident population increased by 23%. In all, 13 states had a higher AIAN incarceration rate than the national AIAN jail incarceration rate (398 per 100,000). From 1999 to 2013, of the 31 states whose AIAN jail incarceration rate increased, 22 states also experienced an increase in the incarceration rate among inmates of Hispanic origin and all other races other than AIAN. Among the 13 states that had a decrease in the AIAN jail incarceration rate, eight experienced an increase in the jail incarceration rate among inmates of Hispanic origin and all other races other than AIAN. At yearend 2013, jails in the Midwest (618 per 100,000 AIAN Midwest residents) and West (506) had a higher AIAN jail incarceration rate than the national AIAN jail incarceration rate (figure 5). A similar increase was observed in the Midwest from 1999 (429 AIANs per 100,000 residents) to 2005 (522) and in the West from 1999 (352) to 2005 (438). Jails in the South and Northeast both experienced increases in AIAN incarceration rates between 1999 and 2005. The incarceration rate for AIANs in Southern states was flat between 2005 and yearend 2013 (185 per 100,000 in 2013), while jails in the Northeast had lower incarceration rates in 2013 (178 per 100,000). Figure 5 Incarceration rates for American Indian and Alaska Native jail inmates, by region, 1999, 2005, and 2013 Number 800 1999 2005 2013 700 600 500 400 300 200 100 0 Total Northeast South Midwest West Source: Bureau of Justice Statistics, Census of Jails, midyear 1999; Census of Jail Inmates, midyear 2005; and Deaths in Custody Reporting Program, Annual Summary on Inmates Under Jail Jurisdiction, yearend 2013. A M E R I C A N I N D I A N A N D A L A S K A N AT I V E S I N LO C A L J A I L S , 1999 - 2014 | S E P T E M B E R 2017 7 An estimated 71% of adult AIAN jail inmates were age 39 or younger in 2011 Males made up 80% of adult AIAN jail inmates (single race, not of Hispanic or Latino origin) in 2011, the most recent year for which detailed survey data are available (table 4). Females accounted for 20% of adult AIAN inmates. The proportions of both AIAN males and females were significantly different than the distribution of male (87%) and female (13%) inmates for all other races and Hispanic origin. An estimated 71% of adult AIAN jail inmates were age 39 or younger. Young adults (ages 18 to 24) accounted for about 20% of all adult AIAN inmates, and 5% of AIAN inmates were age 55 or older. Except for inmates ages 18 to 24, the age distribution of adult AIAN jail inmates was not significantly different from all other races and Hispanic origin combined. In 2011, nearly a quarter (24%) of the AIAN jail inmates were held for a violent offense, including 5% for a violent sexual offense. AIAN jail inmates were equally as likely as adult jail inmates of all other races and Hispanic origin to be held for violent sexual offense. Drug offenders accounted for 12% of the adult AIAN jail population, which was significantly lower than all other inmates (24%). However, AIAN jail inmates were more likely (14%) than all other inmates (6%) to be held for a DWI/DUI of alcohol or drugs. The distribution of inmates held for an other public order offense (about 1 in 10) was the same for AIAN inmates and inmates of all other races and Hispanic origin. Reporting of race and Hispanic origin data For this report, the inmate count of American Indian and Alaska Natives (AIAN) was based on race and Hispanic origin and not on tribal membership. Except for table 5, the AIAN jail population was based on a single race and excludes persons of Hispanic or Latino origin. Table 5 compares selected characteristics of AIAN jail inmates based on the following four race and Hispanic origin categories in the 2011-12 National Inmate Survey (NIS-3):5 AIAN, single race, not Hispanic or Latino origin AIAN, two or more races, not Hispanic or Latino origin AIAN, single race, Hispanic or Latino origin All AIAN jail inmates, including Hispanic and non-Hispanic AIANs and single or multiple race AIANs. 5Excluded AIANs of two or more races who were of Hispanic or Latino origin. These persons were not randomly selected for the NIS-3. TABLE 4 Characteristics of adult inmates in local jails, by race and Hispanic origin, 2011 Characteristic Sex Male Female Age 18–19 20–24 25–29 30–34 35–39 40–44 45–54 55 or older Most serious offense Violent sexualb Other violentc Propertyd Druge DWI/DUIf Other public order offense Other Sentence length Unsentenced 29 days or fewer 30 days to 6 months 6 months to 1 year 1 to 5 years 5 years or more Prior incarceration as adult or juvenile Yes No Time in current facility since admission 29 days or fewer 30 days to 6 months 6 months to 1 year 1 year or more Total number of inmates Total American Indian and Alaska Nativea All other races and Hispanic origin* 87.3% 12.7 80.1%** 19.9** 87.3% 12.7 5.6% 20.2 18.8 16.0 11.2 9.7 14.2 4.2 3.8%** 16.5** 20.9 15.8 14.2 9.3 14.5 5.0 5.6% 20.3 18.8 16.1 11.2 9.7 14.2 4.1 5.1% 16.8 25.3 23.5 5.6 8.7 14.9 4.7% 18.8 23.1 11.9** 13.6** 9.6 18.2 5.2% 16.8 25.4 23.7 5.5 8.6 14.8 53.3% 2.7 10.4 10.2 14.4 9.1 47.0%** 5.9 16.0** 10.8 14.0 6.3** 53.2% 2.7 10.3 10.2 14.4 9.2 71.3% 28.7 79.3%** 20.7** 71.3% 28.7 31.4% 47.3 13.0 8.4 40.5%** 45.4 8.9** 5.2** 31.4% 47.3 13.0 8.4 720,200 12,100 708,100 Note: The NIS-3 was conducted from February 2011 to May 2012. The NIS estimates were ratio adjusted to the midyear 2011 population. See appendix table 4 for standard errors. *Comparison group. **Difference with comparison group is significant at the 95% confidence level. aExcludes persons of Hispanic and Latino origin. bIncludes rape, statutory rape, sexual assault, child molestation, pornography, incest, and indecent exposure. cIncludes robbery, manslaughter, attempted murder, and murder. dIncludes burglary, larceny, theft, auto theft, bad checks, fraud, forgery, arson, and possession of stolen goods. eIncludes possessing, selling, trafficking, importing, smuggling, and manufacturing illegal drugs and drug paraphernalia. fIncludes driving while intoxicated and driving while under the influence of drugs or alcohol. Source: Bureau of Justice Statistics, National Inmate Survey, 2011–2012. A M E R I C A N I N D I A N A N D A L A S K A N AT I V E S I N LO C A L J A I L S , 1999 - 2014 | S E P T E M B E R 2017 8 In 2011, about 8 in 10 adult AIAN jail inmates had been previously incarcerated in jail, prison, or other correctional facilities. This was higher than all other adult inmates (7 in 10). Adult AIAN jail inmates (53%) were also more likely than all other adult inmates (47%) to be sentenced for their crime. However, AIAN jail inmates (6%) were less likely than all other adult inmates (9%) to be sentenced for 5 years or longer. More adult AIAN inmates (16%) than all other adult inmates (10%) were serving 30 days to 6 months. Nearly 4 in 10 adult AIAN inmates were held in jail for 29 days or fewer since admission, compared to about 3 in 10 inmates of all other races and Hispanic origin combined. The number of jail inmates reporting partial AIAN race was six times greater than persons reporting sole AIAN race In 2011, the AIAN adult jail population ranged from an estimated 12,100 inmates (single race, non-Hispanic or Latino origin) to 68,500 inmates (all AIAN jail inmates, including Hispanic and non-Hispanic AIANs and AIANs of single or multiple races) (table 5). (See Reporting of race and Hispanic origin data text box for race classification detail.) Of the estimated 68,500 AIAN adult jail inmates, 12,600 were Hispanic or Latino of a single race and 43,800 were non-Hispanic or Latino origin of two or more races. TABLE 5 Characteristics of adult American Indian and Alaska Native jail inmates, 2011 Characteristic Sex Male Female Age 18–19 20–24 25–29 30–34 35–39 40–44 45–54 55 or older Most serious offense Violent sexual offensea Other violentb Propertyc Drugd DWI/DUIe Other public order offense Other Sentence length Unsentenced 29 days or fewer 30 days to 6 months 6 months to 1 year 1 to 5 years 5 years or more Prior incarceration as adult or juvenile Yes No Time in current facility since admission 29 days or fewer 30 days to 6 months 6 months to 1 year 1 year or more Total Total number of inmates Single race* Non-Hispanic Two or more races Hispanic origin, single race 84.4% 15.6 80.1% 19.9 85.1% 14.9 86.2% 13.8 6.0% 19.7 18.4 15.7 11.4 9.5 14.8 4.5 3.8% 16.5 20.9 15.8 14.2 9.3 14.5 5.0 6.2%** 20.9** 17.1 15.4 11.1 9.8 14.9 4.4 7.3%** 18.1 20.5 16.8 9.8** 8.5 14.7 4.4 6.8% 18.1 25.6 19.2 6.0 8.8 15.4 4.7% 18.8 23.1 11.9 13.6 9.6 18.2 7.6%** 17.3 26.7 21.8** 3.7** 8.5 14.5 5.8% 20.5 23.8 17.1** 6.9** 9.6 16.4 51.1% 3.9 11.2 9.8 15.3 8.7 47.0% 5.9 16.0 10.8 14.0 6.3 52.5% 2.8 10.4** 9.3 15.9 9.1 50.4% 5.7 9.6** 10.6 14.2 9.5 75.2% 24.8 79.3% 20.7 75.8% 24.2 69.1%** 30.8** 33.1% 47.0 11.7 8.2 40.5% 45.4 8.9 5.2 30.9%** 48.6 11.5 9.0** 33.5%** 43.3 14.7** 8.4 68,500 12,100 43,800 12,600 Note: The NIS-3 was conducted from February 2011 to May 2012. The NIS estimates were ratio adjusted to the midyear 2011 population. See appendix table 5 for standard errors. *Comparison group. **Difference with comparison group is significant at the 95% confidence level. aIncludes rape, statutory rape, sexual assault, child molestation, pornography, incest, and indecent exposure. bIncludes robbery, manslaughter, attempted murder, and murder. cIncludes burglary, larceny, theft, auto theft, bad checks, fraud, forgery, arson, and possession of stolen goods. dIncludes possessing, selling, trafficking, importing, smuggling, and manufacturing illegal drugs and drug paraphernalia. eIncludes driving while intoxicated and driving while under the influence of drugs or alcohol. Source: Bureau of Justice Statistics, National Inmate Survey, 2011–2012. A M E R I C A N I N D I A N A N D A L A S K A N AT I V E S I N LO C A L J A I L S , 1999 - 2014 | S E P T E M B E R 2017 9 Combined, males made up 84% of all AIAN adult jail inmates, which was similar across all the AIAN race and Hispanic origin categories. Regardless of the race and Hispanic origin of adult AIAN inmates, nearly 29% were age 40 or older. In comparison, nearly 4% of single race AIAN non-Hispanic inmates were ages 18 to 19. This was significantly smaller than non-Hispanics AIANs of two or more races (6%) and Hispanics of single race AIAN inmates (7%). Non-Hispanic AIAN inmates of two or more races were more likely to be held for a violent sexual offense (8%) or a drug law violation (22%) than single race, non-Hispanic AIAN inmates. Similarly, Hispanic single race AIAN inmates were more likely to be held for a drug law violation (17%). Combined, 9% of all AIAN adult jail inmates were held for a public order offense, 18% were held for a violent offense other than sexual violence, and 26% were held in jail for a property crime. About half (51%) of all AIAN inmates were unsentenced, 4% were serving less than 30 days, and 34% were serving 6 months or more. Non-Hispanic AIAN inmates of a single race were more likely to serve 30 days to 6 months (16%) than nonHispanic AIAN inmates of two or more races and Hispanic AIAN inmates of a single race (10% each). More than 34,000 American Indian and Alaska Natives were held in local jails and in state and federal prisons in 2014 The number of American Indian and Alaska Natives (AIAN) (single race, not of Hispanic or Latino origin) incarcerated in jail or prison reached an estimated 34,400 in 2014, up 72% from 20,000 in 1999 (table 6). In 2014, nearly two-thirds (21,600) were held in state (17,900) and federal (3,700) prison. The remaining 12,780 AIANs were held in local jails (10,400) and Indian country jails (2,380). Some AIAN inmates held in local jails may have been adjudicated by a tribal criminal justice system and housed in jails under contracts with tribal, city, or county governments. From 1999 to 2014, the number of AIAN inmates held in jails and prisons nationwide grew by an annual average of about 3.7%. The largest average annual growth was observed in federal prisons (up 5.2%), followed by local jails (up 4.3%), state prisons (up 3.2%), and Indian country jails (up 2.6%). The AIAN population in federal prison more than doubled (up 113%) from 1,740 in 1999 to about 3,700 in 2014. The number of AIAN inmates held in local jails increased nearly 90% from 1999 to 2014, compared to state prisons (up 61%) and Indian country jails (up 47%). According to the U.S. Census Bureau, more than 2.3 million non-Hispanic AIANs lived in the United States in 2014, up from 2 million in 1999.6 The AIAN population accounted for less than 1% of the U.S. resident population. The number of AIANs held in U.S. jails or prisons accounted for 1% of all inmates held in jail or prison in 1999 and 1.6% in 2014. The incarceration rate for AIANs was higher than the overall national incarceration rate. In 2014, federal, state, local, and tribal correctional facilities held about 1,460 AIAN inmates per 100,000 AIAN U.S. residents, up 50% from a rate of about 980 per 100,000 AIAN in 1999 (not shown). The incarceration rate among inmates of Hispanic origin and all other races other than AIAN remained relatively stable from 1999 (690) to 2014 (680). While the general population increased at similar rates (16% for AIAN and 17% for all other races and Hispanic origin), the number of AIANs incarcerated in jail and prison increased 72% from 1999 to 2014, compared to 15% among inmates of Hispanic origin and all other races combined. 6Includes race alone and excludes Hispanic or Latino origin. TABLE 6 American Indian and Alaska Natives in jail and prison, 1999, 2005, and 2014 Type of facility Total Local jailsa Jails in Indian countrya State prisonsb Federal prisonsb 1999 20,000 5,500** 1,620 11,100 1,740 Number 2005 27,300 7,600** 1,810 14,700 3,200 2014* 34,400 10,400 2,380 17,900 3,700 Percent of American Indian and Alaska Native inmates 1999 2005 2014 100% 100% 100% 27.5% 27.8% 30.2% 8.1 6.6 6.9 55.5 53.8 52.0 8.7 11.7 10.8 Percent change in number of American Indian and Alaska Native inmates 1999–2005 2005–2014 1999–2014 36.5% 26.0% 72.0% 38.2% 36.8% 89.1% 11.7 31.5 46.9 32.4 21.8 61.3 83.9 15.6 112.6 Average annual change, 1999–2014 3.7% 4.3% 2.6 3.2 5.2 Note: Detail may not sum to total due to rounding. Local jail data are based on a sample survey and are subject to sampling error. The 2005 Indian country jail population was estimated based on the average annual population change for jails reporting in both 2004 and 2007. Excludes 64 AIAN inmates held in Federal Bureau of Prison detention centers at yearend 2013. *Comparison year on local jails. **Difference with comparison year is significant at the 95% confidence level. aData are based on the number of inmates held on the last weekday in June. bState and federal prison data are based on the number of inmates held on December 31. Source: Bureau of Justice Statistics, Annual Survey of Jails, midyear 2014; Census of Jails, midyear 1999; Census of Jail Inmates, midyear 2005; Survey of Jails in Indian Country, midyear 1999 and 2014; and the National Prisoners Statistics program, yearend 1999, 2005, and 2014. A M E R I C A N I N D I A N A N D A L A S K A N AT I V E S I N LO C A L J A I L S , 1999 - 2014 | S E P T E M B E R 2017 10 Methodology Census of Jails The Bureau of Justice Statistics' (BJS) Census of Jails is part of a series of data collections that describes the nation’s local jail inmates and facility characteristics and is a complete enumeration of the more than 3,100 local jails in the United States. Because the census is a complete enumeration, the results are not subject to sampling error. The census supplies the sampling frame for BJS's Annual Survey of Jails, the Survey of Inmates in Local Jails, and the National Inmate Survey. Data from Federal Bureau of Prisons (BOP) facilities that function as jails are included in the census. Locally operated jails in Alaska, which hold inmates beyond arraignment and are staffed by municipal or county employees, are included in the census. Local jails are intended for adults but sometimes hold juveniles. The census excludes temporary holding facilities, such as drunk tanks and police lockups, that do not hold persons after they are formally charged in court (usually within 72 hours of arrest). The census also excludes state-operated facilities in Alaska, Connecticut, Delaware, Hawaii, Rhode Island, and Vermont, which have combined jail-prison systems, and are counted in BJS's prison collections. inmate population and 5% for inmate race or Hispanic origin. Detailed information on the 2013 Census of Jails methodology, survey nonresponse, imputation, and weighting procedures is available in Census of Jails: Population Changes, 1999–2013 (NCJ 248627, BJS web, December 2015). For this report, BJS re-estimated the race data for 18 facilities that imputation procedures erroneously inflated the American Indian and Alaska Native inmate population. For these 18 facilities, BJS applied the racial distribution reported in the most recent Annual Survey of Jails or Census of Jails closest to the 2013 census to the total confined inmate population reported in the 2013 Census of Jails. 2005 Census of Jail Inmates number of confined inmates and persons under the supervision of jail authorities but not confined in jail number of inmates participating in weekend programs number of confined non-U.S. citizens number of confined inmates by sex and adult or juvenile status number of juveniles held as adults conviction and sentencing status offense type number of inmates held by race or Hispanic origin The 2005 Census of Jail Inmates included all locally administered confinement facilities under the authority of 2,853 local jurisdictions, 42 privately operated jails under contract for local governments, and 65 multi-jurisdiction jails administered by two or more local governments. Thirteen facilities maintained by the BOP and functioning as jails were included in the census but excluded from the report. All jail jurisdictions responded to the census, resulting in a 100% response rate. Missing item-level response for inmate race or Hispanic origin was 5%. For this report, to provide national and state estimates of race, BJS estimated race data for 139 facilities that reported their total confined inmate population, but not race data. For 40 facilities, BJS applied the racial distribution reported in the most recent Annual Survey of Jails or Census of Jails closest to the 2005 census to the total confined inmate population reported in the 2005 Census of Jail Inmates. For 99 facilities that did not report race breakout in a recent data collection, BJS summed the reported and estimated (40 facilities) item values and then multiplied them by a nonresponse adjustment factor (NAF). The NAF was calculated as a ratio of the total number of inmates in all jails by state to the number of inmates in jails by state reported and estimated race data. For additional methodology information, see Prison and Jail Inmates at Midyear 2005 (NCJ 213133, BJS web, May 2006). number of inmates held for other jurisdictions or authorities 1999 Census of Jails average daily population rated capacity number of admissions and releases program participation for nonconfined inmates operating expenditures staff by occupational category and race or Hispanic origin. The 1999 Census of Jails included all locally administered confinement facilities under the authority of 3,084 local jurisdictions. Of these jurisdictions in the final universe, 251 provided information on critical data items only. Data from six jurisdictions that did not respond to any items on the questionnaire were imputed based on previous survey and census reports. Missing item-level response for inmate race or Hispanic origin was 14%. For this report, to provide national and state total estimates of race, BJS estimated race data for 370 facilities that reported their total confined inmate population, but not race data. For 306 facilities, BJS applied the racial distribution reported in the most recent Annual Survey of Jails or Census of Jails closest to the 1999 census to the total confined inmate population reported in the 1999 Census of Jail Inmates. For 64 facilities that did not report race breakout in a recent data collection, BJS summed the reported and estimated The Census of Jails collects facility-level information on the— 2013 Census of Jails The 2013 census included all locally administered confinement facilities (3,163) under the authority of 2,872 local jurisdictions. However, the results were affected by unit and item nonresponse. The unit-level response rate for the census was 92.4%. Missing item-level response was 1% for the A M E R I C A N I N D I A N A N D A L A S K A N AT I V E S I N LO C A L J A I L S , 1999 - 2014 | S E P T E M B E R 2017 11 (306 facilities) item values and then multiplied them by a NAF. The NAF was calculated as a ratio of the total number of inmates in all jails by state to the number of inmates in jails by state reported and estimated race data. For additional methodology information, see Census of Jails, 1999 (NCJ 186633, BJS web, August 2001). Annual Survey of Jails The ASJ is a sample survey that provides an annual source of aggregate data on local jails and jail inmates. The survey estimates characteristics of the nation’s jails and inmates housed in these jails. Data are collected on admissions and releases, number and percentage changes of jail jurisdictions, rated capacities and levels of occupancy, population supervised in the community, methods of community supervision, and crowding issues. The ASJ captures aggregated counts by race and sex, but not race by sex of inmate. The number of American Indians and Alaska Natives held in local jails excludes persons of Hispanic origin. Detailed information on the 2007 through 2014 ASJ methodology, including the survey nonresponse, imputation, and weighting procedures is available in the Jail Inmates at Midyear series. For 2000 and 2006 information, see Prison and Jail Inmates at Midyear 2000 (NCJ 185989, BJS web, March 2001) and Prison and Jail Inmates at Midyear 2006 (NCJ 217675, BJS web, June 2007). National Inmate Survey The report uses data from the 2011-12 National Inmate Survey (NIS-3) to examine the characteristics of adult AIAN inmates held in local jails. The NIS-3 is part of BJS's National Prison Rape Statistics Program, which collects reports of sexual victimization from administrative records and allegations of sexual victimization directly from victims through surveys of inmates in prisons and jails. BJS implemented this program to meet the requirements of the Prison Rape Elimination Act of 2003 (P.L. 108-79). The inmate surveys contain a wide range of data beyond measures of sexual victimization, including items useful for describing inmates held in the state and federal prisons and local jails and their confinement experiences. BJS conducted NIS-3 in 233 state and federal prisons, 358 jails, and 15 special facilities (military, Indian country, and Immigration and Customs Enforcement (ICE)) between February 2011 and May 2012. The NIS-3 comprised two questionnaires—a survey of sexual victimization and a survey of mental and physical health, past drug and alcohol use, and treatment for substance abuse. Inmates were randomly assigned to receive one of the questionnaires, and the content of the survey remained unknown to facility staff and the interviewers at the time of the interview. A total of 106,532 inmates participated in NIS-3. Combined, the victimization survey and the randomly assigned companion survey included 43,721 inmates in state and federal prisons, 61,351 inmates in jails, 605 inmates in military facilities, 192 inmates in Indian country jails, and 663 inmates in facilities operated by ICE. Selection of jail facilities In designing NIS-3, BJS selected a sample of 393 jails to represent the 2,957 jail facilities identified in the Census of Jail Inmates, 2005, and supplemented the sample with information obtained during the NIS-1 and NIS-2. The 2005 census was a complete enumeration of all jail jurisdictions, including all publicly operated and privately operated facilities under contract to jail authorities. The NIS-3 was restricted to jails that had six or more inmates on June 30, 2005. Jails identified as closed or ineligible during the NIS-1 and NIS-2 were removed from the NIS-3 frame. Based on estimates from the 2011 ASJ, jails in the NIS-3 held an estimated 720,171 inmates age 18 or older and 5,700 inmates ages 16 to 17 on June 30, 2011. Selection of inmates within jails For NIS-3, BJS obtained a roster of inmates immediately prior to the start of data collection at each facility. Inmates age 15 or younger and inmates who had not been arraigned were removed from the roster. Eligible inmates within a facility were placed into one of two stratum based on their age. Inmates who were ages 16 to 17 (juveniles) were placed in one stratum and inmates age 18 or older (adults) were placed in the other. Inmates age 15 or younger were considered ineligible for the NIS-3. Selection of adult inmates within jails The number of adult inmates sampled in each facility varied based on six criteria: an expected 3% sexual victimization prevalence rate a desired level of precision based on a standard error of 1.4% a projected 65% response rate among selected inmates a 10% chance among participating inmates of not receiving the sexual victimization questionnaire an adjustment factor of 1.9 to account for the complex survey design a pre-arraignment adjustment factor equal to 1 in facilities where the status was known for all inmates and less than 1 in facilities where only the overall proportion of inmates who were pre-arraigned was known. Each eligible adult inmate was assigned a random number and sorted in ascending order. Inmates were selected from the list up to the expected number of inmates determined by the sampling criteria. Due to the dynamic nature of jail populations, a second roster of inmates was obtained on the first day of data collection. Eligible adult inmates who appeared on the second roster but who had not appeared on the initial roster were identified. These inmates had been arraigned since the initial roster was created or were newly admitted to the facility and arraigned. A random sample of the new inmates was chosen using the same probability of selection used to sample from the first roster. A M E R I C A N I N D I A N A N D A L A S K A N AT I V E S I N LO C A L J A I L S , 1999 - 2014 | S E P T E M B E R 2017 12 Methods for adjusting for survey nonresponse and coverage error are described in detail in Sexual Victimization in Prisons and Jails as Reported by Inmates, 2011–12 (NCJ 241399, BJS web, May 2013). Survey of Jails in Indian Country The annual Survey of Jails in Indian Country (SJIC) provides a source of data on Indian country jails and jail inmates, including counts, movements, facility operations, and staff. In selected years (1998, 2004, 2007, and 2011), additional information was collected on facility programs and services, such as medical assessments and mental health screening procedures, inmate work assignments, counseling, and educational programs. The enumeration includes all Indian country correctional facilities operated by tribal authorities or the Bureau of Indian Affairs, U.S. Department of the Interior, to describe adult and juvenile jail facilities and detention centers in Indian country. For this report, Indian country included reservations, pueblos, rancherias, and other appropriate areas (18 U.S.C. § 1151). The number of Indian country jail facilities increased from 68 at midyear 1999 to 79 facilities at midyear 2014. Detailed information on the 1999-2014 SJIC methodology, survey nonresponse, and procedures is available in the Jails in Indian Country series on the BJS website. National Prisoner Statistics program The National Prisoner Statistics (NPS) program collects annual data on prisoners at yearend. Prior to 2011, the NPS gathered custody population by race at midyear. BJS depends entirely on voluntary participation of state departments of corrections and BOP for NPS data. The NPS distinguishes between inmates in custody and prisoners under jurisdiction. To have custody of a prisoner, a state or the BOP must hold that inmate in one of its facilities. To have jurisdiction over a prisoner, the state or BOP must have legal authority over that prisoner, regardless of where the prisoner is incarcerated or supervised. Some states were unable to provide counts that distinguish between custody and jurisdiction. The NPS jurisdiction counts include persons held in prisons, penitentiaries, correctional facilities, halfway houses, boot camps, farms, training or treatment centers, and hospitals. Counts also include prisoners who were temporarily absent (less than 30 days), in court, or on work release; housed in privately operated facilities, local jails, or other state or federal facilities; and serving concurrent sentences for more than one correctional authority. For table 6, the 1999 and 2005 state and federal prison data are based on the custody population at midyear, and the 2014 data are based on the yearend custody population. For this report, the state and federal custody prison population for 2014 is estimated based on the ratio of the custody count to the jurisdiction count from the 2010 NPS, and applied to the 2014 jurisdiction population by race. Detailed information on the 1999-2014 NPS methodology, the survey nonresponse, and procedures is available in the Prisoners series and Prison and Jail Inmates series, which are both on the BJS website. Additional notes for figures Data for figures 1-5 exclude jails in Indian country; the federal jurisdiction; and combined jail and prison systems in Alaska, Connecticut, Delaware, Hawaii, Rhode Island, and Vermont. Figures include 15 locally operated jails in Alaska. Data are adjusted for survey and item nonresponse. The number of American Indians and Alaska Natives held in local jails excludes persons of Hispanic origin. Unless noted for a specific year, data are based on the number of inmates held on the last weekday in June. A M E R I C A N I N D I A N A N D A L A S K A N AT I V E S I N LO C A L J A I L S , 1999 - 2014 | S E P T E M B E R 2017 13 Appendix Table 1 Reported data for table 1: Estimated number and percent of inmates in local jails, by race and Hispanic origin, 1999–2000 and 2005–2014 American Indian and Alaska Native 4,519 4,974 7,270 8,052 8,347 8,638 8,328 8,223 8,527 8,292 8,793 7,521 9,285 Year 1999 2000 2005 2006 2007 2008 2009 2010 2011 2012 2013 2013 2014 All other races and Hispanic origin 570,241 559,963 705,369 728,023 747,916 745,738 672,590 612,428 658,360 656,966 622,433 578,975 655,290 Source: Bureau of Justice Statistics, Annual Survey of Jails, midyear 2000 and midyear 2006–2014; Census of Jails, midyear 1999; Census of Jail Inmates, midyear 2005; and Deaths in Custody Reporting Program, Annual Summary on Inmates Under Jail Jurisdiction, yearend 2013. Appendix Table 2 Standard errors for table 1: Estimated number and percent of inmates in local jails, by race and Hispanic origin, 1999–2000 and 2005–2014 Year 1999 2000 2005 2006 2007 2008 2009 2010 2011 2012 2013 2013 2014 Total ~ 2,504 ~ 3,552 3,720 4,016 4,231 5,430 6,009 7,684 8,042 ~ 8,382 American Indian and Alaska Native ~ 363 ~ 651 700 730 756 1,031 933 866 932 ~ 926 Appendix Table 3 Confidence intervals for table 1: Estimated number and percent of inmates in local jails, by race and Hispanic origin, 1999–2000 and 2005–2014 Year 1999 2000 2005 2006 2007 2008 2009 2010 2011 2012 2013 2013 2014 Total Lower Upper bound bound ~ ~ 616,242 626,058 ~ ~ 758,858 772,782 772,879 787,461 777,659 793,401 759,137 775,723 738,087 759,373 723,822 747,378 729,459 759,581 715,438 746,962 ~ ~ 728,172 761,028 American Indian and Alaska Native Lower Upper bound bound ~ ~ 4,789 6,211 ~ ~ 7,123 9,677 7,228 9,972 7,569 10,431 7,918 10,882 7,879 11,921 7,571 11,229 7,603 10,997 8,373 12,027 ~ ~ 8,585 12,215 All other races and Hispanic origin Lower Upper bound bound ~ ~ 609,434 621,766 ~ ~ 749,919 764,881 763,781 779,219 768,511 784,689 748,601 767,599 727,530 750,070 713,801 738,599 719,689 750,911 704,616 737,384 ~ ~ 717,730 750,670 Note: Confidence interval indicates that if different samples were drawn, values would fall between the lower and upper bound estimates 95 out of 100 times. ~Not applicable. Data represent a complete enumeration based on a jail census. Source: Bureau of Justice Statistics, Annual Survey of Jails, midyear 2000 and midyear 2006–2014; Census of Jails, midyear 1999; Census of Jail Inmates, midyear 2005; and Deaths in Custody Reporting Program, Annual Summary on Inmates Under Jail Jurisdiction, yearend 2013. All other races and Hispanic origin ~ 3,146 ~ 3,817 3,938 4,127 4,847 5,750 6,326 7,965 8,359 ~ 8,403 ~Not applicable. Data represent a complete enumeration based on a jail census. Source: Bureau of Justice Statistics, Annual Survey of Jails, midyear 2000 and midyear 2006 –2014; Census of Jails, midyear 1999; Census of Jail Inmates, midyear 2005; and Deaths in Custody Reporting Program, Annual Summary on Inmates Under Jail Jurisdiction, yearend 2013. A M E R I C A N I N D I A N A N D A L A S K A N AT I V E S I N LO C A L J A I L S , 1999 - 2014 | S E P T E M B E R 2017 14 Appendix Table 4 Standard errors for table 4: Characteristics of adult inmates in local jails, by race and Hispanic origin, 2011–2012 Characteristic Sex Male Female Age 18–19 20–24 25–29 30–34 35–39 40–44 45–54 55 or older Most serious offense Violent sexual Other violent Property Drug DWI/DUI Other public order offense Other Sentence length Unsentenced 29 days or fewer 30 days to 6 months 6 months to 1 year 1 to 5 years 5 years or more Prior incarceration as adult or juvenile Yes No Time in current facility since admission 29 days or fewer 30 days to 6 months 6 months to 1 year 1 year or more Total American Indian and Alaska Native All other races and Hispanic origin 0.74% 0.74 2.40% 2.40 0.74% 0.74 0.20% 0.30 0.28 0.26 0.20 0.19 0.34 0.16 0.84% 1.82 2.08 1.86 1.82 1.49 1.52 0.88 0.20% 0.30 0.28 0.26 0.20 0.19 0.34 0.16 0.21% 0.55 0.41 0.58 0.26 0.29 0.42 0.83% 1.88 2.42 1.57 2.66 1.50 2.09 0.21% 0.55 0.41 0.58 0.26 0.29 0.42 0.92% 0.17 0.40 0.36 0.48 0.46 2.95% 1.73 1.92 1.17 1.58 1.30 0.93% 0.17 0.40 0.36 0.48 0.46 0.41% 0.41 2.91% 2.91 0.41% 0.41 0.72% 0.52 0.40 0.45 2.54% 2.49 1.42 1.03 0.72% 0.52 0.40 0.45 Source: Bureau of Justice Statistics, National Inmate Survey, 2011–2012. A M E R I C A N I N D I A N A N D A L A S K A N AT I V E S I N LO C A L J A I L S , 1999 - 2014 | S E P T E M B E R 2017 15 Appendix Table 5 Standard errors for table 5: Characteristics of adult American Indian and Alaska Native jail inmates, 2011–2012 Non-Hispanic Characteristic Sex Male Female Age 18–19 20–24 25–29 30–34 35–39 40–44 45–54 55 or older Most serious offense Violent sexual Other violent Property Drug DWI/DUI Other public order offense Other Sentence length Unsentenced 29 days or fewer 30 days to 6 months 6 months to 1 year 1 to 5 years 5 years or more Prior incarceration as adult or juvenile Yes No Time in current facility since admission 29 days or fewer 30 days to 6 months 6 months to 1 year 1 year or more Two or more races Hispanic origin, single race Total Single race 1.10% 1.10 2.40% 2.40 1.70% 1.70 2.17% 2.17 0.52% 0.79 0.82 0.69 0.61 0.57 0.78 0.43 0.84% 1.82 2.08 1.86 1.82 1.49 1.52 0.88 0.66% 0.97 1.04 0.90 0.69 0.72 0.90 0.51 1.37% 1.95 1.75 1.82 1.31 1.16 2.10 1.33 0.52% 0.86 1.03 0.94 0.72 0.69 0.94 0.83% 1.88 2.42 1.57 2.66 1.50 2.09 0.70% 1.01 1.31 1.17 0.46 0.71 1.08 1.20% 2.08 1.94 1.90 1.34 1.79 2.57 1.27% 0.56 0.78 0.64 0.99 0.63 2.95% 1.73 1.92 1.17 1.58 1.30 1.44% 0.40 0.82 0.83 1.24 0.74 2.89% 1.41 1.50 1.42 1.68 1.32 0.89% 0.89 2.91% 2.91 1.11% 1.11 2.34% 2.34 1.27% 1.16 0.73 0.69 2.54% 2.49 1.42 1.03 1.44% 1.41 0.89 0.93 2.01% 2.25 2.04 1.32 Source: Bureau of Justice Statistics, National Inmate Survey, 2011–2012. A M E R I C A N I N D I A N A N D A L A S K A N AT I V E S I N LO C A L J A I L S , 1999 - 2014 | S E P T E M B E R 2017 16 The Bureau of Justice Statistics of the U.S. Department of Justice is the principal federal agency responsible for measuring crime, criminal victimization, criminal offenders, victims of crime, correlates of crime, and the operation of criminal and civil justice systems at the federal, state, tribal, and local levels. BJS collects, analyzes, and disseminates reliable and valid statistics on crime and justice systems in the United States, supports improvements to state and local criminal justice information systems, and participates with national and international organizations to develop and recommend national standards for justice statistics. Jeri M. Mulrow is acting director. This report was written by Todd D. Minton of BJS and Susan Brumbaugh and Harley Rohloff of RTI International. Zhen Zeng and Jennifer Bronson verified the report. Brigitte Coulton and Jill Thomas edited the report. Tina Dorsey produced the report. September 2017, NCJ 250652 NCJ250652 Office of Justice Programs Building Solutions • Supporting Communities • Advancing Justice www.ojp.usdoj.gov