
Mortality in Local Jails 2000-2007, DOJ BJS, 2010
Download original document:
Document text
Document text
This text is machine-read, and may contain errors. Check the original document to verify accuracy.
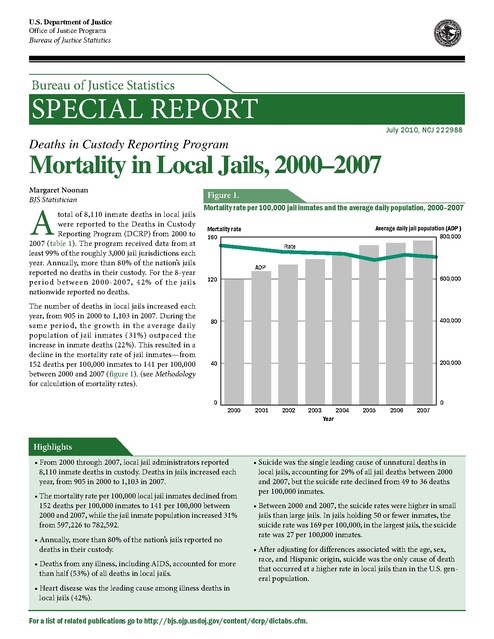
U.S. Department of Justice
Office of Justice Programs

Bureau of Justice Statistics

Bureau of Justice Statistics

SPECIAL REPORT

July 2010, NCJ 222988

Deaths in Custody Reporting Program

Mortality in Local Jails, 2000–2007
Margaret Noonan
BJS Statistician

A

total of 8,110 inmate deaths in local jails
were reported to the Deaths in Custody
Reporting Program (DCRP) from 2000 to
2007 (table 1). The program received data from at
least 99% of the roughly 3,000 jail jurisdictions each
year. Annually, more than 80% of the nation’s jails
reported no deaths in their custody. For the 8-year
period between 2000-2007, 42% of the jails
nationwide reported no deaths.
The number of deaths in local jails increased each
year, from 905 in 2000 to 1,103 in 2007. During the
same period, the growth in the average daily
population of jail inmates (31%) outpaced the
increase in inmate deaths (22%). This resulted in a
decline in the mortality rate of jail inmates—from
152 deaths per 100,000 inmates to 141 per 100,000
between 2000 and 2007 (figure 1). (see Methodology
for calculation of mortality rates).

Figure 1.
Mortality rate per 100,000 jail inmates and the average daily population, 2000–2007
Average daily jail population (ADP )
800,000

Mortality rate
160
Rate
ADP
120

600,000

80

400,000

40

200,000

0

0
2000

2001

2002

2003

2004

2005

2006

2007

Year

Highlights
• From 2000 through 2007, local jail administrators reported
8,110 inmate deaths in custody. Deaths in jails increased each
year, from 905 in 2000 to 1,103 in 2007.
• The mortality rate per 100,000 local jail inmates declined from
152 deaths per 100,000 inmates to 141 per 100,000 between
2000 and 2007, while the jail inmate population increased 31%
from 597,226 to 782,592.
• Annually, more than 80% of the nation’s jails reported no
deaths in their custody.
• Deaths from any illness, including AIDS, accounted for more
than half (53%) of all deaths in local jails.

• Suicide was the single leading cause of unnatural deaths in
local jails, accounting for 29% of all jail deaths between 2000
and 2007, but the suicide rate declined from 49 to 36 deaths
per 100,000 inmates.
• Between 2000 and 2007, the suicide rates were higher in small
jails than large jails. In jails holding 50 or fewer inmates, the
suicide rate was 169 per 100,000; in the largest jails, the suicide
rate was 27 per 100,000 inmates.
• After adjusting for differences associated with the age, sex,
race, and Hispanic origin, suicide was the only cause of death
that occurred at a higher rate in local jails than in the U.S. general population.

• Heart disease was the leading cause among illness deaths in
local jails (42%).
For a list of related publications go to http://bjs.ojp.usdoj.gov/content/dcrp/dictabs.cfm.

From 2000 to 2007, between 3,072 and 2,924 jail
jurisdictions, reported data to the DCRP (table 2).
In 2000, nearly 9 out of 10 jails (86%) reported zero
deaths. By 2007, 8 out of 10 jails (81%) of jails
reported zero deaths. For the eight-year period
between 2000 and 2007, about 8 in 10 jails (83%)
reported zero deaths. For the same period, about 1
in 10 jails (12%) reported a single death, and less
than 1 in 10 jails (5%) reported 2 or more deaths.
During this time, no more than 2% of jails reported
more than 3 deaths (appendix table 1).

Between 2000 and 2007, suicides were the
leading cause of death, but suicide rates
continued to decline
Suicide was the single leading cause of death in local
jails (29%), followed by deaths associated with heart
disease (22%), intoxication (7%), and AIDS-related
causes (5%) (figure 2). No other single known cause
of death, including accidents (3%) and homicides
( 2 % ), a c c ou nt e d f or at l e a s t 5 % of d e at hs .
Collectively, deaths from any illness, such as heart
disease, AIDS, cancer, and liver disease, accounted
for the majority (53%) of jail deaths during 2000 to
2007. (See Methodology for a discussion on the
nature of illness deaths).

Table 1.
Number of deaths and mortality rate per 100,000 jail inmates, by cause, 2000–2007
Jail inmate deaths
Number
Percent
8,110
100 %
2,363
29 %
4,288
53 %
1,789
22
410
5
273
3
234
3
1,582
20
567
7%
229
3%
172
2%
491
6%

All causes
Total
Suicide
Illness
Heart disease
AIDS
Cancer
Liver disease
All other illnesses*
Drug/alcohol intoxication
Accident
Homicide
Other/unknown

Average annual mortality rate
per 100,000 jail inmates
145
42
77
32
7
5
4
28
10
4
3
8

Note: Mortality rates are based on average daily population as reported to the Deaths in
Custody Reporting Program.
*Includes other specified (such as influenza, septicemia, diabetes, and hepatitis) and unspecified or
unknown illnesses. See appendix tables 2 and 3 of this report for a list of the more than 50 illnesses
reported to the program. See Methodology for details on illness classifications.

Table 2.
Number and percent of jail jurisdictions, by number of deaths reported each year, 2000-2007

Year
2000
2001
2002
2003
2004
2005
2006
2007
Annual average
2000-2007

Number reporting to the
Deaths in Custody Reporting
Program (DCRP)
3,072
3,052
3,036
3,019
3,003
2,977
2,946
2,924
3,004

Number of jail jurisdictions reporting deaths
0 deaths
1 death
2 or more deaths
Number
Percent
Number
Percent
Number Percent
2,631
86%
293
10%
148
5%
2,562
84
334
11
156
5
2,543
84
339
11
154
5
2,496
83
363
12
159
5
2,477
82
372
12
154
5
2,447
82
368
12
162
5
2,395
81
380
13
171
6
2,378
81
363
12
183
6
2,491

83%

352

12%

161

5%

Note: Detail may not sum to total due to rounding. See Methodology of this report for response rates. Declining number of
jails is documented in Jail Inmates at Midyear, 2007, BJS Web, 6 June 2008.

2

Mortality in Local Jails, 2000–2007

While suicide has been the leading cause of death in
local jails since the 1980s, it has declined over time.
The suicide rate among jail inmates was 129 per
100,000 inmates in 1983, but 10 years later the rate
had declined by more than half to 54 per 100,000
inmates. 1 From 2000 to 2007, the suicide rate
declined by about a quarter, from 49 to 36 suicide
deaths per 100,000 jail inmates. (table 3).
Besides suicide, AIDS-related deaths were the only
other leading cause of death that declined among
jail inmates. Over the 8-year period, mortality due
to AIDS declined by 50%, from 10 to 5 deaths per
100,000 inmates. The mortality rates for deaths
from all other leading causes of illness in jails
during this time period showed little variation.
Deaths due to accidents (4 per 100,000) and
homicides (3 per 100,000) also remained relatively
constant throughout 2000 to 2007. By comparison,
the mortality rate for intoxication nearly doubled
from 6 per 100,000 inmates in 2000 to 10 per
100,000 in 2007.

Ten types of medical conditions accounted for
about 8 in 10 illness deaths in jail
Local jail administrators reported over 50 different
medical conditions that led to an inmate’s death
between 2000 and 2007. Of these 50 fatal medical
conditions, 10 accounted for 77% of all illness-related
deaths in local jails (appendix table 2). Heart disease
was the leading cause of illness-related deaths (42% of
illness deaths), and was reported at least 3 times as
frequently as any other death due to illness (appendix
table 4). Besides heart disease and AIDS, no single
medical cause of death accounted for more than 5% of
the illness-related deaths in jails between 2000 and
2007.
Overall, 93% of deaths reported to DCRP during
the 8-year period indicated that an autopsy was
completed. A definitive cause of death could not be
determined for 6% (or 491) of deaths in local jails,
and an autopsy was conducted in the majority
(86%) of these unresolved cases (not shown in a
table). No additional information was provided in
about two-thirds of all undetermined deaths. In the
remaining cases, either the information given was
insufficient to determine the manner of death or the
autopsy was inconclusive.

Figure 2.
Top four causes of death in local jails, 2000-2007
Mortality rate per 100,000 jail inmates
60

50

40

Suicide
Heart disease

30

20

Drug/alcohol
Intoxication
AIDS

10

0
2000

2001

2002

2003

2004

2005

2006

2007

Table 3.
Mortality rate per 100,000 jail inmates, by cause and year, 2000–2007
All causes
2000
152
Total
Suicide
48
Illness
87
Heart disease
33
AIDS
10
Cancer
5
Liver disease
4
All other illnesses*
35
Drug/alcohol intoxication
6
Accident
4
Homicide
3
Other/unknown
3

2001
149
49
77
34
9
4
4
25
9
6
3
5

2002
146
47
76
33
7
6
4
26
8
6
3
6

2003
145
43
74
35
8
5
4
22
13
4
2
9

2004
144
42
75
32
7
4
4
27
11
4
3
8

2005
138
38
67
27
5
5
4
26
11
3
3
17

2006
143
36
79
32
7
5
3
31
11
4
5
7

2007
141
36
78
30
5
5
5
32
10
2
3
12

Note: Mortality rates are based on the average daily population as reported to the Deaths in
Custody Reporting Program.
*Includes other specified (such as influenza, septicemia, diabetes, and hepatitis) and unspecified or
unknown illnesses. See appendix tables 2 and 3 of this report for a list of the more than 50 illnesses
reported to the program. See Methodology for details on illness classifications.

1
See Suicide and Homicide in State Prisons and Local Jails, BJS
Web, 21 August 2005.

July 2010

3

Over half of deaths occurred within 1 month
of admission
Nearly a quarter (24%) of deaths occurred within 2
days of admission (not shown in table). Overall,
more than a third (38%) of deaths took place within
the first 7 days (table 4). Over half (56%) of inmate
deaths occurred within 30 days of admission.

Figure 3.
Estimated distribution of time served by jail inmates, 2000-2007

More than180 days
121-180 days
61-120 days

4%
3%
6%

31-60 days

6%
80%

13%

7%

10%
5%
11%

13%

13%

8%
14%

11%
11%
63%

13%

56%
52%
30 days or less

Jail discharges

All causes

Suicide

Heart disease

The distribution of inmate deaths occurring in the
first month varied by cause. The majority of
suicides (64%), intoxication (80%) and accidental
deaths (62%) occurred in the first month. Deaths
due to other illness-related causes were more
frequently observed among inmates serving longer
sentences. Over a third of cancer deaths (36%) and
a fifth of AIDS-related deaths occurred more than
180 days after admission.
The pattern of deaths since admission generally
corresponds with the length of stay in jail and
whether an inmate has been detained long enough
to be at risk of dying during a certain time period.
The number of deaths occurring within the first
month of admission generally corresponds with the
number of inmates who spend less than one month
in jail. The Annual Survey of Jails (ASJ) found local
jails admitted an estimated 13 million inmates
during the 12 months ending June 29, 2007, with an
estimated 80% (10.4 million) serving their time
within one month. Data from the 2004 Survey of
Large Jails (SLJ), which collected discharge data
from the largest jail jurisdictions (1,000 or more
inmates), found that more than two-thirds (46%) of
jail inmates were released within two days of
admission, and a majority (80%) served less than a
month (figure 3). Between 3 and 6% of jail inmates
served past day 31. While the survey was limited to
the largest jails, these facilities held more than half
of the U.S. jail inmate population (52%). These
facilities' turnover rates (54%) were half the
turnover rate for the smallest jails (110%). If the
sample included all jails, the inverse relationship
between expected length of stay and facility size
would likely increase the frequency of inmates
serving less than 30 days and reduce the pool of
inmates at risk of dying during lengthier stays.

Table 4.
Distribution of deaths, by time served (days) since admission and cause of death, 2000-2007
Percent of jail deaths
Percent of jail
Heart
Liver
All other Drug/alcohol
Time served
discharges*
All causes Suicide
Illness disease
AIDS
Cancer disease illnesses intoxication
7 or less days
62%
38%
47%
27%
32%
7%
4%
24%
31%
74%
18
18
16
21
21
20
12
18
22
7
8-30 days
31-60 days
6
11
11
13
13
13
14
16
12
3
61-120 days
6
13
11
15
13
23
18
18
14
5
121-180 days
3
7
5
9
8
16
16
9
8
3
More than 180 days
4
13
10
15
13
21
36
16
13
8
Note: Details may not sum to total due to rounding.
*The percent of jail discharges are based on unpublished BJS data from the 2004 Survey of Large Jails. See Methodology.

4

Mortality in Local Jails, 2000–2007

Accident
51%
11
8
10
5
15

Homicide
27%
25
10
16
8
14

Suicide rates in the nation’s smallest jails were
6 times higher than in the largest facilities
Suicide rates were higher in smaller facilities than in
larger facilities. According to the 2005 Census of
Jai ls , l arge jai ls —hol ding an ave rage d ai ly
population (ADP) of 1,000 or more inmates—made
up about 6% of all jails, and in 2007 these jails held
52% of the nation's jail population. About 40% of all
jails held fewer than 50 inmates on an average day,
and in 2007 these jails held about 3% of all jail
inmates. The smallest jails had the highest average
annual suicide rate (169 per 100,000 inmates), while
the 50 largest jails had the lowest average annual
suicide rate (27 per 100,000 inmates) (table 5).
The lower rate of suicide in large jails may reflect
the capacity of these jails to provide a variety of
suicide prevention measures. According to the most
recent data available in the 1999 Census of Jails,
over half (54%) of jails holding fewer than 50
i n m at e s prov i d e d s t af f t r a i n i ng i n s u i c i d e
prevention, compared to 91% of the largest jails.
Fewer than half (41%) of the smallest jails provided
inmate counseling or psychiatric services, while
such services were provided by over 90% of the
largest facilities (table 6). Overall, the availability of
various suicide prevention measures increased with
facility size.

The mortality rate for jails holding more than 50
but fewer than 500 inmates decreased as facility size
increased. The mortality rate of facilities with an
ADP of fewer than 50 inmates (284 per 100,000)
was at least 60% higher than that of any other
facility size category. Medium-sized jails, holding
between 100 and 499 inmates, had the lowest
overall mortality rate (113 and 115 per 100,000).
Larger jails (those holding more than 500 inmates)
generally had higher mortality rates from illness
deaths, such as AIDS, cancer, and liver disease.
Small jails, holding fewer than 50 inmates, had an
intoxication mortality rate (31 per 100,000) that was
three times higher than the 50 largest jails (8 per
100,000). Also, the smallest jails had the highest
accident mortality rate (11 per 100,000), and the
highest rate of deaths without a known cause (13
per 100,000). However, homicide rates were highest
in the 50 largest jails with 6 per 100,000 inmates,
compared to 1 per 100,000 for the smallest jails.

Table 6.
Special inmate counseling and psychiatric services, by size of jail jurisdiction, 1999

This comparatively high suicide rate may be due in
part to the high turnover rate and the resulting
shorter inmate stays in small facilities. 2
2Turnover rate is calculated by taking the sum of admissions plus
releases, and dividing by the average daily population. For more
information on frequency of turnover, see Jail Inmates at Midyear 2007, BJS Web, 6 June 2008.

Service provided
Staff suicide riskassessment training
Yes
No
Don’t know
Counseling
Yes
No
Don’t know

Size of jail*
100 to 499 500 to 999

Less than 50 50 to 99

1,000 or more

54.4 %
37.4
8.2

65.2 %
26.4
8.3

76.5 %
18.3
5.3

88.4 %
7.2
4.3

90.8 %
8.3
0.8

41.1 %
50.6
8.2

62.1 %
29.6
8.3

74.2 %
20.5
5.3

89.9 %
5.8
4.3

93.3 %
5.8
0.8

Note: Data are the most recent available from the Census of Jails 1999, BJS Web, 1 September
2001. Suicide prevention program items were not included in the more recent 2006 Census of
Jails.
*Based on the average daily population (ADP) in 12 months ending June 30, 1999.

Table 5.
Average annual mortality rate per 100,000 jail inmates, by cause of death and size of jail, 2000–2007
Average annual mortality
Size of jurisdiction
rate, 2000–2007
All jails
145
Less than 50 inmates
284
50 to 99
159
100 to 249
115
250 to 499
113
500 to 999
119
1,000 or more (excluding
137
50 largest jails)
50 largest jails
170

Suicide
42
169
70
49
44
37

Heart
disease
32
34
34
22
25
28

AIDS
8
1
1
1
1
4

32
27

32
41

11
15

Cancer
5
1
1
1
2
4
5
10

Liver
disease
4
2
3
1
3
3
5
7

All other Drug/alcohol
illnesses* intoxication
Accident
28
10
4
22
31
11
18
17
6
16
12
3
19
10
3
22
7
3
28
44

9
8

4
5

Homicide
3
1
2
2
1
2
2
6

Other/
unknown
8
13
8
7
6
8
9
10

Note: Detail may not sum to total because some jails did not report an average daily population. The largest jails were the 50 largest jails as of June 30, 2006.
*Includes other specified (such as influenza, septicemia, diabetes, and hepatitis) and unspecified or unknown illnesses. See appendix tables 2 and 3 of this report
for a list of the more than 50 illnesses reported to the program. See Methodology for details on illness classifications.

July 2010

5

Despite the higher mortality rates experienced by
the nation’s smallest jails, these facilities accounted
for a small percentage of all jail deaths (7%) (table
7). Jails holding at least 1,000 inmates accounted for
4,251 (52%) of deaths reported over the 8-year
period. Between 2000 to 2007, with the exception of
one jail in 2002, no jails holding fewer than 500
inmates reported more than 3 deaths.

The 50 largest jail jurisdictions accounted for
a third of all jail deaths in the United States
The 50 largest jails accounted for about a third of
the jail population in the United States and 35% of
all jail deaths. These large urban jails accounted for
about 60% of the jail deaths from cancer, AIDS, and

homicide. In contrast, 19% of jail suicides and 23%
of jail intoxication deaths occurred in the 50 largest
jurisdictions.
Heart disease was the leading cause of death in the
50 largest jail jurisdictions (41 per 100,000),
followed by suicide (27 per 100,000). For all other
jails, suicide was the leading cause of death,
followed by heart disease. The death rate from
AIDS in the 50 largest jails (15 per 100,000) was 7.5
times higher than the rate in jails holding less than
1,000 inmates (2 per 100,000) (not shown in a
table). The homicide rate in the 50 largest jails was 3
times that of all other jails. The rate of intoxication
deaths was 4 times higher in the smallest jails (31
per 100,000), compared to the 50 largest jails (8 per
100,000).

Table 7.
Number of jail inmate deaths, by cause and size of jail jurisdiction, 2000–2007
Total number of
deaths, 2000-2007
Size of jurisdictiona
All deaths
8,110
Less than 50 inmates
560
50 to 99
512
100 to 249
853
250 to 499
872
500 to 999
1,060
1,000 or more (excluding
1,400
50 largest jails)
50 largest jails
2,851

Suicide
2,363
335
225
361
334
335

Heart
disease
1,789
67
108
162
194
250

AIDS
410
2
2
11
11
33

Liver
Cancer disease
273
234
2
5
2
8
9
8
17
23
32
31

329
678

104
247

49
162

324
448

50
109

All other
illnessesb
1,582
42
60
121
145
192

Drug/alcohol
intoxication
567
60
54
88
74
65

286
736

96
130

Other/
Accident Homicide unknown
229
172
491
21
2
24
19
8
26
25
13
55
22
6
46
28
21
73
37
77

24
98

101
166

Note: Details may not sum to the total due to missing data.
aNumber of inmates is based on the average daily population (ADP) for the years 2002 through 2007. In 2000 and 2001, ADP was estimated by taking the average of

January 1 and December 31 one-day inmate population counts.
b
Includes other specified (such as influenza, septicemia, diabetes, and hepatitis) and unspecified or unknown illnesses. See appendix tables 2 and 3 of this report for
a list of the more than 50 illnesses reported to the program. See Methodology for details on illness classifications.

6

Mortality in Local Jails, 2000–2007

Mortality differs among prison and jail populations
Local jails and state prisons differ in their general purposes,
populations housed, and terms of confinement.3 Jails are locally
operated facilities that confine persons before or after
adjudication. In addition to convicted inmates, jails also hold
inmates awaiting arraignment, trial, and conviction or
sentencing. The annual volume of admissions into jails is about
17 times the size of the jail population at midyear. The mean
time served in local jails is about 21 days.
State prisons typically only house sentenced felons, with annual
admissions that amount to just over half of their yearend
population. In 2006 the mean time served by offenders released
from state prison was 32 months.
As a result of the differences between jails and state prisons, the
number, rate, and pattern of deaths differed. Between 2000 and
2007, an average of 3,134 state prisoner deaths occurred each
year, compared to 1,029 jail inmate deaths each year (table 8).

The overall mortality rate in state prisons (251 per 100,000
prisoners) was 1.7 times higher than that of local jails (143 per
100,000 inmates) for the same period.4 In both jails (22%) and
state prisons (27%), heart disease accounted for about a quarter
of all deaths. The rate of heart disease deaths in state prisons (69
per 100,000) was twice that reported by local jails (32 per
100,000).
In state prisons, cancer also accounted for a quarter of all deaths
(23%), while cancer accounted for 3% of jail fatalities. The
cancer mortality rate in state prison (58 per 100,000) was 12
times that observed in jails (5 per 100,000). The suicide
mortality rate in jails (42 per 100,000) was 2.6 times that in state
prisons (16 per 100,000).
4
The DCRP began collecting death data from state prisons starting in 2001. Prior
to 2001, data was limited to counts of deaths by manner of death and sex. For more
information, See Medical Causes of Death in State Prisons, 2001-2004, BJS Web, 21
January 2007.

3
For details on the differences between prison and jail populations, see page 6 of
Prison and Jail Inmates at Midyear 2000, BJS Web, 25 March 2001.

Table 8.
Number and mortality rate per 100,000 state prison and jail inmate deaths, by cause, 2001–2007
All causes
Total
Illness
Heart disease
Cancer
AIDS
All liver diseases
All other illnesses
Suicide
Homicide
Drug/alcohol intoxication
Accident
Other/unknown

Number of state prisoner
deaths, 2001–2007
21,936
19,467
5,995
5,098
1,274
2,227
4,874
1,386
356
254
208
265

Average annual mortality
rate per 100,000 state
prisoners, 2001–2007
251
223
69
58
15
26
56
16
4
3
2
3

Number of jail inmate
deaths, 2001–2007
7,205
3,771
1,592
242
352
210
1,375
2,074
155
530
204
471

Average annual mortality rate
per 100,000 jail inmates
143
75
32
5
7
4
27
42
3
10
4
9

Note: Executions are not included; for data on executions, see Capital Punishment, 2005, BJS Web, 10 December 2006. Mortality rates
are based on average daily population as reported to the Deaths in Custody Reporting Program. Prisons began collection of death
records under the Deaths in Custody Reporting Act in 2001. See Methodology for more information. Prison mortality rates are based
on a June 30 custody count.

July 2010

7

Mortality rate for males was slightly higher
than females
Males were slightly more likely than females to die
in local jails. The mortality rate for males was 146
per 100,000 compared to 136 per 100,000 for female
jail inmates (table 9). Males (33 per 100,000) were
1.3 times more likely than females to die of heart
disease (25 per 100,000), while females were 1.4
times more likely to die from all other illnesses
(table 10) than males. Also, males (44 per 100,000)
were 1.6 times more likely to commit suicide than
females (28 per 100,000), and nearly half as likely as
females to die from intoxication (9 and 17 per
100,000, respectively).

The overall mortality rate increased dramatically
with age, although older inmates accounted for a
small proportion of the total population. Inmates
age 55 and older accounted for 2% of jail inmates,
but 14% of jail deaths. The mortality rate of inmates
age 55 and older (892 per 100,000) was more than
twice the rate for inmates age 45 to 54 (383 per
100,000), and 10 times higher than the rate for
inmates age 25 to 34 (88 per 100,000), which was
the largest age group of inmates. 5 AIDS and
intoxication were the only causes of death for which
inmates age 55 and older did not die at the highest
rate of all age groups.
5
See Profile of Jail Inmates, 2002, BJS Web, 18 July 2004, and Jail
Inmates at Midyear 2007, BJS Web, 6 June 2008.

Table 9.
Percent of the total jail population, percent of jail inmate deaths, and average annual mortality rate per 100,000
jail inmates by selected inmate characteristics, 2000–2007
Characteristic
Total
Sex
Male
Female
Race/Hispanic origin
White, non-Hispanic
Black, non-Hispanic
Hispanic
Other/multiple racea
Age
Under 18
18-24
25-34
35-44
45-54
55 or older
Legal Status
Convicted
Unconvictedb
Offense
Violent
Property
Drugs
Public order

Percent of total population
100 %

Percent of deaths in jails
100 %

Average annual mortality rate
145

88 %
12

88 %
12

146
136

44 %
40
15
2

52 %
34
12
2

172
123
111
184

2%
28
32
26
10
2

1%
10
20
29
27
14

49
52
88
163
383
892

40 %
60

24 %
76

83
176

25 %
24
25
25

35 %
19
18
28

226
106
107
190

Note: Mortality rates are based on the average daily population (ADP). In 2000 and 2001, ADP was estimated by taking the average of January 1 and December 31 one-day inmate population counts. Inmate populations for age and offense
are estimates based on the 2002 Survey of Inmates in Local Jails. Inmate populations for sex, race/Hispanic origin and legal status
are estimates based on the 2000 through 2007 Annual Survey of Jails. Detail may not sum to total due to rounding.
aIncludes American Indians, Alaska Natives, Asians, Native Hawaiians, other Pacific Islanders, and persons of two or more races.
b

8

Includes inmates who were returned to jail on a probation or parole violation.

Mortality in Local Jails, 2000–2007

Inmates age 45 or older died at a rate nearly 5
times higher than younger inmates
The overall mortality rate of inmates age 45 and
older (474 per 100,000) was nearly 5 times that of
younger inmates (98 per 100,000). For all age
groups under 45 years old, suicide was the leading
cause of death. Older inmates were 9 times more
likely to die due to an illness. Specifically, older
inmates were 11 times more likely to die from heart
disease and 19 times more likely to die of cancer
than inmates younger than 45. Among causes
unrelated to illness, older inmates were between 1.5
times (suicide) and 2.8 times (accident) more likely
to die than younger inmates.

Hispanic inmates were less likely than whites
or blacks to die in jail; blacks were less likely
to commit suicide
White inmates, accounting for nearly half of all jail
inmates, died in local jails at a higher rate (172 per
100,000) than black (123 per 100,000) or Hispanic
inmates (111 per 100,000). Whites (68 per 100,000)
committed suicide at 4 times the rate of black
inmates (16 per 100,000) and twice the rate of
Hispanic inmates (33 per 100,000). Whites and
blacks died of heart disease at comparable rates (34
and 35 per 100,000, respectively). Each group was
nearly twice as likely as Hispanics (18 per 100,000)
to die of heart disease.
Heart disease was the leading cause of death for
black inmates (35 per 100,000), and accounted for
more than twice as many deaths as suicide among
blacks (16 per 100,000). Blacks (13 per 100,000)
were 4 times as likely to die from AIDS-related
causes as white inmates (3 per 100,000) and about
twice as likely as Hispanic inmates (6 per 100,000).
Suicide was the single leading cause of death among
Hispanic inmates (33 per 100,000).

Table 10.
Mortality rate per 100,000 jail inmates, by selected inmate characteristics and leading cause of death, 2000–2007
Characteristic
Total
Sex
Male
Female
Race/Hispanic origin
White, non-Hispanic
Black, non-Hispanic
Hispanic
Age
Under 18
18-24
25-34
35-44
45-54
55 or older
Legal Status
Convicted
Unconvictedb

All causes
145

All illnesses Heart disease
77
32

AIDS
7

Drug/alcohol
Cancer All other illnessesa Suicide intoxication
5
32
42
10

Accidental
4

Homicide
3

146
136

76
78

33
25

7
7

5
3

31
44

44
28

9
17

4
3

3
1

172
123
111

73
87
57

34
35
18

3
13
6

5
6
3

32
33
30

68
16
33

14
6
8

6
3
3

3
3
4

49
52
88
163
383
892

6
9
28
85
268
730

2
3
10
33
113
357

1
1
5
12
22
20

0
0
1
3
17
85

3
5
12
36
117
267

37
31
40
49
57
72

2
5
10
12
20
14

1
2
3
5
9
12

1
3
2
3
6
9

83
176

55
101

25
41

5
10

4
6

22
44

18
66

4
16

3
5

2
4

Note: Mortality rates are based on the average daily population (ADP). In 2000 and 2001, ADP was estimated by taking the average of January 1 and December 31
one-day inmate population counts. Inmate populations for age and offense are estimates based on the 2002 Survey of Inmates in Local Jails. Inmate
populations for sex, race/Hispanic origin and legal status are estimates based on the 2000 through 2007 Annual Survey of Jails. Detail may not sum to total due to
rounding. All causes of death are included in the calculations of the total mortality rate.
a
Includes other specified (such as influenza, septicemia, diabetes, and hepatitis) and unspecified or unknown illnesses. See appendix tables 2 and 3 of this report
for a list of the more than 50 illnesses reported to the program. See Methodology for details on illness classifications.
bIncludes inmates who were returned to jail on a probation or parole violation.

July 2010

9

Violent offenders had the highest overall
mortality, suicide and homicide rates
Overall, violent offenders (191 per 100,000) and
public order offenders (185 deaths per 100,000)
were more likely to die in local jails than other
offenders (table 11). Violent offenders (80 per
100,000) and public-order offenders (68 per
100,000) were the most likely to commit suicide.
Specifically, offenders serving time for homicide,
rape, and kidnapping (200, 197, and 195 per
100,000, respectively) had the highest suicide rates.
Violent offenders also had the highest rates of
cancer and homicide mortality. In particular,
offenders serving time for homicide or kidnapping
were the most likely to be killed (13 per 100,000)
while in jail.

Property and drug offenders (106 per 100,000) had
the lowest overall mortality rates. Drug offenders
had the lowest mortality rates from suicide (22 per
100,000) and homicide (1 per 100,000).
Public-order offenders had the second highest
overall mortality rate (185 per 100,000), but the
mortality rate for most categories of public-order
offenders were below the overall average. The
mortality rate for public order offenders varied
from a high of 432 per 100,000 for probation/parole
violators to a low of 61 per 100,000 for offenders
held on weapons charges. The mortality rates for all
other public-order offenders were equal to or less
than 145 per 100,000.

Table 11.
Average annual mortality rate per 100,000 jail inmates, by most serious current offense and cause of death, 2000–2007
Current offensea
All offenses
Violent offenses
Homicideb
Kidnapping
Rape
Other sexual assault
Robbery
Assault
Property offenses
Burglary
Larceny/theft
Auto theft
Arson
Fraud
Stolen property
Drug offenses
Possession
Trafficking
Public order offenses
Weapons
Obstruction of justice
Trafficking
Driving while intoxicatedc
Public intoxication/moralsd
Violation of parole/probatione

All causes
145
191
405
284
394
243
101
158
106
112
138
44
232
66
44
106
162
49
185
61
145
125
100
292
432

Suicide
42
80
200
195
197
90
40
56
30
38
34
14
94
19
19
22
29
9
68
20
39
30
18
61
94

Heart
disease
32
35
65
31
67
57
19
30
21
17
33
7
36
13
8
23
34
12
42
16
41
37
30
83
114

AIDS
7
8
15
0
18
5
9
7
9
13
10
4
18
6
0
7
11
4
5
2
2
3
1
12
22

Liver
Cancer disease
5
4
9
4
24
9
5
0
21
3
25
4
4
1
4
5
3
3
4
2
4
5
1
0
0
7
1
2
3
1
3
4
6
5
2
2
4
5
1
2
3
6
3
2
3
7
3
11
14
10

All other
illnesses
28
31
47
23
47
43
13
29
23
21
31
8
48
14
10
25
40
12
28
6
26
22
19
45
99

aIncludes other offense categories not shown in detail.
b

Includes murder and manslaughter.
Includes driving while intoxicated and driving under the influence of drugs or alcohol.
d
Includes public intoxication, vagrancy, disorderly conduct, unlawful assembly, morals, and commercialized vice.
eIncludes parole or probation violations, escape, AWOL, and flight to avoid prosecution.
c

10

Mortality in Local Jails, 2000–2007

Drug/alcohol
intoxication
10
7
10
0
8
3
2
11
6
5
7
7
0
4
1
12
22
4
13
4
8
16
12
33
23

Accident
4
3
6
3
3
1
3
3
3
2
3
1
12
2
0
3
4
2
7
4
6
2
6
17
16

Homicide
3
5
13
13
3
2
4
4
2
2
3
3
0
1
1
1
2
0
3
2
5
2
0
7
10

Other/
unknown
8
10
17
15
26
12
6
9
6
7
8
0
17
5
1
5
8
2
10
5
10
8
5
19
31

Leading causes of death in the jail population
differed from the U.S. resident population
Mortality in local jails differed from mortality in the
U.S. resident population in both prevalence and
leading causes of death. In the resident population,

heart disease was the leading cause and suicide was
the tenth leading cause of death between 2000 and
2006 (the most recent year finalized mortality data
were available) (table 12). By comparison, suicide
was the leading cause of jail deaths, followed by
heart disease (table 13). Among both jail inmates

Table 12.
Average annual mortality rate, by the 15 leading causes of death in the U.S. general population by age, 2000–2006

Total
Diseases of heart
Malignant neoplasms
Cerebrovascular diseases
Chronic lower respiratory diseases
Accidentsd
Diabetes mellitus
Alzheimer’s disease
Influenza and pneumonia
Nephritis
Suicide
Septicemia
Chronic liver disease, cirrhosis
Essential (primary) hypertension and
hypertensive renal disease
Parkinson’s disease
Homicide

Totalc
835
233
191
53
43
38
25
21
22
14
11
11
9
7
6
6

Average annual mortality rate per 100,000
U.S. residents, age 15-64, 2000–2006a
15–24
25–34
35–44
45–54
81
104
198
429
3
8
30
92
4
9
35
122
0.5
1
5
15
0.5
1
2
9
37
32
37
39
0
2
5
14
*
*
*
0
0
1
2
5
0
1
2
5
10
13
15
16
0
1
2
5
0
1
7
18
0
*
13

0
*
12

1
*
7

3
0
5

55–64
937
232
346
37
43
32
38
2
11
13
13
13
23

Total
145
32
5
3
1
4
1
0
2
1
43
2
4

6
1
3

0
0
3

Average annual mortality rate per 100,000
local jail inmates, 2000–2006b
15–24
25–34
35–44
45–54
53
90
165
379
3
10
33
112
0
1
3
7
0
1
3
10
0
1
2
3
2
3
5
10
0
1
1
4
0
0
0
0
0
1
1
6
0
0
1
1
32
42
50
55
0
0
2
6
0
0
2
11
0
0
3

0
0
2

0
0
3

55–64
731
287
66
21
7
13
3
0
10
7
70
9
14

1
0
6

3
0
9

Note: Age is limited to ages 15 to 64 because this range represents more than 99% of the jail population and 96% of all deaths in jails. The 15 leading causes of death are the
most common causes of death in the U.S. resident population as determined by the Center for Disease Control's National
Vital Statistics System. For more information, see <http://www.cdc.gov/nchs/deaths.htm>.
*Number does not meet standards of reliability or precision according to the Technical Notes of National Vital Statistic Reports Deaths: Final Data for 2006 <http://
www.cdc.gov/nchs/data/nvsr/nvsr57/nvsr57_14.pdf>.
aSource: Vital Statistics Cooperative Program of the Centers for Disease Control and Prevention’s National Center for Health Statistics.
b
The general population and jail mortality rates were based on CDC classification for cause of death. As a result, the mortality rates for jail inmates in this table may differ
from rates in other tables.
cIncludes all causes of death for all age groups.
d

Includes transportation and intoxication deaths.

Table 13.
Average annual mortality rate, by the 10 leading causes of death in jails, by age, 2000–2006
Cause of death
All causes
Illnessb
Heart disease
AIDS
Cancer
Liver diseases
Cerebrovascular diseases
Suicide
Drug/alcohol intoxication
Accidental
Homicide
Other/unknown

Totala
835
...
233
5
191
9
53
11
7
31
6
...

Mortality rate per 100,000 U.S. residents (by age)
15-24
25-34
35-44
45-54
81
104
198
429
...
...
...
...
3
8
30
92
0
4
12
11
4
9
35
122
0
1
7
18
0
1
5
15
10
13
15
16
5
9
14
13
32
24
24
26
13
12
7
5
...
...
...
...

55-64
937
...
232
5
343
23
36
14
5
28
3
...

Totala
145
52
32
8
5
4
3
43
10
4
3
8

Mortality rate per 100,000 local jail inmates
15-24
25-34
35-44
45-54
53
90
165
379
4
17
58
185
3
10
34
115
1
5
13
21
0
1
3
17
0
0
5
22
0
1
4
10
32
42
50
55
5
10
12
21
2
3
5
10
3
2
3
6
3
4
9
20

55-64
731
422
292
19
66
24
21
70
13
13
9
45

Note: Age is limited to ages 15 to 64 because this range represents more than 99% of the jail population and 96% of all deaths in jails.
a

Includes deaths for ages not shown in table. The detailed age categories is limited to ages 15 to 64 because this range represents more than 99% of the jail population
and 96% of all deaths in jails. Source: Vital Statistics Cooperative Program of the Centers for Disease Control and Prevention’s National Center for Health Statistics.
b

Total for the top 5 illness deaths in local jails.
...Not available.

July 2010

11

and the U.S. resident population, the rates of heart
disease deaths increased with age. Similar rates of
death from heart disease were observed for persons
under 45 years old in both groups. Among persons
age 45 and older, the heart disease mortality rate in
jails was higher than in the resident population.
Cancer was the fourth leading cause of death in
jails, but the second leading cause of death in the
resident population. Across all age groups, death
rates from cancer in jails were consistently lower
than in the resident population. The largest
difference was observed among persons age 45 to
54. The U.S. resident population rate of cancer
deaths (122 per 100,000 residents) in this age group
was 7 times that of jail inmates (17 per 100,000
inmates).

Jail suicide rates are consistently higher than
suicide rates in the general U.S. population
Suicide rates for all age groups were at least 3 times
higher among local jail inmates than the general
population. The largest differences were seen
among persons age 55 and older. These jail inmates
had a rate of suicide (70 per 100,000 inmates) that
was 5 times higher than U.S. residents (14 per
100,000 residents).
For violent deaths, such as suicide, specific data
collected by the Centers for Disease Control and
Pre v e nt i on ( C D C ) a l l ow f or s t a n d a rd i z e d
comparisons between jail and U.S. resident
mortality rates (table 14). Standardizing these rates
accounts for variations in the age, race, and sex
composition of the two groups. For example, males
make up 88% of jail inmates, but 49% of the adult
resident population.
The jail population was adjusted through a direct
standardization so that it would ref lect the
composition of the general population. For all
groups, the adjusted jail suicide rates remain
consistently higher than that of U.S. residents. The
standardized jail suicide rate was 3.6 times higher
than the suicide rate in the general population, and
the standardized jail suicide rate was higher for
both males and females. Males were 2.9 times more
likely to commit suicide in jail, and females were 5.4
times more likely. White males (106 per 100,000)
had the highest standardized jail suicide rate, which
was 4.8 times higher than the suicide rate of white
males in the general population (22 per 100,000).
The standardized suicide rate for Hispanic males
was about twice as high as the general population.
Black males in local jails had the lowest
standardized suicide rate, which nearly matched
their suicide rate in the general population (17 and
12 per 100,000 residents).

12

Mortality in Local Jails, 2000–2007

Table 14.
Suicide rates in U.S. population and local jails, by sex,
race, and Hispanic origin, 2000–2006

Allb
Maleb
White
Black
Hispanic
Femaleb
White
Black
Hispanic

Average annual suicide rate per 100,000
Jail inmates
U.S. resident
Unadjusted Age-adjusteda population
42
47
13
45
60
21
83
106
22
18
17
12
30
28
11
28
27
5
55
37
6
9
6
2
26
17
2

aAdjustment based on age distribution in U.S. resident
population by sex, race, and Hispanic origin. See Methodology
for more information on calculation of age-adjusted rates.
b

Includes other racial groups not shown in detail.

The suicide rate of females in jail was five
times that of the suicide rate of females in the
general population
Females account for 51% of the general population
and 12% of the jail population, so adjusting the jail
population to reflect the general population would
deflate the standardized suicide rate for females.
White females had the highest standardized jail
suicide rate at 37 per 100,000 inmates. The
standardized suicide rate for Hispanic females (17
per 100,000) was lower than that of white females
(37 per 100,000), but suicide among Hispanic
females in jail occurred 8.5 times more than in the
g e n e r a l p o p u l at i o n ( 2 p e r 1 0 0 , 0 0 0 ) p o s t standardization. Blacks had the lowest standardized
suicide rate among females (6 per 100,000), but it
was 3 times higher than the suicide rate of black
females (2 per 100,000) in the general population.

The actual suicide rate in jail varies from the
standardized jail suicide rate based on race
and sex
Overall, the actual (observed) suicide rate (42 per
100,000 inmates) in jail is nearly equal to the
standardized jail suicide rate (47 per 100,000
inmates). Female suicide rates in jails are nearly
equal regardless of the standardization, while the
male suicide rate is 1.3 t imes higher p oststandardization. With the exception of whites, the
jail suicide rates both before and after
standardization show little variation. Among
females, the standardized suicide rate was lower for
every race or ethnic group.

Methodology
Deaths in Custody Reporting Program
The local jail portion of the Deaths in Custody
Reporting Program began in 2000 after the passage
of the Deaths in Custody Reporting Act of 2000.
The Governments Division of the U.S. Census
Bureau, as an agent for BJS, collected facility-level
information, death counts, and information
surrounding the death from local jails. Data on
inmate deaths were requested at the end of each
calendar quarter. At yearend, jails submitted a
reconciled annual count that summed to the
quarterly count. Additionally, jail administrators
subm itte d d at a on i n mate p opu l at i on and
admission counts, which were the basis for the
calculation of inmate mortality rates.
Jail respondents were instructed to report the death
of any inmate in their custody, even if the inmate
was held for other jurisdictions. Respondents were
also instructed to include the death of any inmate in
transit or sent outside the jail facility for medical,
mental health, or substance abuse treatment
services. Inmates who died while on or traveling to
or from work-release programs were also included.
Deaths of jail inmates who were released on
temporary furloughs or who had escaped the jail
facility were excluded.
Medical cause of death information was collected
for illness deaths, but not for other manners of
death. The illness category is a heterogeneous
category for natural causes of death associated with
an underlying illness. Due to the variation within
the illness category, each illness death was discussed
in terms of the known medical cause of death as
determined by the autopsy. For each death marked
as illness/natural cause, respondents were directed
to specify a medical cause of death based on an
autopsy review, if available.
These text entries were later coded by clinical data
sp e c i a l i st s a c cord i ng to t h e Worl d He a lt h
Organization's International Statistical Classification
of Diseases and Related Health Problems, Tenth
Revision (ICD-10). BJS analysis of causes of death
used categories of disease published by the National
Center for Health Statistics (NCHS). For this
report, accidents, suicides, and homicides were
discussed in terms of cause of death. While there is
a clear distinction between manner and cause of
death from a medical-legal standpoint, no such
distinction was made in this report.

More information on state prison death data and
the Deaths in Custody Reporting Program is
a v a i l a b l e o n t h e B J S We b s i t e a t < h t t p : / /
b j s . o j p. u s d o j . g o v /
index.cfm?ty=dcdetail&iid=243#Methodology>.
Average daily population used in calculating
mortality rates
Mortality rates were calculated as the number of
deaths per year divided by the annual average daily
population (ADP) of jail inmates and expressed in
terms of deaths per 100,000 jail inmates. The
measure of ADP was for the 12-month period
ending December 31.
The ADP implicitly measures the number of jail
inmate days per year, thereby annualizing the
mortality rates. The ADP reflects the number of
admissions and their length of stay and can be
ex press ed as the pro duc t of the numb er of
admissions times mean length of stay. When mean
length of stay is expressed in years, the ADP is
equivalent to the number of person-years spent by
jail inmates during a given year. This allows for
reporting annualized mortality rates that are
comparable in concept to the annual mortality rates
rep or ted by the National C enter on Health
Statistics. NCHS calculates (crude) mortality rates
as the number of events for a period (e.g., year)
divided by the population estimated at the midpoint
of the period. For general population mortality
statistics the use of the population at the midpoint
of a year is employed as an approximation to the
average population exposed to risk of death during
the year. (See, e.g., Jacob S. Siegal and David
Swanson (2004). The Methods and Materials of
Demography, Second Edition, San Diego, CA:
Elsevier Academic Press, p. 269.)
Because length of stay in jail is comparatively short
(i.e., about 21 days) the ADP is preferred over the
midyear jail population count in the estimation of
the average population exposed to risk of dying in
jail. The average daily population is an appropriate
measure because it is the closest measure of the
accepted epidemiology model of "person years,” or
the number of years the person lives in the
population prior to death (Gaswirth, J.L. (2006)
"Case Comment-Buncher v. Brown County: the
need for an appropriate comparison of suicide
rates.” Law, Probability and Risk (2005) 4, 257-263).
Unless otherwise specified, the jail mortality rate
was expressed in terms of the number of jail inmate
days throughout the report.

July 2010

13

For 2000 and 2001, data on ADP were not collected
by the DCRP. To estimate each jail's ADP for these
two years, an average of the inmate custody
population on January 1st of the reference year and
on December 31st of the year was used. From 2002forward, the ADP was collected by the DCRP and
was as the estimate of the population at risk of dying
in jail. To estimate the ADP of the characteristics of
jail inmates-such as age, race, and genderpopulation proportions from BJS' 2002 Survey of
Inmates in Local Jails were generated and applied to
the average of each year's ADP. These were the most
recently available data for selected jail inmate
population characteristics nationwide. Data from
BJS' Annual Survey of Jails indicate that the
distribution of inmate characteristics such as
gender and race have changed slowly over time. See
Jail Inmates at Midyear 2008 - Statistical Tables, BJS
Web, 31 March 2009 for more information. Using
the 2002 inmate sur vey data to estimate the
distributions of inmate characteristics and applying
these distributions to the average ADP over the
period results in a reasonable estimate of the ADP
of inmate characteristics.
U.S. resident population sources
The NCHS's vital statistics program provided the
U.S. resident population mortality data and rates
presented in this report. See the NCHS website for
mortality data for the U.S. resident population at
<http://www.cdc.gov/nchs/deaths.htm>. The
Center for Disease Control's (CDC) Web-based
Injury Statistics Query and Reporting System was
the source for age-specific suicide data in the U.S.
resident population. See <http://www.cdc.gov/
injury/wisqars/index.html> for more information.
Medical cause of death in state prisons
2004 was the last year finalized clinical ICD data
was available for state prisons. ICD distributions
from 2001-2004 were applied to prison data
reported to the D CRP for 2005-2007. More
information on state prison death data and the
Deaths in Custody Reporting Program is available
on the BJS Website at <http://bjs.ojp.usdoj.gov/
index.cfm?ty=dcdetail&iid=243#Methodology>.

14

Mortality in Local Jails, 2000–2007

Discharge data
Inmates are typically discharged from jail through
b ai l, re l e a s e by a c ou r t ord e r, c om mu n it y
supervision, time served or death. Estimates of time
served by inmates discharged from jail are based on
unpublished BJS data.
Direct standardization of suicide rates in jail and U.S.
resident populations
The method of direct standardization was used to
compare suicide rates in the jail inmate population
with suicide rates in the general population.
Because the characteristics of the jail inmate
population differ from the characteristics of the
general population, and as some characteristics are
associated with suicide rates, a direct comparison of
the crude suicide mortality rates between jail
inmates and the general p opu lation can b e
misleading. For example, in jails, older white males
are more likely to commit suicide than other
groups, but older white males comprise a smaller
fraction of the jail population than they comprise of
the general population.
In order to compare the jail and U.S. resident
population suicide rates, the differences in these
two populations' gender, race, and age distributions
were taken into account by method of direct
standardization. The jail population was adjusted to
the age distribution of the general population,
creating the standardized population; this was done
within race and gender groups. The age-specific jail
suicide rates were applied to the standardized
population to produce an estimate of the expected
number of suicides that would occur in jail if the
age distribution of the jail population were the same
as that of the general population. Again, this was
done within race and gender groups. The expected
numbers of suicides across age groups were
summed and the total divided by the ADP of jail
population to produce the standardized suicide
rates that were compared to the general population
rates.

Appendix Table 1.
Number of reported deaths by size of jail jurisdiction, 2000–2007
Number of deaths
0
1
2
3
4 or more
Total

Percent of unique
facilities in all 8 years
42 %
48
6
2
2
100 %

Number of deaths reported by facilities reporting in all 8 years, by size of jail jurisdiction
Total
Fewer than 50
50 to 99
250 to 499 250 to 499 500 to 999 1,000 or more
1,219
780
253
160
22
2
1
1,371
362
303
376
192
93
32
181
8
12
43
43
48
26
47
0
0
0
11
12
24
58
0
0
0
1
3
54
2,876
1,150
568
579
269
158
137

Note: Unique facilities are jail facilities or jurisdictions that reported in all 8 years of the reporting period. Detail may not sum to total due to
missing cases.

Appendix Table 2.
Number of jail inmate deaths, by cause of death, 2000–2007
Cause of death
All causes
Suicide
Heart disease
Drug/alcohol intoxication
Illness, specific cause missinga
AIDS
Unknown/other cause
Accidental
Cancer
Liver disease
Homicide
Cebrovascular diseases
Respiratory diseasesb
Digestive diseasesc
Influenza/pneumonia
Chronic substance abused
Septicemia
Aortic aneurysm
Diabetes
Kidney disorders
Other central nervous system diseases
Inflammation of the central nervous system
Viral hepatitis
Atherosclerosis
Episodic paroxysm
Surgical complications
Essential hypertension and hypertensive renal disease
Benign neoplasm
Other bacterial
Congrenital malformation
Tuberculosis
Anemia
Mycoses
Pregnancy/birth
Soft tissue disorders
Disorders of veins/lymph nodes
Blood disorders
Mental disorder
Metabolic disorders
Thyroid disorders
Unspecified circulatory disorders
Appendicitis

2000–2007
8,110
2,363
1,789
567
483
410
491
229
273
234
172
168
130
125
103
86
84
52
48
38
23
22
17
17
13
13
11
10
9
8
7
6
6
6
6
5
4
4
4
4
4
3

2000
905
289
197
37
79
58
20
25
31
24
17
16
19
15
13
3
14
4
4
3
1
2
1
2
1
4
1
1
2
2
1
0
0
1
2
0
0
1
2
1
2
1

2001
946
314
216
59
48
59
30
35
24
27
20
18
10
16
9
10
9
5
3
1
6
2
3
1
4
1
3
1
1
1
1
1
0
0
1
0
0
0
0
0
0
2

2002
973
314
221
55
54
50
42
35
39
25
18
22
12
8
11
15
11
7
5
7
3
1
0
3
0
1
0
0
0
2
0
0
2
1
1
1
1
1
0
0
0
0

2003
1,004
296
241
89
35
54
63
28
34
30
15
18
12
12
11
7
12
6
6
6
4
3
1
2
1
1
1
2
1
1
1
0
0
1
0
0
1
0
1
1
0
0

2004
1,029
300
229
77
59
52
60
32
28
32
24
19
20
16
16
12
5
6
6
4
1
5
1
1
1
2
0
1
0
1
1
1
1
2
1
1
0
0
0
0
0
0

2005
2006
2007
1,051
1,099
1,103
286
279
285
203
250
232
84
87
79
70
59
79
40
54
43
129
56
91
24
32
18
37
38
42
32
25
39
22
36
20
17
30
28
15
16
26
14
22
22
8
12
23
9
17
13
6
16
11
7
8
9
10
7
7
7
8
2
1
6
1
0
5
4
6
2
3
2
3
3
0
3
3
1
3
0
2
3
1
2
1
2
3
0
2
1
0
0
2
1
0
1
1
2
1
2
0
0
1
0
0
1
0
0
2
1
0
0
2
1
1
0
0
1
0
0
0
2
1
1
0
0
0
0
Continued on the next page

July 2010

15

Appendix table 2 (cont.)
Number of jail inmate deaths, by cause of death, 2000–2007
Cause of death
2000–2007
2000
Hernia
Other viral disorders
Arthritis
Endocrine disorders
Immune system disorders
Multiple sclerosis
Connective tissue disorder
Protozoal disorders
Other urinary tract disorders
Glucose disorders
Atrophy of the central nervous system
Infectious diseases, other
Nerve or nerve root disorders
Nutrition deficiencies
Obesity
Salmonella poisoning
Skin disorders
Spirochetal other
Viral infections of the central nervous system
Multiple illnessese

3
3
2
2
2
2
2
2
2
2
2
1
1
1
1
1
1
1
1
31

0
0
1
0
0
0
0
1
0
0
0
0
0
0
0
0
0
0
0
7

2001
0
0
0
0
0
1
0
0
1
0
0
0
0
0
0
0
0
1
0
2

2002
0
0
1
1
1
0
0
0
0
0
1
0
0
0
0
0
0
0
0
1

2003
1
1
0
1
0
0
1
1
1
0
0
0
0
0
0
0
0
0
0
1

2004
0
0
0
0
1
1
0
0
0
0
0
0
0
0
0
0
0
0
0
10

2005
0
1
0
0
0
0
1
0
0
0
0
0
0
1
0
0
0
0
0
4

2006
0
0
0
0
0
0
0
0
0
1
0
0
0
0
1
1
1
0
0
6

2007
2
1
0
0
0
0
0
0
0
1
1
1
1
0
0
0
0
0
1
0

aThe manner of death was marked as “illness,” but a medical cause of death was not given.
b
c

Excludes influenza and pneumonia.

Excludes diseases of the liver.

dExcludes acute intoxication deaths.
eSuch cases included a text description of the illness, but the information was insufficient to classify the death to a single cause.

Appendix Table 3.
Mortality rate of jail inmates, by cause of death, per 100,000 jail inmates 2000-2007
Cause of death
All causes
Illness
Heart disease
AIDS
Cancer
Liver disease
Cebrovascular diseases
Respiratory diseasesa
Digestive diseasesb
Septicemia
Chronic substance abusec
Influenza/pneumonia
Aortic aneurysm
Diabetes mellitus
Kidney disease
All other illnessd
Suicide
Drug/alcohol intoxication
Accidental
Homicide
Unknown/other cause

Average annual mortality
rate per 100,000 jail
inmates, 2000-2007
145
77
32
7
5
4
3
2
2
2
2
2
1
1
1
13
42
10
4
3
8

Mortality rate per 100,000 jail inmates
2000
152
87
33
10
5
4
3
3
3
2
1
2
1
1
1
19
48
6
4
3
3

2001
149
77
34
9
4
4
3
2
3
1
2
1
1
0
0
13
49
9
5
3
5

2002
146
76
33
7
6
4
3
2
1
2
2
2
1
1
1
11
47
8
5
3
6

2003
145
74
35
8
5
4
3
2
2
2
1
2
1
1
1
9
43
13
4
2
9

2004
144
75
32
7
4
4
3
3
2
1
2
2
1
1
1
13
42
11
4
3
8

2005
138
67
27
5
5
4
2
2
2
1
1
1
1
1
1
13
38
11
3
3
17

2006
143
79
32
7
5
3
4
2
3
2
2
2
1
1
1
14
36
11
4
5
7

2007
141
78
30
5
5
5
4
3
3
1
2
3
1
1
0
14
36
10
2
3
12

Note: Mortality rates are based on the average daily population (ADP). In 2000 and 2001, ADP was estimated by taking the average of the
January 1 and December 31 one-day inmate population counts. See appendix table 1 for the number of deaths by cause.
aExcludes influenza and pneumonia.
bExcludes diseases of the liver.
c

Excludes acute intoxication deaths.

d

Includes other specified and unspecified or unknown illnesses such as influenza, septicemia, diabetes, and hepatitis. See appendix tables 2 for a full display
of the more than 50 illnesses reported to the program. Mortality rates for illnesses not shown were less than 1 per 100,000 jail inmates.
See Methodology for details on illness classifications.

16

Mortality in Local Jails, 2000–2007

Appendix Table 4.
Percent of local jail inmate deaths, by cause and year, 2000–2007
Cause of death
All causes

Number of deaths
2000-2007
8,110

Suicide
Illness
Heart disease
AIDS
Cancer
Liver disease
Cebrovascular diseases
Respiratory diseasesa
Digestive diseasesb
Septicemia
Chronic substance abusec
Influenza/pneumonia
All other illnessesd
Drug/alcohol intoxication
Accidental
Homicide
Other/unknown

2,363
4,288
1,789
410
273
234
168
130
125
84
86
103
886
567
229
172
491

2000
905
31.9 %
57.0 %
21.8
6.4
3.4
2.7
1.8
2.1
1.7
1.5
0.3
1.4
14.0
4.1
2.8
1.9
2.2

2001
946
33.2 %
51.6 %
22.8
6.2
2.5
2.9
1.9
1.1
1.7
1.0
1.1
1.0
9.5
6.2
3.7
2.1
3.2

2002
973
32.3 %
52.3 %
22.7
5.1
4.0
2.6
2.3
1.2
0.8
1.1
1.5
1.1
9.8
5.7
3.6
1.8
4.3

2003
1,004
29.5 %
51.1 %
24.0
5.4
3.4
3.0
1.8
1.2
1.2
1.2
0.7
1.1
8.2
8.9
2.8
1.5
6.3

2004
1,029
29.2 %
52.1 %
22.3
5.1
2.7
3.1
1.8
1.9
1.6
0.5
1.2
1.6
10.4
7.5
3.1
2.3
5.8

2005
1,051
27.2 %
48.1 %
19.3
3.8
3.5
3.0
1.6
1.4
1.3
0.6
0.9
0.8
11.9
8.0
2.3
2.1
12.3

2006
1,099

2007
1,103

25.4 %
55.4 %
22.7
4.9
3.5
2.3
2.7
1.5
2.0
1.5
1.5
1.1
11.7
7.9
2.9
3.3
5.1

25.8 %
55.3 %
21.0
3.9
3.8
3.5
2.5
2.4
2.0
1.0
1.2
2.1
11.9
7.2
1.6
1.8
8.3

Note: Mortality rates are based on the average daily population (ADP). In 2000 and 2001, ADP was estimated by taking the average of January 1 and
December 31 one-day inmate population counts. See appendix table 2 for the number of deaths by cause.
a

Excludes influenza and pneumonia.

bExcludes diseases of the liver.
c

Excludes acute intoxication deaths.

dIncludes other specified (such as diabetes and hepatitis) and unspecified or unknown illnesses. See appendix tables 2 and 3 of this report for a list of the more than 50

illnesses reported to the program. See Methodology for details on illness classifications.

July 2010

17

Appendix Table 5.
Jail inmate mortality rate per 100,000 inmates, by the 50 largest jail jurisdictions and selected cause of death, 2000–2007

Jurisdiction
Total
Los Angeles County, CA
New York City, NY
Maricopa County, AZ
Cook County, IL
Harris County, TX
Philadelphia City, PA
Dallas County, TX
Dade County, FL
Orange County, CA
Broward County, FL
San Bernardino County, CA
San Diego County, CA
Shelby County, TN
Santa Clara County, CA
Hillsborough County, FLb
Baltimore City, MD
Sacramento County, CA
Bexar County, TX
Alameda County, CA
Orange County, FL
District of Columbia
Fresno County, CA
Pinellas County, FL
Tarrant County, TX
Jacksonville City, FL
Clark County, NV
Allegheny County, PA
Riverside County, CA
Davidson County, TN
De Kalb County, GA
Marion County, IN
Fulton County, GA
Milwaukee County, WI
Wayne County, MI
Oklahoma County, OK
Gwinnett County, GA
Palm Beach County, FL
Polk County, FL
Travis County, TX
Franklin County, OH
King County, WA
Cobb County, GA
Denver County, CO
Suffolk County, MAc
Hamilton County, OH
Mecklenburg County, NC
Bernalillo County, NM
Kern County, CA
El Paso County, TX
Hampden County, MA

Average annual mortality
rate, per 100,000 jail
inmates, 2000–2007
168
178
218
136
160
201
230
152
231
80
158
129
195
153
122
115
326
170
246
215
107
315
152
167
118
226
187
207
145
266
126
176
68
96
152
184
124
168
80
139
110
88
116
140
62
183
81
211
128
172
128

Average annual mortality rate, per 100,000 jail inmates by cause of death, 2000–2007
Drug/alcohol
Other/
Heart
Liver
All other
Suicide disease
AIDS Cancer disease illnessesa intoxication Accident Homicide unknown
27
40
15
9
6
43
8
5
6
10
22
45
9
9
10
57
6
6
11
3
22
63
29
9
11
49
9
4
7
14
34
20
3
14
1
44
7
6
0
6
12
44
11
16
7
56
2
1
9
1
16
47
14
23
16
58
6
5
0
17
31
56
34
20
5
55
11
1
16
2
24
43
11
11
7
38
7
4
2
5
15
52
58
17
2
48
13
4
6
17
13
16
2
11
0
25
2
6
2
4
17
19
35
2
15
50
2
5
0
7
28
18
0
10
0
33
11
0
5
24
46
49
2
12
5
32
22
17
5
5
17
39
22
14
0
43
2
5
3
7
44
29
6
6
6
9
9
0
8
5
15
41
11
3
10
21
0
0
7
7
89
63
58
0
6
76
3
0
22
9
65
32
7
9
7
39
6
6
0
0
27
65
10
14
3
71
13
3
11
30
41
65
3
6
10
74
6
0
3
6
9
28
25
6
0
32
3
3
0
0
19
72
37
36
4
36
11
7
18
75
34
29
0
16
5
39
5
5
11
7
24
49
11
5
9
40
12
8
8
0
7
51
7
4
7
28
0
0
0
14
20
44
13
7
22
52
9
4
9
47
53
45
14
8
0
52
0
10
0
5
66
40
0
15
0
59
8
8
0
9
44
24
7
0
11
27
28
0
4
0
32
62
25
8
13
74
22
8
9
12
23
27
21
0
0
40
0
5
5
4
39
29
21
10
10
38
10
5
5
10
18
28
9
0
0
9
4
0
0
0
4
31
0
0
0
25
17
15
4
0
45
47
0
13
14
14
0
9
4
5
38
40
6
5
0
42
23
0
30
0
39
33
20
9
0
14
30
0
0
9
0
49
43
5
19
43
4
5
0
0
11
21
0
0
0
27
0
10
0
12
24
28
10
10
14
33
9
0
0
10
40
25
5
6
0
16
5
5
0
10
10
15
0
5
10
34
14
0
0
0
38
26
0
6
5
16
15
5
5
0
46
26
20
0
0
12
5
5
11
16
10
5
5
0
5
10
0
0
0
26
36
73
0
0
0
45
0
6
6
17
6
26
5
0
0
37
0
6
0
0
29
11
0
0
18
52
38
0
9
54
30
37
6
0
0
38
5
0
11
0
40
33
0
0
0
65
6
18
5
6
22
8
15
27
6
44
0
0
0
6

Note: The 50 largest jurisdictions as of June 30, 2006; displayed from largest to smallest.
a
Includes other specified and unspecified or unknown illnesses such as influenza, septicemia, diabetes, and hepatitis. See appendix tables 2 and 3 to see a full display of
the more than 50 illnesses reported to the program. See Methodology for details on illness classifications.
b
Hillsborough County data for 2003 cover the first calendar quarter; quarters 2 through 4 were not reported.
c
Suffolk County data for 2000 excludes the Suffolk County House of Corrections.

18

Mortality in Local Jails, 2000–2007

U.S. Department of Justice
Office of Justice Programs
Bureau of Justice Statistics

*NCJ~222988*

PRESORTED STANDARD
POSTAGE & FEES PAID
DOJ/BJS
Permit No. G-91

Washington, DC 20531

Official Business
Penalty for Private Use $300

The Bureau of Justice Statistics is the statistical agency of
the U.S. Department of Justice. James P. Lynch is director.
This Special Report was written by Margaret Noonan.
William Sabol and Spencer Li verified the report.
Doris J. James, Catherine Bird, and Jill Duncan edited the
report, Barbara Quinn and Tina Dorsey produced the
report, and Jayne Robinson prepared the report for final
printing under the supervision of Doris J. James.
July 2010, NCJ 222988

19

Mortality in Local Jails, 2000–2007

This report in portable document format and in ASCII and its
related statistical data and tables are available at the BJS World
Wi d e We b I n t e r n e t s i t e : h t t p : / / b j s . o j p. u s d o j . g o v /
index.cfm?ty=pbdetail&iid=2197.

Office of Justice Programs
Innovation • Partnerships • Safer Neighborhoods
http://www.ojp.usdoj.gov