
Bureau of Justice Statistics Prisoners at Yearend 2009 Advance Counts 2010
Download original document:
Document text
Document text
This text is machine-read, and may contain errors. Check the original document to verify accuracy.
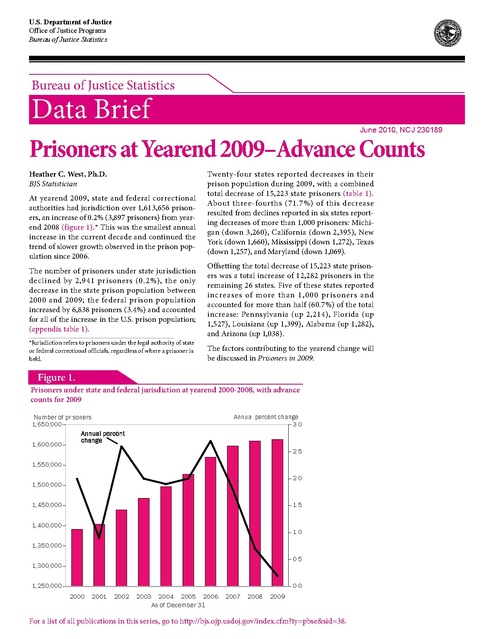
U.S. Department of Justice
Office of Justice Programs
Bureau of Justice Statistics

Bureau of Justice Statistics

Data Brief
June 2010, NCJ 230189

Prisoners at Yearend 2009–Advance Counts
Heather C. West, Ph.D.
BJS Statistician
At yearend 2009, state and federal correctional
authorities had jurisdiction over 1,613,656 prisoners, an increase of 0.2% (3,897 prisoners) from yearend 2008 (figure 1).* This was the smallest annual
increase in the current decade and continued the
trend of slower growth observed in the prison population since 2006.

Twenty-four states reported decreases in their
prison population during 2009, with a combined
total decrease of 15,223 state prisoners (table 1).
About three-fourths (71.7%) of this decrease
resulted from declines reported in six states reporting decreases of more than 1,000 prisoners: Michigan (down 3,260), California (down 2,395), New
York (down 1,660), Mississippi (down 1,272), Texas
(down 1,257), and Maryland (down 1,069).

The number of prisoners under state jurisdiction
declined by 2,941 prisoners (0.2%), the only
decrease in the state prison population between
2000 and 2009; the federal prison population
increased by 6,838 prisoners (3.4%) and accounted
for all of the increase in the U.S. prison population;
(appendix table 1).

Offsetting the total decrease of 15,223 state prisoners was a total increase of 12,282 prisoners in the
remaining 26 states. Five of these states reported
increases of more than 1,000 prisoners and
accounted for more than half (60.7%) of the total
increase: Pennsylvania (up 2,214), Florida (up
1,527), Louisiana (up 1,399), Alabama (up 1,282),
and Arizona (up 1,038).

*Jurisdiction refers to prisoners under the legal authority of state
or federal correctional officials, regardless of where a prisoner is
held.

The factors contributing to the yearend change will
be discussed in Prisoners in 2009.

Figure 1.
Prisoners under state and federal jurisdiction at yearend 2000-2008, with advance
counts for 2009
Annual percent change
3.0

Number of prisoners
1,650,000
Annual percent
change
1,600,000
J

J

2.5

1,550,000
J

J

1,500,000

2.0

J
J
J

1,450,000

1.5

1,400,000

1.0
J

1,350,000

J

0.5

1,300,000
J

0.0

1,250,000
2000

2001

2002

2003 2004 2005 2006
As of December 31

2007

2008

2009

For a list of all publications in this series, go to http://bjs.ojp.usdoj.gov/index.cfm?ty=pbse&sid=38.

The drop in semi-annual change continued
during 2009
During recent years, most of the annual change in
the U.S. prison population has occurred over the
period from December to June, with a relatively
small amount of change occurring from June to
December. The seasonality has been particularly
marked since 2006, as the pattern of larger changes
from December to June followed by smaller changes
from June to December has been extremely consistent (figure 2). From 2006 to 2009, the population
change from December to June accounted for over
75%, on average, of the annual change. For example,
growth in the first half of 2006 accounted for 72.1%
of the total year’s growth (table 2). Growth in the
first half of 2007 accounted for 87.2% of the overall
growth. During 2008 and 2009, all of the population
growth occurred in the first half of the year.

Since 2006, the level of change during each semiannual period (December 31 through June 30 and
June 30 through December 31) has dropped. During the first half of 2006, the prison population
increased by 30,306 prisoners. The prison population continued to increase during the same time
period in 2007, with a smaller increase of 24,666
prisoners. This trend continued during the first half
of 2008 and 2009, when the prison population
increased by 12,297 prisoners and 7,719 prisoners,
respectively.
Similarly, the level of semi-annual change for the
second half of the year also dropped. From June 30,
2006 to December 31, 2006, the prison population
increased by 11,710. During the same period in
2007, there was an increase of 3,634 prisoners. In
2008, the direction of growth in the prison population reversed, decreasing by 783 prisoners. The

Table 1.
Changes in the number of prisoners in selected jurisdictions, December 31, 2008
to December 31, 2009
Total change
Federal
State
Total change in states with increasing prison populations
States with increases of more than 1,000 prisoners
Pennsylvania
Florida
Louisiana
Alabama
Arizona
Other states with increases
Total change in states with decreasing prison populations
States with decreases of more than 1,000 prisoners
Michigan
California
New York
Mississippi
Texas
Maryland
Other states with decreases

2

Prisoners at Yearend 2009–Advance Counts

Change in number
3,897
6,838
-2,941
12,282
7,460
2,214
1,527
1,399
1,282
1,038
4,822
-15,223
-10,913
-3,260
-2,395
-1,660
-1,272
-1,257
-1,069
-4,310

Percent of total change
100.0%
175.5
-75.5
100.0%
60.7
18.0
12.4
11.4
10.4
8.5
39.3
100.0%
71.7
21.4
15.7
10.9
8.4
8.2
7.0
28.3

decrease of 3,822 prisoners from June 30, 2009 to
December 31, 2009 was the largest drop in the last 6
months of any year from 2000 through 2009.
Smaller increases have led to slower rates of growth
in the number of prisoners during these semiannual periods. In the first half of 2006, the prison
population grew at a rate of 2.0%. Over the next 3
years, growth in the prison population during the
first half of the year slowed from 1.6% in 2007 to
0.8% in 2008, and 0.5% at midyear 2009. From June
30, 2005 to December 31, 2005, the prison population increased by 0.9%. During the same period in
2006 and 2007, the growth slowed to 0.8% and
0.2%, respectively. A negligible decrease in growth
(783 prisoners) was observed during the last half of
2008. The growth rate continued to decrease by
0.2% during the last half of 2009, the largest
decrease observed in the last 10 years.

Figure 2.
Six-month change in the number of prisoners under state and federal
jurisdiction, December 1999-2009
Number of prisoners
35,000
30,000

6-month change

25,000
20,000
15,000
10,000
5,000
0
-5,000

Dec. Jun. Dec. Jun. Dec. Jun. Dec. Jun. Dec. Jun. Dec. Jun. Dec. Jun. Dec. Jun. Dec. Jun. Dec.

1999 2000 2001 2002

2003 2004 2005 2006 2007 2008

2009

Table 2.
Change in the U.S. prison population, 2000-2009
Six-month change

Year
2000
2001
2002
2003
2004
2005
2006
2007
2008
2009

First 6 months of
Second 6 months of
the year (December Percent of annual the year (June
Percent of
through June)
change
through December) annual change
27,243
98.8%
317
1.2%
14,270
111.7
-1,499
-11.7
15,905
44.0
20,207
56.0
24,053
84.5
4,404
15.5
23,233
81.5
5,266
18.5
16,866
54.7
13,963
45.3
30,306
72.1
11,710
27.9
24,666
87.2
3,634
12.8
12,297
105.0
-783
-6.8
7,719
198.1
-3,822
-98.1

Annual change
December through
December
27,560
12,771
36,112
28,457
28,499
30,829
42,016
28,300
11,514
3,897

June 2010

3

Methodology
National Prisoner Statistics
Begun in 1926 under a mandate from Congress, the
National Prisoner Statistics (NPS) program collects
statistics on prisoners at midyear and yearend. The
Census Bureau serves as the data collection agent
for the Bureau of Justice Statistics (BJS). BJS
depends entirely on voluntary participation by state
departments of corrections and the Federal Bureau
of Prisons for NPS data.
The NPS distinguishes between inmates in custody
and prisoners under jurisdiction. To have custody
of an inmate, a state or the Federal Bureau of Prisons must hold that inmate in one of its facilities. To
have jurisdiction over a prisoner, a state or the Federal Bureau of Prisons must have legal authority
over the prisoner. Some states are unable to provide
counts that distinguish between custody and jurisdiction.
The NPS jurisdiction counts include prisoners serving a sentence within a jurisdiction's facilities
including prisons, penitentiaries, correctional facilities, halfway houses, boot camps, farms, training or
treatment centers, and hospitals. They include prisoners who are—
• temporarily absent (less than 30 days), out to
court, or on work release
• housed in privately operated facilities, local jails,
other state or federal facilities
• serving concurrent sentences for more than one
correctional authority.
The NPS custody counts include all inmates held
within a respondent's facilities including inmates
housed for other correctional facilities. The custody
counts exclude inmates held in local jails and in
other jurisdictions. With a few exceptions, the NPS
custody counts exclude inmates held in private
facilities.
Additionally, NPS data include counts of inmates in
combined jail-prison systems in Alaska, Connecticut, Delaware, Hawaii, Rhode Island, and Vermont.

4

Prisoners at Yearend 2009–Advance Counts

States and the Federal Bureau of Prisons have the
ability to update data submitted the previous year.
This report provides updates for midyear and yearend 2008 counts.
The District of Columbia (D.C.) became a jail-only
jurisdiction by yearend 2001, when the Federal
Bureau of Prisons assumed responsibility for housing all sentenced felons from D.C. Selected previously published prisoner counts and percent population change statistics include D.C. jail inmates for
2001, the last year of collection. See notes in tables
for additional information.
Additional information about the NPS data collection instrument is available on the BJS Website at
<http://bjs.ojp.usdoj.gov>.

Definitions
Average annual change—the arithmetic average
(mean) annual change across a specific time period.
Jurisdiction—the number of prisoners under the
legal authority of state or federal correctional officials, regardless of where the prisoners are held. For
example, state-sentenced prisoners held in local
jails are under the jurisdiction of state correctional
authorities.
Prisons—compared to jail facilities, prisons are
longer-term facilities run by a state or the federal
government and typically hold prisoners with sentences of more than 1 year. However, sentence
length may vary by state. Connecticut, Rhode
Island, Vermont, Delaware, Alaska, and Hawaii
operate integrated systems which combine prisons
and jails.
Prisoners—individuals under the legal authority
(jurisdiction) of state and federal correctional officials.

NPS jurisdiction notes
Alaska—Prisons and jails form one integrated system. All NPS data include jail and prison popula-

NPS jurisdiction notes
Alaska—Prisons and jails form one integrated system. All NPS data include jail and prison populations housed in-state and out-of-state. Jurisdictional
counts exclude inmates held in local jails that are
operated by communities.
Arizona—Population counts are based on custody
data and inmates in contracted beds.
California—Jurisdiction counts include felons and
unsentenced inmates who are temporarily absent,
e.g., housed in local jails, hospitals, etc. This definition is comparable to the 1998 NPS 1b definition.
Colorado—Counts include 222 male and 10 female
inmates in the Youthful Offender System, which
was established primarily for violent juvenile
offenders.
Connecticut—Prisons and jails form one integrated system. All NPS data include jail and prison
populations.
Delaware—Prisons and jails form one integrated
system. All NPS data include jail and prison populations.
Georgia—Counts are based on custody data.

Hawaii—Prisons and jails form one integrated system. All NPS data include jail and prison populations.
Iowa—Population counts are based on custody
data. The jurisdiction count for December 31, 2009
is not comparable to previous years due to a change
in measurement. As of 2009, the Iowa Department
of Corrections began including the Operating
While Intoxicated population, prisoners on work
release, and prisoners in violation of their sentence.
Oklahoma—Population counts for inmates with
sentences of less than 1 year consist mainly of
offenders ordered by the court to the Delayed Sentencing Program for Young Adults pursuant to 22
O.S. 996 through 996.3.
Oregon—Counts include an undetermined number
of inmates with sentences of 1 year or less. County
authorities retain jurisdiction over the majority of
these types of inmates.
Rhode Island—Prisons and jails form one integrated system. All NPS data include jail and prison
populations.
Vermont—Prisons and jails form one integrated
system. All NPS data include jail and prison populations.

June 2010

5

Appendix Table 1.
Prisoners under the jurisdiction of state or federal correctional authorities, by jurisdiction,
December 31, 2000 and 2008, with advanced counts for 2009
Region and jurisdiction
U.S. totala
Federal
State
Northeast
Connecticuta
Maine
Massachusetts
New Hampshire
New Jersey
New York
Pennsylvania
Rhode Islanda
Vermonta
Midwest
Illinois
Indiana
Iowab
Kansas
Michigan
Minnesota
Missouri
Nebraska
North Dakota
Ohio
South Dakota
Wisconsin
South
Alabama
Arkansas
Delawarea
District of Columbia
Florida
Georgiab
Kentucky
Louisiana
Maryland
Mississippi
North Carolina
Oklahoma
South Carolina
Tennessee
Texas
Virginia
West Virginia
West
Alaskaa
Arizonab
California
Colorado
Hawaiia
Idaho
Montana
Nevada
New Mexico
Oregon
Utah
Washington
Wyoming

12/31/2000
1,391,261
145,416
1,245,845
174,826
18,355
1,679
10,722
2,257
29,784
70,199
36,847
3,286
1,697
237,378
45,281
20,125
7,955
8,344
47,718
6,238
27,543
3,895
1,076
45,833
2,616
20,754
561,214
26,332
11,915
6,921
7,456
71,319
44,232
14,919
35,207
23,538
20,241
31,266
23,181
21,778
22,166
166,719
30,168
3,856
272,427
4,173
26,510
163,001
16,833
5,053
5,535
3,105
10,063
5,342
10,580
5,637
14,915
1,680

Number of prisoners
12/31/2008
12/31/2009
1,609,759
1,613,656
201,280
208,118
1,408,479
1,405,538
178,642
177,361
20,661
19,716
2,195
2,206
11,408
11,316
2,702
2,731
25,953
25,382
60,347
58,687
49,215
51,429
4,045
3,674
2,116
2,220
264,314
261,603
45,474
45,161
28,322
28,808
8,766
8,813
8,539
8,641
48,738
45,478
9,910
9,986
30,186
30,563
4,520
4,474
1,452
1,486
51,686
51,606
3,342
3,434
23,379
23,153
647,312
649,451
30,508
31,790
14,716
15,208
7,075
6,794
~
~
102,388
103,915
52,719
53,371
21,706
21,638
38,381
39,780
23,324
22,255
22,754
21,482
39,482
39,860
25,864
26,397
24,326
24,288
27,228
26,965
172,506
171,249
38,276
38,092
6,059
6,367
318,211
317,123
5,014
5,285
39,589
40,627
173,670
171,275
23,274
22,795
5,955
5,891
7,290
7,400
3,545
3,605
12,743
12,482
6,402
6,519
14,167
14,403
6,552
6,533
17,926
18,233
2,084
2,075

Average annual
change, 2000-2008
1.8%
4.1
1.5
0.3%
1.5
3.4
0.8
2.3
-1.7
-1.9
3.7
2.6
2.8
1.4%
0.1
4.4
1.2
0.3
0.3
6.0
1.2
1.9
3.8
1.5
3.1
1.5
1.8%
1.9
2.7
0.3
:
4.6
2.2
4.8
1.1
-0.1
1.5
3.0
1.4
1.4
2.6
0.4
3.0
5.8
2.0%
2.3
5.1
0.8
4.1
2.1
3.5
1.7
3.0
2.3
3.7
1.9
2.3
2.7

Percent change,
2008-2009
0.2%
3.4
-0.2
-0.7%
-4.6
0.5
-0.8
1.1
-2.2
-2.8
4.5
-9.2
4.9
-1.0%
-0.7
1.7
:
1.2
-6.7
0.8
1.2
-1.0
2.3
-0.2
2.8
-1.0
0.3%
4.2
3.3
-4.0
:
1.5
1.2
-0.3
3.6
-4.6
-5.6
1.0
2.1
-0.2
-1.0
-0.7
-0.5
5.1
-0.3%
5.4
2.6
-1.4
-2.1
-1.1
1.5
1.7
-2.0
1.8
1.7
-0.3
1.7
-0.4

~Not applicable. As of December 31, 2001, sentenced felons from the District of Columbia were the responsibility of the Federal Bureau of Prisons.
: Not calculated.
aPrisons and jails form one integrated system. Data include total jail and prison populations.
b
Prison population based on custody counts.
c
Data for 2008 and 2009 are not comparable. See Jurisdiction notes.

6

Prisoners at Yearend 2009–Advance Counts

U.S. Department of Justice
Office of Justice Programs
Bureau of Justice Statistics

*NCJ~230189*

PRESORTED STANDARD
POSTAGE & FEES PAID
DOJ/BJS
Permit No. G-91

Washington, DC 20531

Official Business
Penalty for Private Use $300

The Bureau of Justice Statistics is the statistical agency of
the U.S. Department of Justice. Michael D. Sinclair is
acting director.
This Crime Data Brief was written by Heather C. West,
Ph.D. Todd Minton, Sheri Simmons, and Tracy Snell
verified the report.
Joshua Giunta carried out the data collection and
processing under the supervision of Steve Simoncini,
G o v e r n m e nt s D i v i s i o n , C e n s u s B u r e au , U. S .
Department of Commerce.

This report in portable document format and in ASCII and
its related statistical data and tables are available at the BJS
World Wide Web Internet site: <http://bjs.ojp.usdoj.gov/
index.cfm?ty=pbdetail&iid=2272>.

Office of Justice Programs
Innovation • Partnerships • Safer Neighborhoods
http://www.ojp.usdoj.gov

Catherine Bird and Jill Duncan edited the report, Tina
Dorsey produced the report, and Jayne Robinson
prepared the report for final printing under the
supervision of Doris J. James.
June 2010, NCJ 230189

June 2010

7