
Census of State and Local Law Enforcement Agencies, 2008, BJS, 2011
Download original document:
Document text
Document text
This text is machine-read, and may contain errors. Check the original document to verify accuracy.
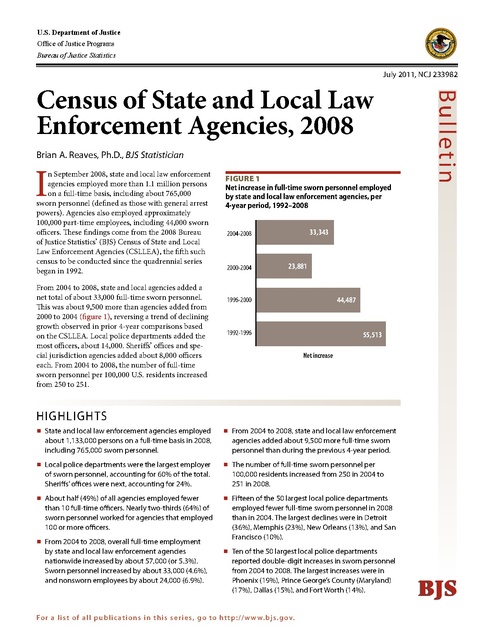
U.S. Department of Justice Office of Justice Programs Bureau of Justice Statistics July 2011, NCJ 233982 Brian A. Reaves, Ph.D., BJS Statistician I n September 2008, state and local law enforcement agencies employed more than 1.1 million persons on a full-time basis, including about 765,000 sworn personnel (defined as those with general arrest powers). Agencies also employed approximately 100,000 part-time employees, including 44,000 sworn officers. These findings come from the 2008 Bureau of Justice Statistics’ (BJS) Census of State and Local Law Enforcement Agencies (CSLLEA), the fifth such census to be conducted since the quadrennial series began in 1992. From 2004 to 2008, state and local agencies added a net total of about 33,000 full-time sworn personnel. This was about 9,500 more than agencies added from 2000 to 2004 (figure 1), reversing a trend of declining growth observed in prior 4-year comparisons based on the CSLLEA. Local police departments added the most officers, about 14,000. Sheriffs’ offices and special jurisdiction agencies added about 8,000 officers each. From 2004 to 2008, the number of full-time sworn personnel per 100,000 U.S. residents increased from 250 to 251. Figure 1 Net increase in full-time sworn personnel employed by state and local law enforcement agencies, per 4-year period, 1992–2008 33,343 2004-2008 2000-2004 Bul l etin Census of State and Local Law Enforcement Agencies, 2008 23,881 44,487 1996-2000 1992-1996 55,513 Net increase HIGHLIGHTS State and local law enforcement agencies employed about 1,133,000 persons on a full-time basis in 2008, including 765,000 sworn personnel. Local police departments were the largest employer of sworn personnel, accounting for 60% of the total. Sheriffs’ offices were next, accounting for 24%. About half (49%) of all agencies employed fewer than 10 full-time officers. Nearly two-thirds (64%) of sworn personnel worked for agencies that employed 100 or more officers. From 2004 to 2008, overall full-time employment by state and local law enforcement agencies nationwide increased by about 57,000 (or 5.3%). Sworn personnel increased by about 33,000 (4.6%), and nonsworn employees by about 24,000 (6.9%). From 2004 to 2008, state and local law enforcement agencies added about 9,500 more full-time sworn personnel than during the previous 4-year period. The number of full-time sworn personnel per 100,000 residents increased from 250 in 2004 to 251 in 2008. Fifteen of the 50 largest local police departments employed fewer full-time sworn personnel in 2008 than in 2004. The largest declines were in Detroit (36%), Memphis (23%), New Orleans (13%), and San Francisco (10%). Ten of the 50 largest local police departments reported double-digit increases in sworn personnel from 2004 to 2008. The largest increases were in Phoenix (19%), Prince George’s County (Maryland) (17%), Dallas (15%), and Fort Worth (14%). For a lis t o f all p ub l i c at i o n s i n t h i s se ri e s, go to ht t p ://w w w.b js.g ov. BJS State and local law enforcement agencies The 2008 CSLLEA included 17,985 state and local law enforcement agencies employing at least one full-time officer or the equivalent in part-time officers. The total included— 12,501 local police departments 3,063 sheriffs’ offices 50 primary state law enforcement agencies 1,733 special jurisdiction agencies 638 other agencies, primarily county constable offices in Texas. A majority of state and local law enforcement personnel worked for local police departments Local police departments were the largest employer of full-time state and local law enforcement personnel with about 593,000 (or 52%) of the more than 1.1 million employees nationwide (table 1 and appendix table 1). Sheriffs’ offices employed about 353,000 (31%). Both the 50 primary state law enforcement agencies and the special jurisdiction agencies (those that served a special geographic jurisdiction or had special enforcement or investigative responsibilities) accounted for 8% . (See table 7 for types of special jurisdiction agencies.) About 461,000 sworn state and local law enforcement employees (60%) were local police officers. Sworn personnel in sheriffs’ offices accounted for about 183,000 (24%). The 50 primary state law enforcement agencies employed about 61,000 (8%), and special jurisdiction agencies employed about 57,000 (7%). Sheriffs’ offices accounted for 46% of the 369,000 full-time civilian personnel nationwide, and local police departments accounted for 36%. Nearly half (48%) of the full-time employees in sheriffs’ offices were civilians, compared to 35% in state law enforcement agencies and 22% in local police departments (not shown in table). The largest 7% of state and local law enforcement agencies employed 64% of all sworn personnel Nearly 1,200 state and local law enforcement agencies (7%) employed 100 or more full-time sworn personnel, with 83 of those agencies employing 1,000 or more officers (table 2 and appendix table 2). The agencies with 1,000 or more officers included 49 local police departments, 20 state law enforcement agencies, 13 sheriffs’ offices, and 1 special jurisdiction agency. Agencies with 100 or more officers employed 64% of all full-time sworn personnel, and those with 1,000 or more officers employed 29%. (See appendix table 5 for the 50 largest state and local law enforcement agencies.) About 8,800 state and local law enforcement agencies (49% of the total) employed fewer than 10 full-time sworn personnel, and about 5,400 (30%) employed fewer than 5 officers. Among these smaller agencies, about 2,100 (12%) had just one full-time officer or had part-time officers only. Agencies with fewer than 10 full-time sworn personnel employed less than 5% of all full-time officers, but 50% of all part-time officers. Those employing 1,000 or more full-time sworn personnel accounted for less than 1% of all part-time officers nationwide (not shown in table). From 1992 to 2008, the growth rate for civilian personnel was more than double that of sworn personnel From 2004 to 2008, the total number of full-time state and local law enforcement employees increased by about 57,000 (5.3%). This total included an increase in sworn personnel of about 33,000 (4.6%). Civilian employment in the agencies rose by 24,000 (6.9%). Local police departments accounted for a larger proportion of the growth in sworn officers from 2004 to 2008 than other agency types, and sheriffs’ offices accounted for most of the growth in civilian employees. Table 1 State and local law enforcement employees, by type of agency, 2008 Type of agency Agencies All agencies 17,985 Local police 12,501 Sheriff’s office 3,063 Primary state 50 Special jurisdiction 1,733 Constable/marshal 638 Full-time employees Total Sworn Nonsworn 1,133,915 765,246 368,669 593,013 461,063 131,950 353,461 182,979 170,482 93,148 60,772 32,376 90,262 56,968 33,294 4,031 3,464 567 Part-time employees Total Sworn Nonsworn 100,340 44,062 56,278 58,129 27,810 30,319 26,052 11,334 14,718 947 54 893 14,681 4,451 10,230 531 413 118 Note: Excludes agencies employing less than one full-time officer or the equivalent in part-time officers. Table 2 Full-time state and local law enforcement employees, by size of agency, 2008 Size of agency* All agencies 1,000 or more officers 500–999 250–499 100–249 50–99 25–49 10–24 5–9 2–4 0–1 Agencies 17,985 83 89 237 778 1,300 2,402 4,300 3,446 3,225 2,125 Total 1,133,915 326,197 94,168 133,024 174,505 136,390 124,492 98,563 32,493 11,498 2,585 Full-time employees Sworn 765,246 230,759 60,124 83,851 115,535 89,999 83,349 67,132 23,107 9,470 1,920 Nonsworn 368,669 95,438 34,044 49,173 58,970 46,391 41,143 31,431 9,386 2,028 665 Note: Excludes agencies employing less than one full-time officer or the equivalent in part-time officers. *Based on number of full-time sworn personnel. 2 C e n s u s o f S tat e a n d Lo c a l L aw E n f o r c e m e n t A g e n c i e s , 2008 Reversing a pattern of declining growth observed in the 2000 and 2004 CSLLEA data collections, about 9,500 more fulltime sworn personnel were added from 2004 to 2008 than in the previous 4-year period. The percentage growth in the number of sworn officers from 2004 to 2008 (4.6%) exceeded growth from 2000 to 2004 (3.4%), but was about half the 9.1% peak growth rate recorded from 1992 to 1996. From 2004 to 2008, the growth rate for sworn personnel in sheriffs’ offices (4.5%) was about the same as the overall rate. The growth rates for local police departments (3.2%) and the primary state law enforcement agencies (3.4%) were lower than the overall average. The growth rate was highest among special jurisdiction agencies (16.7%). From 1992 (the year of the first CSLLEA) to 2008, state and local law enforcement agencies added more than 287,000 full-time employees (a 34% increase), including about 157,000 sworn officers (26%) and 130,000 civilian employees (55%) (figure 2). Nationwide there was 1 sworn officer for every 400 residents In 2008 there were 373 full-time state and local law enforcement employees per 100,000 residents nationwide, compared to 367 per 100,000 in 2004 and 332 per 100,000 in 1992 (figure 3). There were 251 sworn personnel per 100,000 residents nationwide in 2008, or about 1 officer for every 400 residents. This was a slight increase over the 2004 ratio of 250 per 100,000 residents. There were more than 300 full-time sworn personnel per 100,000 residents in the District of Columbia (722), Louisiana (405), New Jersey (389), New York (341), Illinois (321), and Wyoming (317) (figure 4). In contrast, there were fewer than 200 full-time sworn personnel per 100,000 residents in Washington (174), Utah (175), Oregon (177), Vermont (178), Kentucky (183), Minnesota (185), West Virginia (186), Alaska (189), Michigan (190), Iowa (195), and Maine (195). (See appendix table 6 for stateby-state agency and employee counts.) J u ly 2011 Figure 2 Full-time state and local and law enforcement employees, 1992–2008 Total 846,410 921,968 1,019,496 1,076,897 1,133,915 708,022 731,903 765,246 Sworn officers 608,022 663,535 Civilians 238,388 258,433 311,474 344,994 368,669 1992 1996 2000 2004 2008 Figure 3 Full-time state and local and law enforcement employees per 100,000 residents, 1992–2008 348 361 367 373 251 250 251 Total 332 Sworn officers 238 Civilians 93 97 110 118 121 1992 1996 2000 2004 2008 250 Note: Detail may not sum to total due to rounding. Figure 4 Full-time sworn personnel per 100,000 residents employed by state and local law enforcement agencies, 2008 Number of full-time sworn personnel per 100,000 residents Less than 200 200–249 250–299 300 or more 3 Local police departments In 2008, 12,501 local police departments in the United States employed at least one full-time officer or the equivalent in part-time officers. Nearly all (98%) were operated by a municipal government. The remainder were operated by a county, tribal, or consolidated citycounty government or served multiple jurisdictions under a regional or joint arrangement. Overall, about a third (35%) of the nearly 36,000 sub-county (municipal, township) general purpose local governments nationwide operated a local police department. States with the largest numbers of local police departments were Pennsylvania (965), Texas (788), Illinois (701), Ohio (678), New Jersey (476), Michigan (455), Missouri (430), and Wisconsin (429). States with the fewest were Hawaii (4), Delaware (36), Nevada (38), Rhode Island (39), and Alaska (42). (See appendix table 7 for state-by-state agency and employee counts.) Although most local police departments were small, most local police officers worked for larger agencies More than half of local police departments employed fewer than 10 full-time officers, and the overall median size was 8 full-time officers (table 3). Although departments with fewer than 10 full-time officers comprised 53% of all agencies, they employed just 6% of all officers (appendix table 3). A total of 638 (5%) of local police departments employed 100 or more full-time sworn personnel. These agencies employed 61% of all local police officers. About 14,000 local police officers were added nationwide from 2004 to 2008, compared to about 6,000 in the previous 4-year period From 2004 to 2008, the total number of full-time local police employees increased by 20,000 (3.5%) to about 593,000 (figure 5). The number of full-time sworn personnel increased by 14,000 (3.2%) to about 461,000 during this period. The number of civilian employees rose by 6,000 (4.6%) to about 132,000. 4 From 2004 to 2008, 15 of the 50 largest local police departments experienced a decrease in number of officers employed, compared to 20 of 50 between 2000 and 2004. The decline was small for some departments, such as the NYPD, which had 95 (0.3%) fewer officers in 2008 than 2004. In other departments, the loss was more substantial. Four of the 50 largest departments experienced a drop of more than 10% in the number of full-time officers from 2004 to 2008: From 2004 to 2008, the number of local police officers fell by 36% in Detroit and by 23% in Memphis During 2008 the New York City Police Department (NYPD), with 36,023 full-time officers, remained the largest local police department in the United States (appendix table 8). The NYPD employed nearly 3 times as many sworn personnel as the next largest agency— the Chicago Police Department (13,354 officers). The other three local police departments that employed 5,000 or more officers during 2008 were in Los Angeles (9,727 officers), Philadelphia (6,624), and Houston (5,053). Detroit Police (down 35.9%) Memphis Police (down 23.2%) New Orleans Police (down 13.4%) San Francisco Police (down 10.5%). Table 3 Full-time local police employees, by size of agency, 2008 Size of agency* All agencies 1,000 or more officers 500–999 250–499 100–249 50–99 25–49 10–24 5–9 2–4 0–1 Agencies 12,501 49 43 101 445 815 1,543 2,846 2,493 2,637 1,529 Total 593,013 194,829 39,447 47,910 85,345 72,701 67,743 55,476 19,687 8,405 1,470 Full-time employees Sworn 461,063 150,444 29,985 36,021 64,939 56,060 53,465 44,520 16,582 7,694 1,353 Nonsworn 131,950 44,385 9,462 11,889 20,406 16,641 14,278 10,956 3,105 711 117 Note: Excludes agencies employing less than one full-time officer or the equivalent in part-time officers. *Based on number of full-time sworn personnel. Figure 5 Full-time employees in local police departments, 1992–2008 Total 478,586 521,625 410,596 565,915 573,152 593,013 440,920 446,974 461,063 Sworn officers 374,524 Civilians 104,062 111,029 124,995 126,178 131,950 1992 1996 2000 2004 2008 C e n s u s o f S tat e a n d Lo c a l L aw E n f o r c e m e n t A g e n c i e s , 2008 Ten local police departments had a double-digit percentage increase in number of officers from 2004 to 2008 Among the 50 largest local police departments, 35 employed more fulltime officers in 2008 than in 2004. The departments serving the following jurisdictions reported a double-digit increase: Phoenix, Arizona (up 18.5%) Prince George’s County, Maryland (up 17.4%) Dallas, Texas (up 15.5%) Montgomery County, Maryland (up 15.2%) Fort Worth, Texas (up 14.0%) DeKalb County, Georgia (up 13.1%) Charlotte-Mecklenburg County, North Carolina (up 12.7%) Austin, Texas (up 11.2%) Boston, Massachusetts (up 11.2%) Las Vegas-Clark County, Nevada (up 10.0%). About half of the 50 largest departments had fewer officers per 100,000 residents in 2008 than 2004 In 2008, the Washington, D.C. Metropolitan Police continued to have the highest ratio of full-time officers (634 officers per 100,000 residents), but this was an 3% decrease from 2004. Despite a 13% reduction in officers since 2004, the New Orleans Police had the seventh highest ratio of officers to residents at 423 per 100,000. This ratio was 19% higher than in 2004 as the city’s population (although growing since 2007) remained well below the levels that existed prior to Hurricane Katrina in August 2005. Other large local police departments with more than 400 officers per 100,000 residents during 2008 included those in Chicago (472), Newark (472), Baltimore (469), Philadelphia (430), and New York (432). The lowest ratios among the 50 largest departments were in Montgom- J u ly 2011 ery County (Maryland) (129), Fairfax County (Virginia) (144), San Jose (146), San Antonio (150), and DeKalb County (Georgia) (168). Overall, 24 of the 50 largest local police departments had fewer officers per 100,000 residents in 2008 than in 2004. Sheriffs’ offices The office of sheriff exists in nearly every county and independent city in the United States with a total of 3,085 offices nationwide. A total of 3,063 sheriffs’ offices employed at least one full-time sworn officer or the equivalent in part-time officers during 2008. (Note: Some sheriffs’ offices that have been involved in consolidations of county and municipal governmental functions are classified as local police in the CSLLEA.) States with the most sheriffs’ offices were Texas (254), Georgia (159), Kentucky (120), Missouri (114), Kansas (104), Illinois (102), and North Carolina (100). (See appendix table 9 for state-by-state agency and employee counts). Alaska, Connecticut, Hawaii, and Rhode Island do not have any local sheriffs’ offices. In those four states the court related duties typically performed by local sheriffs’ offices are the responsibility of state agencies. The District of Columbia also does not have a sheriffs’ office, where such duties are performed by the U.S. Marshals Service. Nearly all sheriffs’ offices performed law enforcement and court-related functions; about 3 in 4 operated at least one jail Nearly all (96%) sheriffs’ offices performed traditional law enforcement functions such as providing patrol services, responding to citizen calls for service, and enforcing traffic laws. A similar percentage performed courtrelated duties such as serving process (98%) and providing court security (96%). In addition, 75% of sheriffs’ offices were responsible for operating at least one jail. Nationwide, sheriffs’ offices had the equivalent of 59% of their full-time sworn personnel assigned to law enforcement operations, 23% to jail operations, 12% to court operations, and 6% to other duty areas. (Note: The CSLLEA counts all personnel with general arrest powers as sworn officers regardless of duty area.) Nearly 400 sheriffs’ offices employed 100 or more full-time sworn personnel In 2008, 13 sheriffs’ offices employed 1,000 or more full-time sworn officers, accounting for 18% of the full-time sworn personnel employed by sheriffs’ offices nationwide (table 4 and appendix table 4). A total of 378 (12%) sheriffs’ offices employed at least 100 officers, accounting for 66% of sworn personnel. Table 4 Full-time sheriffs’ employees, by size of agency, 2008 Size of agency* All agencies 1,000 or more officers 500–999 250–499 100–249 50–99 25–49 10–24 5–9 2–4 0–1 Agencies 3,063 13 27 98 240 327 573 910 569 261 45 Total 353,461 59,981 34,348 64,704 68,265 44,772 40,988 30,121 8,485 1,615 182 Full-time employees Sworn 182,979 32,897 17,184 34,743 36,085 23,037 20,084 14,196 3,901 822 30 Nonsworn 170,482 27,084 17,164 29,961 32,180 21,735 20,904 15,925 4,584 793 152 Note: Excludes agencies employing less than one full-time officer or the equivalent in part-time officers. *Based on number of full-time sworn personnel. 5 While more than half of local police departments employed fewer than 10 full-time officers in 2008, less than a third (29%) of sheriffs’ offices were this small. The median staffing level of sheriffs’ offices was 18 full-time sworn personnel. Sheriffs’ offices added more than twice as many civilian employees as sworn ones from 2004 to 2008 From 2004 to 2008, total full-time staff in sheriffs’ offices increased by 27,000 employees (8.2%) to about 353,000 (figure 6). The number of full-time sworn personnel increased by 8,000 (4.5%) to about 183,000 during this period. The number of civilian employees rose by 19,000 (12.5%) to about 170,000. The Los Angeles County Sheriff ’s Department was the largest in the United States, employing 9,461 full-time sworn personnel (appendix table 10). About a third of these officers had regularly assigned duties that included responding to citizen calls for service, with the remainder assigned to court and jail-related duties. The second largest sheriff ’s office served Cook County, Illinois, with 5,655 sworn personnel. Just 4% of these officers were assigned to respond to calls. Among the 50 largest sheriffs’ offices, the percent of sworn personnel assigned to respond to calls for service ranged from 0% to 97%. All but one agency reported having at least some sworn personnel who regularly performed law enforcement duties, and all but four had sworn personnel who performed courtrelated functions. About two-thirds of the agencies employed sworn personnel who performed jail-related duties. Primary state law enforcement agencies The CSLLEA identifies a primary state law enforcement agency in each of the 50 states. Depending on the state, this agency may be a state police agency, highway patrol agency, or a department of public safety. The latter are often more complex organizations and may encompass several agencies or divisions. Comparisons between primary state law enforcement agencies may not always 6 be appropriate because of differences in organizational structure and responsibilities. agencies employed 1,000 or more sworn personnel, and 35 agencies employed at least 500 full-time officers. From 2004 to 2008, employment by primary state law enforcement agencies rose by about 4% State agencies had 3,240 (3.6%) more employees in 2008 than in 2004. (figure 7) Employment of full-time sworn personnel increased by about 2,000 (3.4% change) from to 2004 to 2008. Civilian employment rose by about 1,300 (4.0% change) during this period. In 2008, the 50 primary state law enforcement agencies had 93,148 full-time employees, including about 61,000 fulltime sworn personnel (table 5). Twenty Figure 6 Full-time employees in sheriffs’ offices, 1992–2008 293,823 Total Sworn officers Civilians 225,404 136,592 326,531 257,712 152,922 88,812 104,790 1992 1996 164,711 175,018 129,112 151,513 2000 2004 353,461 182,979 170,482 2008 Table 5 Full-time primary state law enforcement agency employees, by size of agency, 2008 Size of agency* All agencies 1,000 or more officers 500–999 250–499 100–249 Agencies 50 20 15 10 5 Total 93,148 69,616 16,986 5,270 1,276 Full-time employees Sworn 60,772 45,751 10,413 3,694 914 Nonsworn 32,376 23,865 6,573 1,576 362 *Based on number of full-time sworn personnel. Figure 7 Full-time employees in primary state law enforcement agencies, 1992–2008 Total 78,570 Sworn officers 52,980 Civilians 25,590 1992 93,148 83,742 87,028 89,908 54,587 56,348 58,785 60,772 29,155 30,680 31,123 32,376 1996 2000 2004 2008 C e n s u s o f S tat e a n d Lo c a l L aw E n f o r c e m e n t A g e n c i e s , 2008 The California Highway Patrol was the largest state law enforcement agency The largest state law enforcement agency, the California Highway Patrol, had 7,202 full-time sworn personnel, followed by the New York State Police (4,847), Pennsylvania State Police (4,458), Texas Department of Public Safety (3,529), and New Jersey State Police (3,053) (table 6). Five agencies had fewer than 250 fulltime sworn personnel: the North Dakota Highway Patrol (139), South Dakota Highway Patrol (152), Rhode Island State Police (201), Wyoming Highway Patrol (204), and Montana Highway Patrol (218). The Delaware State Police (75) had the largest number of full-time officers per 100,000 residents, followed by the Vermont State Police (49) and the Alaska State Troopers (40). The Wisconsin State Patrol (9), Florida Highway Patrol (9), and Minnesota State Patrol (10) had the smallest numbers of full-time officers per 100,000 residents. From 2004 to 2008, 30 of the 50 primary state law enforcement agencies increased the number of full-time sworn personnel they employed. Three agencies increased their number of full-time sworn personnel by more than 20%: the South Carolina Highway Patrol (up 23.2%), the New Hampshire State Police (up 21.1%), and the North Carolina State Highway Patrol (up 20.4%). The largest decreases in the number of full-time sworn personnel were reported by the Utah Department of Public Safety (down 11.7%), the Maryland State Police (down 9.8%), and the Idaho State Police (down 8.3%). The ratio of full-time sworn personnel per 100,000 residents served increased in 23 agencies from 2004 to 2008. The largest increases of officers per 100,000 residents were reported by the New Hampshire State Police (up 18.4%), the Iowa Department of Public Safety (up 17.6%), and the Louisiana State Police (up 15.3%). The largest decreases were reported by the Utah Department of Public Safety (down 21.0%), the Idaho State Police (down 16.5%), and the Georgia Department of Public Safety (down 13.2%). J u ly 2011 Table 6 Primary state law enforcement agency full-time sworn personnel, 2008 Agency U.S. total Alabama Dept. of Public Safety Alaska State Troopers Arizona Dept. of Public Safety Arkansas State Police California Highway Patrol Colorado State Police Connecticut State Police Delaware State Police Florida Highway Patrol Georgia Dept. of Public Safety Hawaii Dept. of Public Safety* Idaho State Police Illinois State Police Indiana State Police Iowa Dept. of Public Safety Kansas Highway Patrol Kentucky State Police Louisiana State Police Maine State Police Maryland State Police Massachusetts State Police Michigan State Police Minnesota State Patrol Mississippi Highway Safety Patrol Missouri State Highway Patrol Montana Highway Patrol Nebraska State Patrol Nevada Highway Patrol New Hampshire State Police New Jersey State Police New Mexico State Police New York State Police North Carolina State Highway Patrol North Dakota Highway Patrol Ohio State Highway Patrol Oklahoma Dept. of Public Safety Oregon State Police Pennsylvania State Police Rhode Island State Police South Carolina Highway Patrol South Dakota Highway Patrol Tennessee Dept. of Safety Texas Dept. of Public Safety Utah Dept. of Public Safety Vermont State Police Virginia State Police Washington State Police West Virginia State Police Wisconsin State Patrol Wyoming Highway Patrol Total 60,772 763 274 1,244 525 7,202 742 1,227 658 1,606 1,048 290 264 2,105 1,315 669 525 882 1,215 334 1,440 2,310 1,732 530 594 1,028 218 491 417 350 3,053 528 4,847 1,827 139 1,560 825 596 4,458 201 967 152 942 3,529 475 307 1,873 1,132 667 492 204 Percent change from 2004 3.4% 9.2% -5.2 10.6 3.3 1.7 9.0 6.5 2.5 -2.9 -5.6 18.9 -8.3 4.8 13.6 19.7 -3.0 -5.8 14.3 -1.2 -9.8 5.0 -7.0 -2.6 11.0 -6.3 5.8 -2.4 -1.0 21.1 10.3 -6.7 3.9 20.4 3.0 3.9 2.1 -4.0 6.1 5.8 23.2 -1.3 -3.1 2.7 -11.7 -5.5 0.2 6.9 4.1 -3.5 8.5 Per 100,000 residents 20 16 40 19 18 20 15 35 75 9 11 23 17 16 21 22 19 21 27 25 25 35 17 10 20 17 23 28 16 26 35 27 25 20 22 14 23 16 35 19 21 19 15 15 17 49 24 17 37 9 38 Percent change from 2004 -0.5% 5.3% -8.8 -2.0 -1.0 -1.2 1.5 5.6 -3.3 -8.4 -13.2 15.6 -16.5 3.2 10.5 17.6 -5.3 -8.8 15.3 -2.0 -11.6 3.5 -6.2 -5.4 9.0 -9.4 1.2 -4.6 -11.8 18.4 9.6 -11.2 3.0 11.1 2.1 3.3 -1.5 -9.3 4.6 7.6 14.9 -5.0 -8.1 -5.3 -21.0 -6.0 -4.0 0.7 3.4 -5.5 2.4 *The Hawaii Department of Public Safety was previously classified in the CSLLEA as a special jurisdiction agency. 7 Special jurisdiction law enforcement agencies More than 1,700 state and local law enforcement agencies served a special geographic jurisdiction, or had special enforcement or investigative responsibilities during 2008. These agencies employed about 90,000 persons full time, including 57,000 sworn personnel (table 7). About 11,000 full-time sworn personnel were employed at 4-year public universities and colleges More than two-thirds of special jurisdiction law enforcement agencies served public buildings and facilities, employing more than 21,000 sworn personnel. Within this group were more than 500 campus police departments serving 4-year public institutions. These agencies employed about 11,000 full-time sworn officers. Another 253 campus police agencies served 2-year public colleges, employing more than 2,600 full-time sworn personnel. Additionally, 18 agencies, employing more than 700 full-time officers, served medical campuses. Table 7 Special jurisdiction law enforcement agencies and full-time sworn personnel, by type of jurisdiction, 2008 Type of special jurisdiction Total Public buildings/facilities 4-year university/college Public school district 2-year college State government buildings Medical school/campus Public hospital/health facility Public housing Other state-owned facilities Natural resources Fish and wildlife conservation laws Parks and recreational areas Multi-function natural resources Boating laws Environmental laws Water resources Forest resources Levee district Transportation systems/facilities Airports Mass transit system/railroad Transportation—multiple types Commercial vehicles Harbor/port facilities Bridges/tunnels Criminal investigations State bureau of investigation County/city investigations Fraud investigations Fire marshal/arson investigations Tax/revenue enforcement Other/multiple types Special enforcement Alcohol/tobacco laws Agricultural laws Narcotics laws Gaming laws Racing laws Agencies 1,733 1,126 508 250 253 29 18 48 13 7 246 56 124 16 10 7 18 9 6 167 103 18 5 12 25 4 140 22 66 13 21 6 12 54 22 12 5 10 5 Full-time sworn personnel 56,968 21,418 10,916 4,764 2,648 1,138 747 715 250 240 14,571 5,515 4,989 2,926 461 368 185 65 62 11,508 3,555 3,214 2,000 1,320 876 543 7,310 3,527 2,006 636 478 177 486 2,161 1,280 387 233 231 30 Note: Excludes agencies employing less than one full-time officer or the equivalent in part-time officers. 8 C e n s u s o f S tat e a n d Lo c a l L aw E n f o r c e m e n t A g e n c i e s , 2008 The largest campus law enforcement agency serving a public institution of higher education was the Temple University Police Department in Philadelphia, which employed 125 full-time sworn personnel (table 8). The next largest were at the University of Medicine & Dentistry of New Jersey (94 fulltime officers), the University of Texas Health Science Center in Houston (94), the University of Maryland-College Park (90), and the University of Florida (85). (For more information on campus law enforcement agencies including those serving private campuses and those not employing sworn personnel, see Campus Law Enforcement Agencies, 2004-05, BJS Web, February 2008.) A total of 250 special jurisdiction agencies served public school districts The 250 police departments operated by public school districts nationwide employed nearly 5,000 full-time sworn personnel. Although some large school systems, including those in New York and Chicago, obtained services from their city police departments, some of the largest systems had their own police departments with full-time sworn personnel. The largest of these in 2008 was the School District of Philadelphia which employed 450 full-time sworn officers (table 9). Other large school police departments included those serving districts in Los Angeles (340 full-time officers); Miami-Dade County, Florida (210); Houston, Texas (197); Palm Beach County, Florida (176); Clark County, Nevada (157); and Baltimore, Maryland (142). Another 29 special jurisdiction agencies, employing more than 1,100 officers, were responsible for providing services for state government buildings. Many of these agencies use the name capitol police, reflecting the most prominent of the facilities they protect. In some states, police protection for the capitol and other state government buildings falls under the jurisdiction of a primary state law enforcement agency, such as the state police. Table 8 Thirty largest law enforcement agencies serving public colleges and universities, by number of full-time sworn personnel, 2008 Table 9 Fifteen largest law enforcement agencies serving public school districts, by number of full-time sworn personnel, 2008 College or University Temple University University of Medicine & Dentistry of New Jersey University of Texas Health Science Center University of Maryland - College Park University of Florida University of Alabama - Birmingham City University of New York - Brooklyn College University of Georgia University of Illinois at Chicago Virginia Commonwealth University University of California - Berkeley University of Pittsburgh State University of New York at Stony Brook Arizona State University Michigan State University Georgia State University University of Central Florida Texas A & M University University of Massachusetts - Amherst University of Mississippi Medical Center University of Wisconsin - Madison Florida State University Georgia Tech University Louisiana State University Police University of Maryland - Baltimore University of Cincinnati Medical University of South Carolina University of Texas - Austin University of Alabama State University of New York at Buffalo School district School District of Philadelphia (PA) Los Angeles (CA) Unified School District Miami-Dade (FL) County Public Schools Houston (TX) Independent School District Palm Beach (FL) County School District Clark County (NV) School District Baltimore City (MD) Public Schools Indianapolis (IN) Public Schools Dallas (TX) Independent School District DeKalb County (GA) School System Northside (TX) Independent School District Boston (MA) Public Schools San Antonio (TX) Independent School District Austin (TX) Independent School District Detroit (MI) Public Schools J u ly 2011 Full-time sworn personnel 125 94 94 90 85 79 79 78 74 74 73 73 71 70 69 68 64 64 63 63 63 62 62 62 62 62 62 62 61 61 Full-time sworn personnel 450 340 210 197 176 157 142 90 88 83 83 80 71 70 60 9 Nearly 15,000 full-time sworn personnel were employed in jobs related to natural resources After agencies serving public buildings and facilities, the next largest employer of full-time sworn personnel among special jurisdiction agencies was the group responsible for enforcing laws pertaining to natural resources. Most of these agencies enforced laws pertaining to fish and wildlife conservation, or provided law enforcement services for parks and recreation areas. Other functions included enforcing environmental pollution laws, boating laws, and protecting vital forest and water resources. Overall, these 246 agencies employed nearly 15,000 full-time sworn personnel. Many of the largest natural resources law enforcement agencies were operated at the state level, including 28 of the 30 largest (table 10). The California Department of Parks and Recreation employed the most full-time sworn personnel (645), followed by the Florida Fish and Wildlife Conservation Commission (626), Texas Parks & Wildlife Department (480), Ohio Department of Natural Resources (394), and California Department of Fish & Game (330). 10 The largest local-level agency in this category was operated by the New York City Department of Environmental Protection, which employed 168 full-time police officers to protect the city’s watershed and water infrastructure. Many park police agencies also existed at the local and regional levels, and 21 Native American tribes employed separate agencies with full-time sworn personnel to enforce laws pertaining to fish and wildlife conservation. Table 10 Thirty largest state and local natural resource law enforcement agencies , by number of full-time sworn personnel, 2008 Agency California Department of Parks & Recreation Florida Fish and Wildlife Conservation Commission Texas Parks & Wildlife Department Ohio Department of Natural Resources California Department of Fish and Game New York State Department of Environmental Conservation New York State Park Police Tennessee Wildlife Resources Agency Maryland State Forest and Park Service Washington State Parks and Recreation Commission South Carolina Department of Natural Resources Lousiana Wildlife And Fisheries Department Mississippi Department of Wildlife, Fisheries & Parks Colorado Division of Wildlife Maryland Natural Resources Police Georgia Department of Natural Resources North Carolina Wildlife Resources Commission Tennessee Department of Environment & Conservation Missouri Department of Conservation Indiana Department of Natural Resources Minnesota Department of Natural Resources Michigan Department of Natural Resources Pennsylvania Game Commission - Law Enforcement Wisconsin Department of Natural Resources North Carolina Division of State Parks & Recreation Arkansas Game And Fish Commission Kansas Department of Wildlife & Parks New York City Department of Environmental Protection Police Virginia Department Game and Inland Fisheries New York City Parks Enforcement Patrol Full-time sworn personnel 645 626 480 394 330 321 305 275 261 250 238 235 230 226 224 209 209 209 204 201 200 195 191 189 185 183 178 168 160 149 C e n s u s o f S tat e a n d Lo c a l L aw E n f o r c e m e n t A g e n c i e s , 2008 Agencies tasked with safeguarding transportation systems and facilities employed more than 11,000 full-time sworn personnel Transportation-related jurisdictions, such as mass transit systems, airports, bridges, tunnels, commercial vehicles, and port facilities, have been a major area of focus for homeland security efforts in recent years. In 2008, 167 law enforcement agencies had specific transportation-related jurisdictions and employed about 11,500 full-time sworn officers. The largest, the Port Authority of New York and New Jersey Police Department, employed 1,667 officers in 2008 (table 11). The multiple jurisdictions of the Port Authority Police included LaGuardia, Kennedy, and Newark Airports, the Lincoln and Holland Tunnels, the George Washington and Staten Island Bridges, the PATH train system, the Port Authority Bus Terminal, and the Port Newark and Port Elizabeth Marine Terminals. After the Port Authority Police, the five largest transportation-related police forces were employed by the New York State Metropolitan Transportation Authority (694 officers), Los Angeles World Airports (577), Maryland Transportation Authority (456), Washington, D.C. Metropolitan Area Transit Authority (442), and Metropolitan Atlanta Rapid Transit Authority (MARTA) (309). Law enforcement services for some large airport and transit systems are provided by a local police department or sheriff ’s office. For example, the police departments in New York City and Chicago are responsible for the subway systems in those cities. In addition, the Chicago Police also provide law enforcement services for O’Hare and Midway airports, working in conjunction with the 251 unarmed sworn officers of the Chicago Department of Aviation. J u ly 2011 Table 11 Fifty largest state and local law enforcement agencies with transportation-related jurisdictions, by number of full-time sworn personnel, 2008 Agency Port Authority of New York & New Jersey New York State Metropolitan Transportation Authority Los Angeles World Airports Maryland Transportation Authority Washington Metropolitan Area Transit Authority Metropolitan Atlanta Rapid Transit Authority (MARTA) Massachusetts Bay Transportation Authority (MBTA) Southeastern Pennsylvania Transportation Authority (SEPTA) Chicago Department of Aviation Dallas/Fort Worth International Airport Metropolitan Washington Airports Authority New Jersey Transit Bay Area Rapid Transit (BART) Harris County Metropolitan Transit Authority Dallas Area Rapid Transit Delaware River Port Authority Maryland Transit Administration Port of San Diego Port of Los Angeles Wayne County Airport Authority Port of Seattle Greater Cleveland Regional Transit Authority Metra (Chicago area) Austin-Bergstrom International Airport Lambert - St. Louis International Airport Virginia Port Authority Niagara Frontier Transportation Authority Minneapolis - St. Paul Metropolitan Airports Commission Tampa International Airport Georgia Ports Authority San Antonio International Airport Anchorage International Airport Salt Lake City International Airport Nashville International Airport Minneapolis - St. Paul Metro Transit Kansas City International Airport Cincinnati/Northern Kentucky International Airport Port of Portland Delaware River & Bay Authority Memphis International Airport Alabama State Port Authority Indianapolis Airport Authority Port of Houston Authority Port of New Orleans Allegheny Port Authority Jacksonville Aviation Authority T.F. Green Airport (Rhode Island) Columbus Airport Authority Utah Transit Authority Albuquerque International Sunport Full-time sworn officers 1,667 694 577 456 442 309 256 256 251 237 206 201 192 179 156 144 140 139 133 125 98 97 96 91 89 88 86 82 80 78 66 65 65 61 60 54 54 53 50 49 48 47 46 44 42 42 42 41 40 40 11 Methodology The Bureau of Justice Statistics’ (BJS) Census of State and Local Law Enforcement Agencies (CSLLEA) is conducted every 4 years to provide a complete enumeration of agencies and their employees. Employment data are reported by agencies for sworn and nonsworn (civilian) personnel and, within these categories, by full-time or part-time status. Agencies also complete a checklist of functions they regularly perform, or have primary responsibility for, within the following areas: patrol and response, criminal investigation, traffic and vehicle-related functions, detentionrelated functions, court-related functions, special public safety functions (e.g., animal control), task force participation, and specialized functions (e.g., search and rescue). Data were collected on behalf of BJS by the National Opinion Research Center (NORC) at the University of Chicago. More than half (52%) of all responses were submitted in hardcopy version by mail or fax. Another 41% were received through a secure website operated by NORC. The remaining 7% of agencies did not respond by website, mail, or fax within the allotted timeframe and were contacted by phone with BJS’s assistance. The information necessary to determine eligibility was obtained from all agencies. Responding agencies were screened for eligibility and were excluded if any of the following conditions existed on the CSLLEA reference date of September 30, 2008. The percentage of agencies from the original master list that were ruled ineligible through each criterion is in parentheses. The agency employed only part-time officers, and their total combined works hours averaged less than 35 hours per week (5.1% of agencies from master list excluded). The CSLLEA provides national data on the number of state and local law enforcement agencies and employees for local police departments, sheriffs’ offices, state law enforcement agencies, and special jurisdiction agencies. It also serves as the sampling frame for BJS surveys of law enforcement agencies. The agency was closed, represented a duplicate listing, or was otherwise an invalid entry (2.2% excluded). The 2008 CSLLEA form was mailed to 20,110 agencies that were determined to potentially be operating on the reference date of September 30, 2008. This master list was created by compiling information from the following sources: The agency contracted or outsourced to another agency for performance of all services (1.7% excluded). The agency did not employ personnel with general arrest powers (0.6% excluded). The agency did not operate with funds from a state, local, special district, or tribal government (0.6% excluded). All sworn officers volunteered their time on an unpaid basis (0.3% excluded). The 2004 CSLLEA Lists provided by Peace Officer Standards and Training offices and other state agencies An FBI list of agencies requesting new identifiers since the 2004 CSLLEA Data on number and type of personnel were obtained from all eligible agencies. Data on agency functions were obtained from 99.0% and on primary duty area of sworn personnel from 99.4% of eligible agencies. The ratios of personnel per 100,000 residents were calculated using final population estimates published by the Census Bureau for July 1st of each CSLLEA year. The ratios for countylevel agencies in appendix table 8 exclude the population of municipalities within the counties that were operating their own police departments. The counts generated by the CSLLEA are more inclusive than those of the FBI’s Uniform Crime Reporting (UCR) program. The CSLLEA includes all officers with arrest powers regardless of function, while the UCR data exclude officers not paid out of police funds. This exclusion generally pertains to officers working exclusively for jails or courts. Another reason the UCR counts are lower than those from the CSLLEA is that the UCR excludes some agencies that do not have an Originating Agency Identifier (ORI) assigned by the FBI. Some agencies without an ORI are still included in the UCR employee counts (but not in the agency counts) because they report their data to another agency, which reports it to the FBI. Overall, the UCR data cover about 95% of the U.S. population, while the CSLLEA covers 100%. In addition to greater population coverage, the CSLLEA has counted about 8% more sworn personnel than the UCR in 2000, 2004, and 2008 (table 12). Over time, the employment growth trends recorded by the CSLLEA have been consistent with those recorded by the UCR. Table 12 Comparison of CSLLEA and Uniform Crime Reports data, 1992–2008 Year 2008 2004 2000 1996 1992 12 Number of agencies reporting Total full-time employees Full-time sworn personnel Population covered (in millions) CSLLEA UCR CSLLEA UCR CSLLEA UCR CSLLEA UCR 17,985 14,169 1,133,915 1,024,228 765,246 708,569 304 286 17,876 14,254 1,076,897 970,588 731,903 675,734 294 278 17,784 13,535 1,019,496 926,583 708,022 654,601 282 265 18,229 13,025 921,968 829,858 663,535 595,170 265 249 17,360 13,032 846,410 748,830 608,113 544,309 255 242 Officers per 100,000 population CSLLEA UCR 251 248 250 243 251 247 246 239 237 225 C e n s u s o f S tat e a n d Lo c a l L aw E n f o r c e m e n t A g e n c i e s , 2008 Appendix Table 1 Percent of state and local law enforcement employees, by type of agency, 2008 Type of agency All agencies Local police Sheriff’s office Primary state Special jurisdiction Constable/marshal Agencies 100% 69.5% 17.0 0.3 9.6 3.5 Full-time employees Total Sworn Nonsworn 100% 100% 100% 52.3% 60.3% 35.8% 31.2 23.9 46.2 8.2 7.9 8.8 8.0 7.4 9.0 0.4 0.5 0.2 Part-time employees Total Sworn Nonsworn 100% 100% 100% 57.9% 63.1% 53.9% 26.0 25.7 26.2 0.9 0.1 1.6 14.6 10.1 18.2 0.5 0.9 0.2 Note: Excludes agencies employing less than one full-time officer or the equivalent in part-time officers. Detail may add to total because of rounding. Appendix Table 2 Percent distribution of full-time state and local law enforcement employees, by size of agency, 2008 Size of agency* All agencies 1,000 or more officers 500-999 250-499 100-249 50-99 25-49 10-24 5-9 2-4 0-1 Agencies 100% 0.5% 0.5 1.3 4.3 7.2 13.4 23.9 19.2 17.9 11.8 Total 100% 28.8% 8.3 11.7 15.4 12.0 11.0 8.7 2.9 1.0 0.2 Full-time employees Sworn Nonsworn 100% 100% 30.2% 25.9% 7.9 9.2 11.0 13.3 15.1 16.0 11.8 12.6 10.9 11.2 8.8 8.5 3.0 2.5 1.2 0.6 0.3 0.2 Note: Excludes agencies employing less than one full-time officer or the equivalent in part-time officers. Detail may not add to total because of rounding. *Based on number of full-time sworn personnel. Appendix Table 3 Percent distribution of full-time local police employees, by size of agency, 2008 Size of agency* All agencies 1,000 or more officers 500-999 250-499 100-249 50-99 25-49 10-24 5-9 2-4 0-1 Agencies 100% 0.4% 0.3 0.8 3.6 6.5 12.3 22.8 19.9 21.1 12.2 Total 100% 32.9% 6.7 8.1 14.4 12.3 11.4 9.4 3.3 1.4 0.2 Full-time employees Sworn Nonsworn 100% 100% 32.6% 33.6% 6.5 7.2 7.8 9.0 14.1 15.5 12.2 12.6 11.6 10.8 9.7 8.3 3.6 2.4 1.7 0.5 0.3 0.1 Note: Excludes agencies employing less than one full-time officer or the equivalent in part-time officers. Detail may not add to total because of rounding. *Based on number of full-time sworn personnel. Appendix Table 4 Percent distribution of full-time sheriffs’ employees, by size of agency, 2008 Size of agency* All agencies 1,000 or more officers 500-999 250-499 100-249 50-99 25-49 10-24 5-9 2-4 0-1 Agencies 100% 0.4% 0.9 3.2 7.8 10.7 18.7 29.7 18.6 8.5 1.5 Total 100% 17.0% 9.7 18.3 19.3 12.7 11.6 8.5 2.4 0.5 0.1 Full-time employees Sworn 100% 18.0% 9.4 19.0 19.7 12.6 11.0 7.8 2.1 0.4 -- Nonsworn 100% 15.9% 10.1 17.6 18.9 12.7 12.3 9.3 2.7 0.5 0.1 Note: Excludes agencies employing less than one full-time officer or the equivalent in part-time officers. Detail may not sum to total because of rounding. --Less than 0.05%. *Based on number of full-time sworn personnel. J u ly 2011 13 Appendix Table 5 Fifty largest state and local law enforcement agencies, by number of full-time sworn personnel, 2008 Agency New York City (NY) Police Chicago (IL) Police Los Angeles (CA) Police Los Angeles County (CA) Sheriff California Highway Patrol Philadelphia (PA) Police Department Cook County (IL) Sheriff Houston (TX) Police New York State Police Pennsylvania State Police Washington (DC) Metropolitan Police Texas Department of Public Safety Dallas (TX) Police Phoenix (AZ) Police Miami-Dade (FL) Police New Jersey State Police Baltimore (MD) Police Las Vegas (NV) Metropolitan Police Nassau County (NY) Police Suffolk County (NY) Police Harris County (TX) Sheriff Massachusetts State Police Detroit (MI) Police Boston (MA) Police Riverside County (CA) Sheriff Illinois State Police San Antonio (TX) Police Milwaukee (WI) Police San Diego (CA) Police San Francisco (CA) Police Honolulu (HI) Police Baltimore County (MD) Police Columbus (OH) Police Virginia State Police North Carolina State Highway Patrol San Bernardino County (CA) Sheriff Orange County (CA) Sheriff - Coroner Michigan State Police Atlanta (GA) Police Charlotte - Mecklenburg (NC) Police Port Authority of New York & New Jersey Police Jacksonville (FL) Sheriff Broward County (FL) Sheriff Cleveland (OH) Police Florida Highway Patrol Indianapolis (IN) Metropolitan Police Prince George’s County (MD) Police Ohio State Highway Patrol Memphis (TN) Police Denver (CO) Police 14 Full-time sworn personnel 36,023 13,354 9,727 9,461 7,202 6,624 5,655 5,053 4,847 4,458 3,742 3,529 3,389 3,388 3,093 3,053 2,990 2,942 2,732 2,622 2,558 2,310 2,250 2,181 2,147 2,105 2,020 1,987 1,951 1,940 1,934 1,910 1,886 1,873 1,827 1,797 1,794 1,732 1,719 1,672 1,667 1,662 1,624 1,616 1,606 1,582 1,578 1,560 1,549 1,525 C e n s u s o f S tat e a n d Lo c a l L aw E n f o r c e m e n t A g e n c i e s , 2008 Appendix Table 6 State and local law enforcement agencies and full-time employees, by state, 2008 State U.S. Total Alabama Alaska Arizona Arkansas California Colorado Connecticut Delaware District of Columbia Florida Georgia Hawaii Idaho Illinois Indiana Iowa Kansas Kentucky Louisiana Maine Maryland Massachusetts Michigan Minnesota Mississippi Missouri Montana Nebraska Nevada New Hampshire New Jersey New Mexico New York North Carolina North Dakota Ohio Oklahoma Oregon Pennsylvania Rhode Island South Carolina South Dakota Tennessee Texas Utah Vermont Virginia Washington West Virginia Wisconsin Wyoming Number of agencies 17,985 417 50 141 367 509 246 143 49 4 387 628 7 117 877 482 392 371 389 348 146 142 357 571 448 342 576 119 225 76 208 550 146 514 504 114 831 481 174 1,117 48 272 155 375 1,913 136 69 340 260 233 529 90 Total personnel Number Per 100,000 residents 1,133,915 373 18,364 393 2,107 306 26,112 402 11,165 389 126,538 346 17,989 365 10,530 301 3,110 355 5,383 912 81,312 441 38,926 401 4,097 318 5,290 346 52,838 411 19,940 312 8,896 297 11,232 402 10,412 243 25,311 569 3,901 296 21,267 376 25,361 388 26,395 264 15,458 296 12,408 422 22,484 377 3,229 334 5,227 293 10,097 386 3,940 298 43,569 503 7,164 361 95,105 489 35,140 380 1,859 290 37,295 324 13,151 361 9,431 249 33,670 268 3,462 329 16,111 358 2,669 332 25,697 412 96,116 395 8,237 302 1,612 260 29,155 374 17,602 268 4,411 243 20,150 358 2,990 561 Sworn personnel Number Per 100,000 residents 765,246 251 11,631 249 1,298 189 14,591 224 6,779 236 79,431 217 12,069 245 8,281 236 2,131 243 4,262 722 46,105 250 26,551 274 3,234 251 3,146 206 41,277 321 13,171 206 5,830 195 7,450 266 7,833 183 18,050 405 2,569 195 16,013 283 18,342 280 19,009 190 9,667 185 7,707 262 14,554 244 1,950 201 3,765 211 6,643 254 2,936 222 33,704 389 5,010 252 66,472 341 23,442 254 1,324 206 25,992 225 8,639 237 6,695 177 27,413 218 2,828 268 11,674 259 1,636 203 15,976 256 59,219 244 4,782 175 1,103 178 22,848 293 11,411 174 3,382 186 13,730 244 1,691 317 Note: Excludes agencies employing less than one full-time officer or the equivalent in part-time officers. J u ly 2011 15 Appendix Table 7 Local police departments and full-time employees, by state, 2008 States U.S. Total Alabama Alaska Arizona Arkansas California Colorado Connecticut Delaware District of Columbia Florida Georgia Hawaii Idaho Illinois Indiana Iowa Kansas Kentucky Louisiana Maine Maryland Massachusetts Michigan Minnesota Mississippi Missouri Montana Nebraska Nevada New Hampshire New Jersey New Mexico New York North Carolina North Dakota Ohio Oklahoma Oregon Pennsylvania Rhode Island South Carolina South Dakota Tennessee Texas Utah Vermont Virginia Washington West Virginia Wisconsin Wyoming Number of agencies 12,501 309 42 96 252 341 165 120 36 1 270 366 4 71 701 361 284 230 243 250 117 86 314 455 346 220 430 54 123 38 187 476 89 391 350 54 678 354 129 965 39 184 80 251 788 90 50 171 204 159 429 58 Number 593,013 9,652 1,262 14,998 5,101 55,900 9,221 8,094 1,413 4,647 31,563 16,238 3,604 1,952 33,743 9,432 3,956 5,400 5,571 7,824 2,011 12,590 16,530 13,515 7,291 5,322 12,766 1,024 2,603 6,885 2,941 26,801 4,143 72,380 15,197 773 20,755 7,086 4,848 21,691 2,783 6,153 1,194 10,986 45,550 3,482 746 13,808 8,767 1,662 10,149 1,010 Total personnel Per 100,000 residents 195 206 183 231 178 153 187 231 161 788 171 167 280 128 263 148 132 193 130 176 152 222 253 135 139 181 214 106 146 263 222 309 209 372 164 121 180 194 128 173 264 137 148 176 187 128 120 177 134 92 180 190 Number 461,063 7,314 793 10,518 3,924 39,692 6,881 6,668 1,188 3,742 22,506 12,947 2,807 1,498 28,358 7,881 3,284 4,191 4,713 6,318 1,592 10,494 13,703 11,408 5,947 3,960 9,810 802 2,111 4,497 2,322 21,875 2,882 54,145 11,933 629 16,944 5,538 3,640 19,122 2,258 4,934 900 8,620 34,610 2,653 587 10,947 6,635 1,427 8,171 744 Sworn personnel Per 100,000 residents 151 156 115 162 137 109 139 190 136 634 122 134 218 98 221 123 110 150 110 142 121 185 209 114 114 135 165 83 118 172 176 252 145 278 129 98 147 152 96 152 214 110 112 138 142 97 95 140 101 79 145 140 Note: Excludes agencies employing less than one full-time officer or the equivalent in part-time officers. 16 C e n s u s o f S tat e a n d Lo c a l L aw E n f o r c e m e n t A g e n c i e s , 2008 Appendix Table 8 Fifty largest local police departments, by number of full-time sworn personnel, September 2008 City/county New York (NY) Chicago (IL) Los Angeles (CA) Philadelphia (PA) Houston (TX) Washington (DC) Dallas (TX) Phoenix (AZ) Miami-Dade Co. (FL) Baltimore (MD) Las Vegas-Clark Co. (NV) Nassau Co. (NY) Suffolk Co. (NY) Detroit (MI) Boston (MA) San Antonio (TX) Milwaukee (WI) San Diego (CA) San Francisco (CA) Honolulu Co. (HI) Baltimore Co. (MD) Columbus (OH) Atlanta (GA) Charlotte-Mecklenburg Co.(NC) Jacksonville-Duval Co. (FL) Cleveland (OH) Indianapolis-Marion Co. (IN) Prince George’s Co. (MD) Memphis (TN) Denver (CO) Austin (TX) Fort Worth (TX) New Orleans (LA) Kansas City (MO) Fairfax Co. (VA) San Jose (CA) St. Louis (MO) Nashville-Davidson Co. (TN) Newark (NJ) Seattle (WA) Montgomery Co. (MD) Louisville-Jefferson Co. (KY) El Paso (TX) Miami (FL) Cincinnati (OH) DeKalb Co. (GA) Oklahoma City (OK) Tucson (AZ) Albuquerque (NM) Tampa (FL) Total 36,023 13,354 9,727 6,624 5,053 3,742 3,389 3,388 3,093 2,990 2,942 2,732 2,622 2,250 2,181 2,020 1,987 1,951 1,940 1,934 1,910 1,886 1,719 1,672 1,662 1,616 1,582 1,578 1,549 1,525 1,515 1,489 1,425 1,421 1,419 1,382 1,351 1,315 1,310 1,283 1,206 1,197 1,132 1,104 1,082 1,074 1,046 1,032 1,020 980 Full-time sworn personnel, 2008 Percent change since 2004 Per 100,000 residents -0.3% 432 1.7 472 6.9 256 -3.0 430 -0.8 226 -1.5 634 15.5 265 18.5 216 -268 -5.4 469 10.0 216 6.1 256 -2.6 194 -35.9 247 11.2 343 -1.7 150 2.1 329 -7.2 149 -10.5 240 7.7 214 6.2 242 6.1 248 4.6 320 12.7 220 2.8 205 3.6 372 -3.4 195 17.4 248 -23.2 229 8.5 257 11.2 197 14.0 211 -13.4 423 9.5 296 4.5 144 3.0 146 -3.5 379 8.5 216 0.8 472 2.8 213 15.2 129 1.6 188 1.7 186 4.4 256 3.2 325 13.1 168 1.7 190 7.4 191 7.3 195 2.0 288 Percent change since 2004 -2.4% 2.4 6.7 -4.7 -8.7 -3.2 11.4 7.5 12.0 -4.9 0.5 5.5 -3.8 -35.1 6.1 -9.7 1.6 -9.4 -14.3 6.7 5.0 2.9 -8.7 1.9 -1.5 8.8 -5.1 31.1 -22.6 2.2 1.0 -2.5 18.8 4.6 2.2 -2.2 -5.1 2.4 0.5 -2.6 11.5 -0.6 -2.7 -8.2 2.8 10.0 -2.9 2.7 -0.3 -3.8 --Change was -0.03%. J u ly 2011 17 Appendix Table 9 Sheriffs’ offices and full-time employees, by state, 2008 States U.S. Total Alabama Alaska Arizona Arkansas California Colorado Connecticut Delaware District of Columbia Florida Georgia Hawaii Idaho Illinois Indiana Iowa Kansas Kentucky Louisiana Maine Maryland Massachusetts Michigan Minnesota Mississippi Missouri Montana Nebraska Nevada New Hampshire New Jersey New Mexico New York North Carolina North Dakota Ohio Oklahoma Oregon Pennsylvania Rhode Island South Carolina South Dakota Tennessee Texas Utah Vermont Virginia Washington West Virginia Wisconsin Wyoming Number of agencies 3,063 67 0 15 75 58 62 0 1 0 65 159 0 44 102 92 99 104 120 65 16 24 11 83 87 82 114 55 93 16 10 21 33 57 100 53 88 77 36 65 0 46 66 94 254 29 14 122 39 55 72 23 Total personnel Number Per 100,000 residents 353,461 116 5,696 122 0 0 7,703 119 3,637 127 51,883 142 6,615 134 0 0 22 3 0 0 41,614 226 17,225 178 0 0 2,753 180 13,670 106 7,487 117 3,503 117 3,900 139 2,152 50 14,484 325 1,018 77 3,451 61 4,937 75 8,724 87 6,304 121 4,336 147 4,841 81 1,515 157 1,762 99 1,594 61 244 18 5,090 59 1,468 74 11,671 60 14,527 157 706 110 11,372 99 3,421 94 3,422 90 1,946 15 0 0 6,950 154 845 105 10,696 171 29,225 120 3,636 133 179 29 10,447 134 5,742 87 1,397 77 8,289 147 1,362 256 Sworn personnel Number Per 100,000 residents 182,979 60 2,631 56 0 0 2,253 35 1,577 55 27,707 76 3,727 76 0 0 8 1 0 0 18,167 99 10,026 103 0 0 1,275 83 9,173 71 3,184 50 1,523 51 2,111 75 1,657 39 9,568 215 343 26 2,166 38 1,475 23 4,909 49 2,625 50 1,948 66 2,873 48 712 74 1,024 57 1,061 41 127 10 3,908 45 1,122 56 4,021 21 7,701 83 437 68 5,748 50 1,439 39 2,306 61 1,593 13 0 0 4,457 99 428 53 5,071 81 12,340 51 1,283 47 126 20 8,412 108 2,987 45 1,016 56 4,163 74 571 107 Note: Excludes agencies employing less than one full-time officer or the equivalent in part-time officers. 18 C e n s u s o f S tat e a n d Lo c a l L aw E n f o r c e m e n t A g e n c i e s , 2008 Appendix Table 10 Fifty largest sheriffs’ offices, by number of full-time sworn personnel, 2008 Agency Los Angeles County (CA) Sheriff Cook County (IL) Sheriff Harris County (TX) Sheriff Riverside County (CA) Sheriff San Bernardino County (CA) Sheriff Orange County (CA) Sheriff - Coroner Broward County (FL) Sheriff Palm Beach County (FL) Sheriff Sacramento County (CA) Sheriff Orange County (FL) Sheriff San Diego County (CA) Sheriff Hillsborough County (FL) Sherif Wayne County (MI) Sheriffa Alameda County (CA) Sheriff Pinellas County (FL) Sheriff San Francisco (CA) Sheriff Jefferson Parish (LA) Sheriff Oakland County (MI) Sheriff Maricopa County (AZ) Sheriffa Ventura County (CA) Sheriff Marion County (IN) Sheriff King County (WA) Sheriffa Contra Costa County (CA) Sheriff Collier County (FL) Sheriff Lee County (FL) Sheriff Polk County (FL) Sheriff Calcasieu Parish (LA) Sheriff Jefferson County (AL) Sheriff Pima County (AZ) Sheriff Jefferson County (CO) Sheriff Gwinnett County (GA) Sheriff Passaic County (NJ) Sheriff Bexar County (TX) Sheriff Milwaukee County (WI) Sheriff Fulton County (GA) Sheriff Shelby County (TN) Sheriff Tulare (CA) County Sheriff Kern County (CA) Sheriff Richland County (SC) Sheriff Orleans Parish (CA) Sheriff (Criminal) Fairfax County (VA) Sheriff Brevard County (FL) Sheriff Johnson County (KS) Sheriff Monmouth County (NJ) Sheriff Pasco County (FL) Sheriff Manatee County (FL) Sheriff Fresno County (CA) Sheriff Knox County (TN) Sheriffa Franklin County (OH) Sheriff El Paso County (CO) Sheriff Dane County (WI) Sheriff Full-time sworn personnel, 2008 Percent assigned to Total respond to calls for service 9,461 31% 5,655 4 2,558 25 2,147 72 1,797 56 1,794 22 1,624 97 1,447 38 1,409 23 1,398 45 1,322 43 1,223 63 1,062 23 928 19 863 42 838 0 825 68 796 37 766 84 755 55 740 0 721 66 679 31 628 39 621 54 600 71 592 31 556 81 554 67 537 30 531 14 530 21 526 38 524 19 516 0 516 30 513 25 512 50 512 41 505 9 499 0 497 70 496 16 494 0 485 46 476 62 461 43 456 58 455 23 454 26 454 22 Primary duty areas of by sworn personnel Law Jail Court enforcement operations operations Other x x x x x x x x x x x x x x x x x x x x x x x x x x x x x x x x x x x x x x x x x x x x x x x x x x x x x x x x x x x x x x x x x x x x x x x x x x x x x x x x x x x x x x x x x x x x x x x x x x x x x x x x x x x x x x x x x x x x x x x x x x x x x x x x x x x x x x x x x x x x x x x x x x x x x x x x x x x x x x x aPercent responding to calls is based on the 2004 Census of State and Local Law Enforcement Agencies. J u ly 2011 19 U.S. Department of Justice Office of Justice Programs Bureau of Justice Statistics ncj233982 Washington, DC 20531 PRESORTED STANDARD POSTAGE & FEES PAID DOJ/BJS Permit No. G-91 Official Business Penalty for Private Use $300 Office of Justice Programs • Innovation • Partnerships • Safer Neighborhoods • http://www.ojp.gov The Bureau of Justice Statistics is the statistical agency of the U.S. Department of Justice. James P. Lynch is the director. This report was written by Brian Reaves. Andrea Burch provided statistical review and verification of the report. Catherine Bird and Jill Thomas edited the report, Barbara Quinn produced the report, and Jayne Robinson prepared the report for final printing under the supervision of Doris J. James. July 2011, NCJ 233982 This report in PDF and in ASCII and its related statistical data and tables are available on the BJS website at: http://www.bjs.gov/index. cfm?ty=pbdetail&iid=2216.