
The Changing State of Recidivism: Fewer People Going Back to Prison, PEW Research Center, 2018
Download original document:
Document text
Document text
This text is machine-read, and may contain errors. Check the original document to verify accuracy.
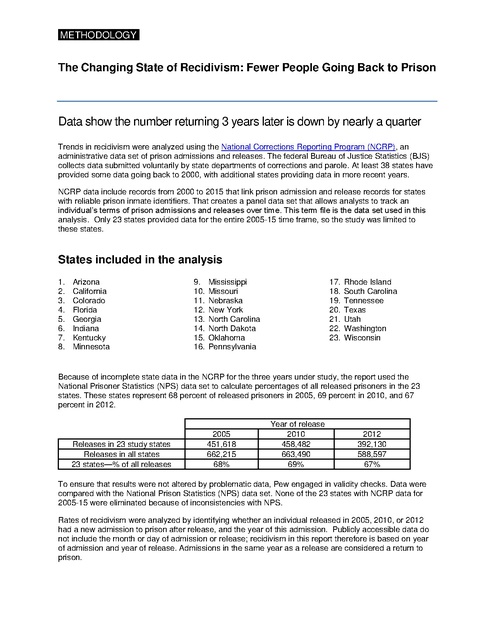
METHODOLOGYI

The Changing State of Recidivism: Fewer People Going Back to Prison

Data show the number returning 3 years later is down by nearly a quarter
Trends in recidivism were analyzed using the National Corrections Reporting Program (NCRP), an
administrative data set of prison admissions and releases. The federal Bureau of Justice Statistics (BJS)
collects data submitted voluntarily by state departments of corrections and parole. At least 38 states have
provided some data going back to 2000, with additional states providing data in more recent years.
NCRP data include records from 2000 to 2015 that link prison admission and release records for states
with reliable prison inmate identifiers. That creates a panel data set that allows analysts to track an
individual’s terms of prison admissions and releases over time. This term file is the data set used in this
analysis. Only 23 states provided data for the entire 2005-15 time frame, so the study was limited to
these states.

States included in the analysis
1.
2.
3.
4.
5.
6.
7.
8.

Arizona
California
Colorado
Florida
Georgia
Indiana
Kentucky
Minnesota

9.
10.
11.
12.
13.
14.
15.
16.

Mississippi
Missouri
Nebraska
New York
North Carolina
North Dakota
Oklahoma
Pennsylvania

17.
18.
19.
20.
21.
22.
23.

Rhode Island
South Carolina
Tennessee
Texas
Utah
Washington
Wisconsin

Because of incomplete state data in the NCRP for the three years under study, the report used the
National Prisoner Statistics (NPS) data set to calculate percentages of all released prisoners in the 23
states. These states represent 68 percent of released prisoners in 2005, 69 percent in 2010, and 67
percent in 2012.

Releases in 23 study states
Releases in all states
23 states—% of all releases

2005
451,618
662,215
68%

Year of release
2010
458,482
663,490
69%

2012
392,130
588,597
67%

To ensure that results were not altered by problematic data, Pew engaged in validity checks. Data were
compared with the National Prison Statistics (NPS) data set. None of the 23 states with NCRP data for
2005-15 were eliminated because of inconsistencies with NPS.
Rates of recidivism were analyzed by identifying whether an individual released in 2005, 2010, or 2012
had a new admission to prison after release, and the year of this admission. Publicly accessible data do
not include the month or day of admission or release; recidivism in this report therefore is based on year
of admission and year of release. Admissions in the same year as a release are considered a return to
prison.

METHODOLOGYI

Differences between the Pew and BJS recidivism studies
In the past, BJS has included data on returns to prison in its reports on recidivism of people released in
1994 and 2005. The 2018 report on the 2005 cohort, however, includes only rearrests. For its report, BJS
used a sample of approximately 70,000 prisoners (out of over 400,000) released from 30 states that were
chosen because their departments of corrections could provide the fingerprint-based identification
numbers needed to link the criminal history records to released prisoners. Pew does not have access to
individual-level FBI criminal history records and therefore is unable to collect information on rearrests.
The BJS study includes only those sentenced to one year or more, whereas Pew has included all
released prisoners in each year. Also, NCRP does not capture data on individuals who were released
from prison in one state and who may have been incarcerated subsequently in another state. BJS’ access
to additional data sources allowed its report to include out-of-state reincarceration data. Additionally, BJS
removes from its study individuals who have died, which is information that Pew cannot access.
For calculating date of return to prison, Pew used the year of new admission. In the 2014 BJS report on
the 2005 cohort, recidivism was calculated based on the date of arrest that led to reincarceration —
generally a longer time frame, given the time necessary to adjudicate cases. The BJS study reports the
following reincarceration rates:
Recidivism of Prisoners Released in 30 States in 2005: Patterns From 2005 to 2010 (BJS, 2014)
Time from release to arrest
leading to return to prison
Return to prison rate

12 mos.
30.4%

24 mos.
43.3%

36 mos.
49.7%

48 mos.
52.9%

60 mos.
55.1%

As this table shows, there were only small differences in Pew’s and BJS’ return-to-prison recidivism
numbers for the 2005 cohort resulting from these differences of measurement.

Understanding the recidivism decline
Determining causal relationships to explain the drop in recidivism rates was outside the scope of this
analysis. However, Pew wanted to investigate the extent to which differences unrelated to changes in postrelease practices could account for differences in rates of return. This might include differences in the
individual characteristics of prisoners, changes in sentence length of those released, or the relative number
of releases from each state. Pew used a regression model to control for race, gender, original sentence
length, original offense, age at release, and the state with jurisdiction. This analysis showed that being
released in 2012, compared with being released in 2005, is associated with a .42 reduction in the log odds
of being readmitted to prison by the end of the third year, holding all those variables constant. This can be
roughly translated to a 10.5 percentage point reduction in the probability of returning to prison after
controlling for these variables, compared with an 11.5 percentage point reduction without these controls.

METHODOLOGYI
Figure 1

Small Differences in Prisoner Characteristics for Those Released in 2005
and 2012
Offense category, gender, and age for those released in respective years
Selected characteristics of prisoners released from 23
states in 2005 and 2012
Original offense

Violent
Property
Drugs
Public order

Percentage of group
Released
Released
in 2005
in 2012
22.6%
25.6%
30.4%
29.6%
30.9%
26.6%
14.2%
17.1%

Difference
3.0%
-0.8%
-4.3%
2.9%

Other/unspecified/missing
1.9%
1.2%
-0.8%
Gender
Male
88.2%
87.9%
-0.4%
Female
11.8%
12.2%
0.4%
Age at release year
18-34
52.8%
53.2%
0.4%
35-54
44.0%
41.0%
-3.0%
55+
3.2%
5.8%
2.6%
Source: National Corrections Reporting Program, 1991-2015: Selected Variables, DS1 Term Records
Note: Differences were calculated from the raw, unrounded figures.