
Does Prison Harden Inmates? - Study on Effects of Confinement, Chen Shapiro, 2005
Download original document:
Document text
Document text
This text is machine-read, and may contain errors. Check the original document to verify accuracy.
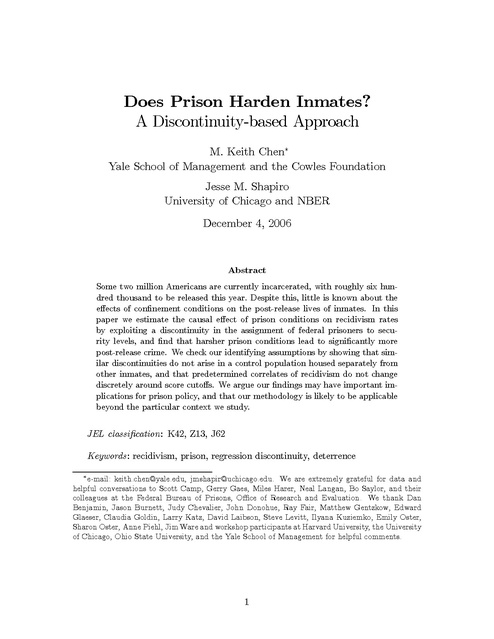
Does Prison Harden Inmates?
A Discontinuity-based Approach
M. Keith Chen∗
Yale School of Management and the Cowles Foundation
Jesse M. Shapiro
University of Chicago and NBER
December 4, 2006

Abstract
Some two million Americans are currently incarcerated, with roughly six hundred thousand to be released this year. Despite this, little is known about the
effects of confinement conditions on the post-release lives of inmates. In this
paper we estimate the causal effect of prison conditions on recidivism rates
by exploiting a discontinuity in the assignment of federal prisoners to security levels, and find that harsher prison conditions lead to significantly more
post-release crime. We check our identifying assumptions by showing that similar discontinuities do not arise in a control population housed separately from
other inmates, and that predetermined correlates of recidivism do not change
discretely around score cutoffs. We argue our findings may have important implications for prison policy, and that our methodology is likely to be applicable
beyond the particular context we study.

JEL classification: K42, Z13, J62
Keywords: recidivism, prison, regression discontinuity, deterrence
∗

e-mail: keith.chen@yale.edu, jmshapir@uchicago.edu. We are extremely grateful for data and
helpful conversations to Scott Camp, Gerry Gaes, Miles Harer, Neal Langan, Bo Saylor, and their
colleagues at the Federal Bureau of Prisons, Office of Research and Evaluation. We thank Dan
Benjamin, Jason Burnett, Judy Chevalier, John Donohue, Ray Fair, Matthew Gentzkow, Edward
Glaeser, Claudia Goldin, Larry Katz, David Laibson, Steve Levitt, Ilyana Kuziemko, Emily Oster,
Sharon Oster, Anne Piehl, Jim Ware and workshop participants at Harvard University, the University
of Chicago, Ohio State University, and the Yale School of Management for helpful comments.

1

America’s jails and prisons house roughly two million inmates (Bureau of Justice Statistics, 2002), nearly twice as many as in 1990 and more in per capita terms
than any other OECD country (OECD, 2001). Current and former prisoners constitute an increasingly large share of the U.S. population, yet little is known about
the effects that imprisonment and prison conditions have on the subsequent lives of
inmates.1 This omission is unfortunate: each year roughly six-hundred thousand people are released from incarceration (Bureau of Justice Statistics, 2002), and roughly
two-thirds of those released will be rearrested within three years (Langan and Levin,
2002). Crimes by former inmates alone thus account for a substantial share of current
and future crime. Moreover, unlike many determinants of crime, prison conditions
are directly under the control of policymakers and the criminal justice system. Understanding the effect of confinement on post-release criminal activity is therefore
essential to effective crime-control policy.2
Theory alone cannot tell us whether an increase in the severity of prison conditions
will increase or decrease the propensity of inmates to commit crimes after release.
Models of “specific deterrence” (Smith and Gartin, 1989), which posit that criminals
learn from their own experiences about the severity of penalties, predict that harsher
conditions will decrease the propensity to recidivate. Alternatively, if harsher prison
conditions correspond to inferior labor market outcomes (as suggested by Western,
Kling, and Weiman, 2001), or if prison life induces a taste for violence (Banister,
Smith, Heskin and Bolston, 1973), then harsher conditions may lead to more crime
following release. More generally, a growing literature on social interactions highlights
the influence of peer effects on criminal behavior (Glaeser, Sacerdote and Scheinkman,
1996; Bayer, Pintoff, and Pozen, 2003). During incarceration, inmates may acquire
skills, learn of new prospects, or develop criminal contacts.
1

A notable exception is Bayer, Pintoff, and Pozen (2003), which focuses on the effects of social
interactions among juvenile on subsequent criminal behavior. Camp and Gaes (2003) study the
effects of prison conditions on in-prison misconduct.
2
For example, the literature on prison privatization has recently focused much of its attention
on whether private prisons are likely to provide lower quality services than publicly managed prisons (Hart, Shleifer, and Vishny 1997; Camp and Gaes, 2001). If prison conditions affect rates of
post-release crime commission, then providing quality-based incentives to private prison managers
becomes an even higher priority.

2

In this paper we exploit a feature of the federal inmate classification system to estimate the effect of moving a prisoner to a higher security level. Prior to incarceration,
every federal inmate is assigned a score intended to reflect his need for supervision.
An inmate is then assigned to a prison security level depending on where his score
falls relative to certain predetermined cutoff values. By comparing inmates on either
side of the boundaries between different security levels, we estimate the effect on
recidivism of being assigned to a higher security level. Since both the physical and
social conditions of confinement vary dramatically with security level, this setting provides a quasi-experiment for identifying the effect of prison conditions on post-release
outcomes.
Our approach avoids the obvious confounds inherent in simply comparing rearrest
rates of prisoners in different security levels. Even with controls for demographics,
such an estimation strategy would ignore the fact that prisoners are assigned to
security levels based on characteristics such as crime severity that are themselves
likely to predict recidivism. By taking careful account of the assignment mechanism,
we can avoid bias introduced by the endogeneity of security level.
We find that moving a prisoner over a cutoff that increases his assigned security
level from minimum to low security roughly doubles his hazard rate of rearrest in
a three-year follow-up window. We check our identifying assumptions by showing
that similar discontinuities do not arise in a control population housed separately
from other inmates, and that predetermined correlates of recidivism do not change
discretely around score cutoffs. Although our conclusions are somewhat limited due
to small sample sizes, in general they are difficult to reconcile with models in which
“specific deterrence” or in-prison rehabilitation play a central role, and seem more
consistent with models of social interactions or psychological effects of incarceration.
This paper makes several contributions relative to the existing literature. Whereas
most economic analyses of policy influences on crime focus on the deterrence or incentive effects of punishments (Levitt, 1998) or prison conditions (Katz, Levitt, and
Shustorovich, 2003), we show that the conditions of incarceration may have a substantial influence on post-release criminal behavior. Our finding that harsher impris3

onment conditions cause greater recidivism stands in contrast to prior evidence of a
specific deterrence effect (Sherman and Berk, 1984), in which punishing a criminal
more severely reduces that individual’s subsequent probability of recidivism.
Methodologically, the paper brings regression-discontinuity analysis (Campbell
and Stanley, 1963; Rubin, 1977) to the study of post-release crime. In the prior
work most closely related to our own, Berk and De Leeuw (1999) use a regressiondiscontinuity design to evaluate the impact of confinement conditions on in-prison
misconduct, but not on post-release criminal activity. Moreover, although our research uses data from the federal corrections system, many state systems also employ
scoring methods to assign inmates to confinement conditions. Our approach may
therefore have wider applicability beyond the context we study.3 In addition, though
we focus primarily on the impact of prison conditions on post-release crime, a similar
methodology could be employed to study effects on labor-market attachment, family
structure, and other post-release outcomes, all of which might respond significantly
to the conditions of confinement.
Our paper also contributes to a growing economic literature on the importance of
peer effects in general (Sacerdote, 2001), and on the role of peer effects in criminal
behavior in particular (Glaeser, Sacerdote, and Scheinkman, 1996). Unlike Bayer,
Pintoff, and Pozen (2003), we do not attempt to directly measure the effects of changes
in peer group composition on prisoner outcomes. However, the composition of a
prisoner’s fellow inmates varies dramatically with the prisoner’s security level, and is
therefore likely to form part of the effect of security level on post-release recidivism.
Finally, our estimates suggest that the impact of prison conditions on recidivism
is an important factor in designing effective prison systems. As we discuss in section
3, the effect of harsher conditions on recidivism must be weighed against their deterrent effect in order to determine whether more or less harsh conditions are optimal
from a crime-control perspective. However, our point estimates are relatively large
compared to existing estimates of deterrence effects, suggesting significant gains from
3

Indeed, since the first version of our paper was circulated, at least two studies have used
discontinuity-based designs to evaluate the effects of incarceration (Pintoff, 2005) and sentence length
(Kuziemko, 2006) on recidivism.

4

incorporating recidivism effects into policy analysis.
The remainder of the paper is organized as follows. Section 1 discusses the relationship between security level and conditions of confinement and describes the
dataset. Section 2 presents our findings as well as some checks on the plausibility of
our identifying assumptions. Section 3 discusses policy implications of our findings.
Section 4 concludes.

1

Background and Data Description

1.1

Inmate Classification and Security Level

Upon entry to the federal prison system, an inmate is processed using an Inmate
Load and Security Designation Form (see Figure 1). The Security Designation Data
recorded on this form are used to produce the individual’s security custody score.4
In the construction of this score, each of seven items contributes points to an overall
sum. For example, offenses are grouped into five categories, from lowest severity (such
as “counterfeiting, under $2000”) to greatest severity (such as homicide), and each
inmate receives an associated offense severity score ranging from 0 (least severe) to 7
(most severe). The scoring is done by a Regional Designator at the Bureau of Prisons,
and follows a procedure laid out in detail in the Bureau of Prisons Security Designation
and Custody Classification Manual (Federal Bureau of Prisons, 1982). Important for
our identifying assumption is that no aspect of the score requires the Designator to
exercise any personal judgment; all crimes, sentences, and judicial recommendations
translate directly into a unique scoring. In the Appendix we discuss in detail how
the components of the score are determined, and Appendix Table 1 summarizes how
those components sum to the overall score.
Once the score has been computed, it is compared to a set of cutoff values (see
Appendix Table 2) to determine an inmate’s security level. Once a security level has
4

The score is intended to predict prisoner misconduct and therefore to measure the supervision
needs of individuals. Over time, the score has been refined through continuing research into the
predictors of prisoner misconduct (Harer and Langan, 2001).

5

been assigned to an inmate, a BOP employee assigns the inmate to an initial facility
based primarily on location and on the availability of space.5 In some cases security
level can change during the incarceration period at the discretion of a Bureau of
Prisons (BOP) official, for example because of inmate misconduct. As such changes
are endogenous, we will focus on security level upon entry to the federal prison system.
Some considerations may intervene to break the link between score and security
level. For example, deportable aliens may not be housed in minimum security, nor
can those who have been convicted of threats to government officials.6 Such issues
are recorded on the security designation form as public safety factors, and most have
the effect of excluding an inmate from minimum security. Note, however, that our
identification strategy does not use the variation in security level created by these exceptions. Rather, we will identify the effects of security level using the discontinuities
in the relationship between score and recidivism that occur at the cutoff values.
An inmate’s assigned security level has an enormous impact on his experiences
in prison. As Appendix Table 1 details, prisoners convicted of more severe offenses,
prisoners with more serious prior records, and prisoners with histories of violence are
all, by design, more likely to be placed in more secure facilities. Thus comparing
prisoners in different security levels one would find that those housed in more secure
facilities are exposed to more violent individuals with more serious criminal histories.
Given the growing literature on peer effects and the intensity of contact co-housed
prisoners experience, this alone would suggest large security-level effects on postprison characteristics.
Very few anthropological or ethnographic studies compare facilities with different
security levels.7 Moreover, the dataset we use in this paper does not contain much
detail about the in-prison experiences of the inmates. However, a different dataset,
the Survey of Inmates of Federal Correctional Facilities (U.S. Department of Justice,
5
Inmates who suffer from chronic medical conditions are also assigned scores, but are housed
separately in a prison medical facility. We will use this subsample as a control group to check the
plausibility of our identifying assumptions.
6
Other such considerations include medical and mental health, aggressive sexual behavior, offense
severity, organized crime, and gang membership.
7
Accounts of life in prison typically focus on one institution, usually maximum security (Sykes,
1958; Conover, 2001).

6

1991) contains data on inmate demographics, criminal histories, experiences in prison,
and self-reported conditions of confinement for a nationally representative sample of
federal inmates.8
Table 1 presents some simple comparisons across security levels, both in selfreported conditions of confinement and in-prison misconduct. The data strongly
confirm the intuition that more secure facilities allow less contact with the community
and less freedom of movement. While 14% of minimum security inmates report having
been allowed furloughs during their current period of confinement, only 2.5% of low
security inmates have had furloughs; for maximum security inmates the figure is
below 1%. Similar trends show up in the percent of respondents who have been
seriously injured during confinement. Moving from minimum to low security exposes
an additional 2.7% to serious injury; moving from low to medium or medium to
maximum increases the rate of injury by 1.2 and 1.8 percentage points, respectively.
On the whole then, the available evidence strongly suggests that conditions of
imprisonment differ dramatically by security level. Higher security prisons involve
less contact with the outside world, allow less freedom, and subject inmates to far
more violence.

1.2

Data

Our data are a representative sample of 1,205 inmates released from federal prisons in
the first six months of 1987 (Harer, 1994). Data on demographic characteristics and
criminal histories were recorded for all inmates in the sample, as were the inmates’
security custody scores and security levels on entry to the system, when available.9
Following release, the FBI provided records of all re-arrests on either state for federal
charges within a three year window of release. Hence even though all inmates in our
8

While using self-reported data to compare conditions across security levels does raise some
methodological issues, Camp (1999) has found that such surveys do contain information helpful in
making comparisons between facilities.
9
In many cases–usually inmates who entered the system prior to the introduction of modern
computer records–data from the initial classification form was not available. In these cases score
and security level were recorded from the earliest available reclassification form. The components of
the score are unlikely to change during confinement, and conditional on time of entry, we find that
our conclusions are quite similar (and statistically indistinguishable) across the two groups.

7

sample were initially incarcerated for federal crimes, we have records of all subsequent
re-arrests within 3 years, even if they took place under state jurisdiction.
Of the original sample of 1,205 inmates, security level data are missing for 16, and
11 served short sentences in halfway houses that do not have a security designation.
Another 216 were placed in administrative facilities for special medical needs; we will
later use this sub-sample as a control group in our analysis. Finally, 12 inmates have
missing data on score and 2 have miscoded rearrest dates (with rearrest occurring
prior to release), leaving a total sample of 948 with usable data.
Table 2 presents summary statistics for this group. Over half of all of inmates
were rearrested within three years of release, a level comparable to most state-level
studies of recidivism (Camp and Camp, 1997). Other sample characteristics are
less surprising: relative to the U.S. population, the sample contains more males,
fewer whites, fewer high school graduates, and more previously convicted offenders.
Grouping by security level, Table 2 also demonstrates the large changes in these
characteristics across levels. For example, the percent of convicts rearrested within 3
years is 38% in minimum security, but jumps to 55% for low security, and is 60% for
all levels higher then low. In these level statistics the most dramatic changes occur
when leaving minimum security, leading us to suspect that our strongest results will
come from this break.
A crucial requirement for our analysis is that security level vary discontinuously
with score. As Figure 2 demonstrates, the data confirm what policy implies: the
probability of being placed in low rather than minimum security jumps discretely
when the score passes the official cutoff of 6. Similar jumps are visible at each cutoff
(see Appendix Table 3).

2

Results

Given how drastically prison conditions vary across security levels, it is plausible that
the type of an inmate’s prison greatly affects his post-prison outcomes. To test this
we exploit the fact that the assignment process outlined in Section 1 exhibits dis8

continuities at several pre-determined cut-off points. Inmates who find themselves at
opposite ends of any of these cutoffs are likely to be ex-ante comparable in all underlying attributes, providing us with a quasi-experimental way of testing the effects of
security level.

2.1

Regression Discontinuity

In a regression-discontinuity design (Campbell and Stanley, 1963; Rubin, 1977; Berk
and De Leeuw, 1999), subjects are assigned a treatment condition based on cutoff
values of a known and measured assignment score. For federal inmates the security
designation score discussed in Section 1.1 serves this purpose.10 By conditioning our
analysis of recidivism on both an inmate’s score (constrained to enter smoothly) and
his resulting security level, we can obtain consistent estimates of the treatment effect
as long as pre-determined inmate characteristics vary smoothly with the security
custody score. In essence then, we argue that within a small interval around a cutoff
the allocation of prisoners to different security levels amounts to a random assignment
procedure. Note that, because we will identify the effects of security level assignment
on recidivism using only variation induced by the cutoffs, our procedure does not
require us to assume that all determinants of recidivism propensity are well proxied
by the security designation score, or that the score is the sole determinant of inmate
placement. Rather, it requires only that unmeasured determinants of recidivism do
not vary discontinuously with the assignment score.
As a first pass at the data, Figure 3 presents one-year rearrest probabilities for
each security custody score from 0 through 9.11 The figure also presents the average
probability of rearrest after one year as predicted by a probit model using prede10
Regression discontinuity is not new to the study of crime. Berk and Rauma (1983) investigate
the effects of transitional aid to prisoners on recidivism, exploiting a California policy which extends
unemployment insurance to prisoners who work a certain number of hours prior to release. Berk
and de Leeuw (1999) also study the California prison system, using a regression discontinuity design
to predict the effects of various assignment procedures on in-prison misconduct. In other contexts,
economists have use regression discontinuity to estimate the effects of financial aid on college enrollment (van der Klaauw 2001), the effect of incumbency on election results (Lee, 2001), and the
effects of class size on school performance (Hoxby, 2000).
11
See Appendix Table 3 for rearrest percentages for a wider range of scores.

9

termined inmate characteristics (age, education, race, gender, and employment and
marital status) as independent variables. As the figure shows, the relationship between actual recidivism and security custody score closely resembles the relationship
between predicted recidivism and score, except around the change between score 6
and score 7. As noted above, inmates with a score of 7 are typically assigned to low
security prisons, whereas inmates with a score of 6 are usually placed in minimum.
The fact that actual recidivism, but not recidivism predicted based on predetermined
characteristics, jumps up at this point is the basis for our approach to estimating the
effect of security level on subsequent criminal behavior. The figure also illustrates a
limitation of our context relative to other areas in which regression discontinuity designs have been employed: since security custody scores take on only a small number
of integer values, there is a limit to how close to the cutoffs we can look. We will attempt to alleviate this concern by testing formally for the presence of discontinuities
in observed and unobserved inmate characteristics around the cutoff values.
In the analysis to follow, we will test formally for a discontinuity at the cutoff
point. We will also show evidence that predetermined correlates of recidivism do
not change discontinuously around the cutoff, suggesting that the discontinuity in
recidivism rates is not a result of unobserved inmate heterogeneity. Although small
samples make our data noisier than would be ideal for such an analysis, we will argue
that the evidence as a whole points to a significant causal impact of security level
placement on post-release recidivism.

2.2

Reduced-form Estimates of the Effect of Score Cutoffs

To analyze the data more formally, we will estimate both a Cox proportional hazard
model of rearrest rates and a probit analysis using as dependent variables the probability of being rearrested after 1, 2, or 3 years following release. Our independent
variables will be polynomial terms in score, demographic controls, and dummies for
the three score cutoffs relevant to our data. Since having a score above a certain cutoff
does not guarantee placement in a higher security level (see Figure 2 and Appendix
Table 3), the results in this section will be reduced-form estimates of the effect of
10

score cutoffs on recidivism. In subsection 2.4 we will present estimates that can be
interpreted more directly as the effect of security level on rearrest.
The Cox proportional hazard model assumes that an underlying hazard rate of
failure is multiplicatively shifted by changes in right-hand-side variables. In our study
the survival time is the time until the prisoner is rearrested, with individuals not rearrested during the follow-up period treated as censored observations. The advantage
of the proportional hazard assumption is that it does not require functional form assumptions about the baseline hazard rate of recidivism. The model we estimate will
treat the hazard rate of rearrest h(t) as given by

h(t) = h0 (t) exp (λg(score) + α1 S6 + α2 S9 + α3 S13 )

(1)

where h0 (t) is the baseline hazard function, g(score) is a fourth order polynomial in
the security custody score,12 and Sn are dummies for score > n. The parameters
αn capture the effects of score cutoffs on the hazard rate of rearrest. The assumption required to identify the causal effect of the score cutoffs Sn is that all omitted
characteristics vary continuously with score.
Column (1) of Table 3 presents our estimates of the proportional hazard model.
The coefficients reported are model parameters, and can be exponentiated to obtain
hazard ratios. The first coefficient implies a statistically significant positive effect of
the first security custody score cutoff on the probability of rearrest, equivalent to an
approximate doubling of the underlying hazard rate. Even at the lowest end of our
confidence interval, exceeding the first score cutoff raises the hazard rate of rearrest by
five percent. While our estimates are not very precise, we reject the hypothesis that
harsher conditions lead to reduced recidivism, suggesting that “specific deterrence” or
rehabilitation are not the dominant forces in this context. Indeed, our point estimates
indicate positive effects on recidivism at higher scores, although our standard errors
do not allow us to reject the null effect for higher cutoffs. Because of this imprecision
we focus primarily on the first cutoff, between scores 6 and 7.
12

We chose a fourth-order polynomial by iteratively adding polynomial terms until the last term
is not statistically significant. Results are similar using a third- or fifth-order polynomial.

11

The proportional hazard model allows us to avoid making assumptions about the
shape of the hazard function over time, but this may also mask interesting heterogeneity in the treatment effect at different time horizons. We therefore supplement
the proportional hazard model with a series of probit models that treat recidivism in
one-, two-, and three-year follow-up windows as dependent variables. In particular,
we estimate models of the form:

P (Rt ) = Φ(βX + λg(score) + α1 S6 + α2 S9 + α3 S13 )

(2)

where Rt is 1 if an inmate has recidivated after t years and 0 if he has not and Φ is
the normal CDF.
Columns (2) through (4) of Table 3 present the results of this analysis. Controlling
for a polynomial in security custody score, there is in general a positive effect of prison
security level on the probability of post-release rearrest. The largest effect of the first
score cutoff occurs in a two-year follow-up window, where placement above a score
of 6 leads to a 25 percentage point increase in the probability of rearrest. This effect
is statistically significant at the five percent level, whereas the effects at one- and
three-year horizons are weaker and only marginally statistically significant. Again,
despite our lack of precision, we find fairly consistent evidence for a positive causal
link between harsh prison conditions and recidivism, and we can definitively reject
negative effects of harsher conditions with any appreciable magnitude.

2.3

Robustness and Specification Checks

The estimates we have presented require that all correlates of recidivism vary continuously with the security custody score. While it is not possible to test this assumption
for all covariates, we can ask whether observed covariates meet this criterion. Table 4
tests for discontinuities in our control variables, estimating probit models that parallel
equation (2) but with demographic characteristics (high school degree status, prior
convictions, marital status, race, and employment) recorded on entry to prison as dependent variables. Only one demographic characteristic has a marginally significant

12

(at the 10 percent level) discontinuity at a score cutoff; the rest show no significant
changes. Thus in general we do not observe significant changes in subject characteristics around our identifying cutoffs. We should note, however, that the confidence
intervals in these models are wide, giving these tests limited power.
Panel A of Table 5 shows estimates of the models from Table 3 with controls for the
demographic variables used in Table 4. We focus on the effect of the first score cutoff
since this is where we have the most data. Column (1) of Panel A shows that including
demographic controls reduce our estimated effect of exceeding the first score cutoff
from a doubling of the relative hazard of rearrest to a 50 percent increase in rearrest
probability. The estimated coefficient in the model with controls is still large, but we
can no longer reject the null hypothesis of no effect. In the probit models reported in
Columns (2) and (3) of Panel A, we also see modest decreases in the point estimates,
although in this case the estimates do remain marginally statistically significant.
Finally, in Column (4) we show that including demographic controls substantially
reduces the estimated effect of score cutoff on three-year recidivism rates, making
this estimate statistically indistinguishable from zero. On the whole, while we are not
able to consistently reject the null hypothesis, the specifications with demographic
controls do still suggest a positive effect of harsh conditions on rearrest probabilities.
Thus far we have only considered whether our results are driven by observed
heterogeneity among inmates. An alternative approach that can also capture the
effects of unmeasured heterogeneity is to examine a population with known scores
that is not housed in accordance with the security guidelines of those scores. Inmates
housed in “administrative” facilities, which are essentially prison hospitals, constitute
just such a population. They are housed apart from the general population and are
therefore not exposed to the variation in conditions of confinement that we discussed
in Section 1. Our dataset contains 211 inmates with known scores who were initially
assigned to administrative facilities. Overall these inmates exhibit similar rates of
recidivism to the general inmate population, and we find that similar demographic
characteristics predict recidivism in both groups. In Panel B of Table 5, we test for a
discontinuity among this group as a “placebo” exercise: if unobserved heterogeneity
13

among inmates were driving our results, then we would be likely to estimate similar
discontinuities for this administrative population.
As Panel B of Table 5 reports, there is no evidence of a discontinuous relationship
between score and recidivism for these inmates. Moving an inmate housed in an
administrative facility from minimum to low security designation in general has an
insignificant negative effect on the probability of rearrest. Small sample sizes mean
that these results are imprecise and should be interpreted with caution; nevertheless,
in one case (two-year rearrest rates) we can reject the equality of the coefficients
for administrative and non-administrative inmates at the 10 percent level.13 While
not conclusive, these findings are at least consistent with the hypothesis that the
discontinuity observed among non-administrative inmates is a results of confinement
conditions and not unobserved heterogeneity that changes discretely around score
cutoffs.
Another potential concern with our estimates is that our sample is representative
of the released population, not the incarcerated population. Although the released
population is of greater interest for many policy questions, it is important to know
whether the effects we identify are weaker for the average inmate than for the average
released inmate. In effect, this amounts to asking how our effects depend on sentence
length, since those with longer sentences are less likely to be released at any given
point in time, and are therefore less likely to enter our sample. Panel C of Table 5
shows the robustness of our results to weighting our estimates by total time in prison,
and thus assigning more importance in the model to inmates who had relatively low
probabilities of entering our sample. In general, the estimated effect of score cutoff
becomes larger and statistically stronger. This suggests that our effects are not limited
to inmates with short prison stays, and if anything may be more important for those
who are incarcerated for longer periods.
As Lee and Card (2006) have pointed out, regression discontinuity estimates suffer from specification error because polynomials can only approximate the smooth
13

In the sample of inmates housed in administrative facilities, there are 17 and 19 inmates at
scores 6 and 7, respectively, suggesting a modest, but not tiny, amount of data available to test for
a discontinuity at this point.

14

functions they are meant to capture. As they note, this type of error can induce
score-level correlation in the error structure that can be addressed using a clustered
standard error. Experiments with specifications using standard errors clustered by
security designation score (not shown) reveal slight decreases in our standard errors;
to be conservative we therefore present estimates with unclustered errors.
A final concern is that our estimates measure the post-prison arrest rate, not
necessarily the crime-commission rate. The claim that harsher prison conditions
increase the commission of crimes rests on the assumption that the probability of
arresting an ex-convict conditional on his having committed a crime does not depend
on his former security level. For example, if upon release a low security inmate
is subject to more frequent drug tests than his minimum security counterpart, our
results may be picking up an increased probability of rearrest that has nothing to
do with increased criminal tendencies. Indeed, Petersilia and Turner (1993) found
using a randomized evaluation that more intensive post-release supervision increase
rates of reincarceration by about 8 percentage points (see also Piehl and LoBuglio,
forthcoming). While we cannot entirely rule out this explanation, we know of no
federal parole policy that specifies a relationship between supervision intensity and
security level of releasing facility, and we note that even the large differences in
supervision intensity studied by Petersilia and Turner (1993) did not produce large
enough effects to explain the majority of the effect we estimate.14 Finally, the effect
of security level on recidivism is visible even if we exclude parole violations from our
sample. Thus, while we cannot completely rule out a bias, it seems unlikely to account
for most of our findings.
14

As additional data on this point, we note that most state parole agencies use standardized risk
assessment tools to map inmates into supervision levels (Jones et al, 1999). None of the instruments
we examined take account of an inmate’s former security level, nor look as if their cutoffs coincide
with those in the security custody score. Furthermore, the variables these systems do take into
account relate primarily to providing the appropriate services (drug users receive drug counselling)
and limiting especially newsworthy crimes (convicted sex offenders are monitored very closely).

15

2.4

Structural Estimates

The results in the previous section show the effect of exceeding score cutoffs on the
probability of rearrest. Because the score cutoffs do not perfectly determine the
security level in which an inmate is housed, the coefficients in Table 3 cannot be
interpreted as estimates of the effect of security level on the probability of rearrest.
To get such an estimate, we need to adjust the coefficients to correct for the imperfect
link between security custody score and security level.
We implement this estimation with a probit model of the following form:
P (Rt ) = Φ (λg(score) + γ 1 (low) + γ 2 (low/medium) + γ 3 (medium))

(3)

where low, low/medium, and medium are dummies for each respective security level
category. Since these dummies are endogenous regressors, we model them as linear
functions of the score cutoffs S6 , S9 , and S13 , which we have argued are exogenous conditional on the score polynomial g (score). Because we have not been able to obtain
reliably convergent maximum likelihood estimates of this model, we will present estimates obtained using the procedure proposed by Newey (1987). (We note that both
point estimates and statistical significance are similar if we use a linear probability
model estimated using two-stage least squares.)
Table 6 presents our estimates of the two-stage probit models with endogenous
regressors. In general these estimates are too imprecise to rule out effects of zero,
although the effect of a move from minimum to low security on two-year recidivism
rates is significant at the 10 percent level. The point estimates consistently show
sizable effects (on the order of about 30 percentage points) of moving an inmate from
minimum to low security, which is where our data permit the best identification.

3

Policy Implications

Our estimates suggest that harsher prison conditions induce substantially greater
post-release recidivism among former federal inmates, an effect that would likely have
important implications for prison policy. For several reasons however, our findings by
16

themselves do not imply that prison conditions should be less harsh or restrictive. In
this section, we discuss additional considerations that must be weighed against our
evidence in determining the net effect on crime of harsher (or less harsh) confinement
conditions.
The first potential counterpoint to our findings is that harsher prisons may suppress crime by deterring crime among the non-incarcerated. Indeed, using the inprison mortality rate as an index of a state’s prison conditions, Katz, Levitt, and
Shustorovich (2003; hereafter KLS) use annual data to show that harsher prison conditions have a sizable contemporaneous deterrent effect. For a coarse comparison of
the magnitudes of their findings and our own, we note that according to the 1990
Census of State and Federal Adult Correctional Facilities (Bureau of Justice Statistics, 1990), federal facilities with a medium-security custody designation had prisoner
death rates of 2.28 per 1, 000 prisoners, whereas those with a minimum-security designation had death rates of 0.66 per 1, 000. Unfortunately the census does not contain
death rates for low-security prisoners, which would be most relevant to our discontinuity between minimum and low-security prisons. However, while the difference in
death rates between minimum and medium security facilities are likely to overstate
the difference between minimum and low, in other surveys we find that the difference
in rates of serious injury between minimum- and low-security facilities is almost as
large as that between minimum- and medium-security facilities (see Table 1). This
suggests that death rates in medium- and minimum-security facilities may reasonably
approximate the differences faced by inmates on opposite sides of the cutoff we study.
Given this approximation, KLS’s baseline estimates imply that moving all inmates
from minimum- to low-security facilities would decrease the murder rate by 0.02 (per
100, 000 people), the violent crime rate by 10, and the property crime rate by 23, for
a total reduction in crime of about 33. Note, however, that because KLS primarily
focus on the contemporaneous effects of changes in in-prison mortality, their estimates
are likely to omit the effect of harsher confinement conditions on future recidivism.
Our estimates imply that every released inmate would be 28 percentage points more
likely to commit a crime in the year following release if inmates were all housed in low
17

rather than minimum security facilities. Given that approximately 600, 000 inmates
are released annually (accounting for about 200 of every 100, 000 Americans), even if
each released inmate were to commit at most one crime, and that all crimes result in
arrests (both conservative assumptions), our estimates would imply an increase in the
crime rate of approximately 56 per 100, 000 released prisoners, for a net increase of
about 23 crimes per 100, 000. In other words, the effects we estimate are on the same
order of magnitude as the deterrent effects estimated by KLS; indeed they appear
large enough to outweigh deterrence and drive a net increase in crime should prison
conditions worsen. (An important caveat to this conclusion is that KLS find that
lagged changes in the in-prison death rate continue to have negative effects on crime.
If the recidivism effect of harsher prisons exceeded the deterrent effect we would have
expected lagged effects to eventually become positive, which KLS do not find.)
A second critical interpretational issue concerns the role of social interactions and
peer effects. If the effects we estimate are primarily a result of confinement conditions per se, then it is reasonable to treat our estimates as measuring the potential
consequences of changes in conditions on recidivism. If, on the other hand, the effects we compute result largely from prisoners’ effects on one another, then, to a first
approximation, moving inmates from minimum to low security would have no effect
on overall recidivism rates, because the inmates in low security would experience a
reduction in recidivism rates from the inclusion of a minimum-security inmate in their
peer group. Note, however, that if peer effects are nonlinear, or if the magnitude of
peer effects depends on individuals’ ex-ante characteristics, then it may be possible to
sort inmates so as to reduce overall levels of recidivism in the post-release population.
A final issue regarding the consequences of changing prison conditions is that the
security level of a facility is tailored to the inmate population in part to minimize the
risk of in-prison misconduct, escape, and other undesirable outcomes. Indeed, Berk
and de Leeuw (1999) show, using a discontinuity design, that inmates placed in higher
security levels engage in less in-prison misconduct. Of course, these reductions in
misconduct require the application of greater resources (such as staff). Nevertheless, if
harsher conditions reduce in-prison violence and other misconduct, these effects must
18

be made a part of any complete analysis of policy regarding confinement conditions.

4

Conclusion

With over two million inmates currently incarcerated and six hundred thousand inmates released per year, the demographic impact of American prisons can hardly be
overstated. In this paper we have attempted to understand the impact of incarceration on inmates’ subsequent behavior, focusing on perhaps the most serious and
socially costly consequence of that incarceration, recidivism into crime.
By exploiting discontinuities in the assignment of inmates to different security
levels, we attempt to isolate the causal impact of prison conditions on recidivism.
Our findings suggest that harsher prison conditions cause higher rates of post-release
criminal behavior, behavior which is also measurably more violent. We attempt to
validate our discontinuity approach by showing that besides prison conditions, other
observable characteristics do not jump at prison assignment cutoffs, nor do our jumps
in recidivism appear in a control population housed in administrative facilities.
Turning to policy questions, while our estimates are imprecise they are large in
magnitude and appear larger than benchmark estimates of deterrence effects. Our
results also highlight the potential importance of research aimed at determining which
aspects of incarceration increase or reduce recidivism. A richer understanding of the
ways inmates respond to both harsher prison conditions and exposure to more violent
peers would likely allow planners to suppress socially costly recidivism by adjusting
conditions and redesigning assignment systems, both between and within prisons.
Additionally, because many prison systems utilize score cutoffs for inmate placement,
our work highlights an empirical methodology with potentially wide scope and policy
relevance.

19

References
[1] P. A. Banister, F.V. Smith, K. J. Heskin, and N. Bolton. Psychological correlates of long-term imprisonment. British Journal of Criminology, 13(4):312—330,
October 1973.
[2] Patrick Bayer, Randi Pintoff, and David E. Pozen. Building criminal capital
behind bars: Social learning in juvenile corrections. Yale University Mimeo,
October 2003.
[3] Richard A. Berk and J. de Leeuw. Evaluation of California’s inmate classification system using a generalized discontinuity design. Journal of the American
Statistical Association, 94(448):1045—1052, 1999.
[4] Richard A. Berk and David Rauma. Capitalizing on nonrandom assignment to
treatments: A regression-discontinuity evaluation of a crime control program.
Journal of the American Statistical Association, 78(381):21—27, March 1983.
[5] Camille Graham Camp and George M. Camp. The Corrections Yearbook: 1997.
Criminal Justice Institute, Inc., South Salem, New York, 1997.
[6] Scott D. Camp. Do inmate survey data reflect prison conditions? using surveys
to assess prison conditions of confinement. The Prison Journal, 79(2):250—268,
June 1999.
[7] Scott D. Camp and Gerald G. Gaes. Private prisons: What do we really know
and why don’t we know more? In David Schichor and Michael Gilbert, editors,
Privatization of Criminal Justice: Past, Present and Future, pages 283—298.
Anderson, Cincinnati, OH, 2001.
[8] Scott D. Camp and Gerald G. Gaes. Are prisons criminogenic? some experimental evidence. Unpublished manuscript, September 2003.
[9] D. T. Campbell and J. C. Stanley. Experimental and quasi-experimental designs
for research. Rand McNally, Chicago, 1963.
[10] Ted Conover. Newjack: Guarding Sing Sing. Vintage Books, New York, NY,
2001.
[11] Organization for Economic Co-operation and Development. Society at a Glance:
OECD Social Indicators. OECD, Paris, 2001.
[12] Edward L. Glaeser, Bruce Sacerdote, and José A. Scheinkman. Crime and social
interactions. Quarterly Journal of Economics, 111(2):507—548, May 1996.
[13] Miles D. Harer. Recidivism among federal prisoners released in 1987. 1994.
[14] Miles D. Harer and Neal P. Langan. Gender differences in predictors of prison
violent: Assessing the predictive validity of a risk classification system. Crime
and Delinquency, 47(4):513—536, October 2001.
20

[15] Oliver Hart, Andrei Shleifer, and Robert Vishny. The proper scope of government: Theory and an application to prisons. Quarterly Journal of Economics,
112(4):1127—1161, November 1997.
[16] Caroline M. Hoxby. The effects of class size on student achievement: New evidence from population variation. Quarterly Journal of Economics, 115(4), 2000.
[17] Dana A. Jones, Shelley Johnson, Edward Latessa, and Lawrence F. Travis. Case
classification in community corrections: Preliminary findings from a national
survey. Topics in community corrections, 1999.
[18] Lawrence Katz, Stephen D. Levitt, and Ellen Shustorovich. Prison conditions,
capital punishment, and deterrence. American Law and Economic Review,
5(2):318—343, 1996.
[19] Ilyana Kuziemko. Discretion versus rules in parole decisions: An empirical investigation. Harvard University Mimeograph, September 2006.
[20] Patrick A. Langan and David J. Levin. Recidivism of prisoners released in 1994.
Bureau of Justice Statistics Special Report, June 2002.
[21] David S. Lee. The electoral advantage to incumbency and voters’ valuation of
politicians’ experience: A regression discontinuity analysis of elections to the u.s.
house. National Bureau of Economic Research Working Paper, 8441, 2001.
[22] David S. Lee and David Card. Regression discontinuity inference with specification error. UC Berkeley Mimeograph, February 2006.
[23] Stephen D. Levitt. Juvenile crime and punishment. Journal of Political Economy,
106(6):1156—1185, December 1998.
[24] Whitney K. Newey. Efficient estimation of limited dependent variable models
with endogenous explanatory variables. Journal of Econometrics, 36(3):231—250,
November 1987.
[25] Federal Bureau of Prisons. Security Designation and Custody Classification Manual. U.S. Department of Justice, Washington, D.C., October 1982.
[26] Federal Bureau of Prisons. Security Designation and Custody Classification
Manul. U.S. Department of Justice, Washington, D.C., 1985.
[27] Joan Petersilia and Susan Turner. Intensive probation and parole. Crime and
Justice, 17:281—335, 1993.
[28] Anne Morrison Piehl and Stefan F. LoBuglio. Does supervision matter? In
Jeremy Travis and Christy Visher, editors, Prisoner reentry and public safety in
America. Cambridge University Press, Cambridge, UK, 2005. forthcoming.
[29] Randi Pintoff. Juvenile jails: A path to the straight and narrow or hardened
criminality? University of Maryland Mimeograph, November 2005.
21

[30] Donald B. Rubin. Assignment to treatment group on the basis of a covariate.
Journal of Educational Statistics, 2:34—58, 1977.
[31] Bruce Sacerdote. Crime and social interactions. Quarterly Journal of Economics,
116(2):681—704, May 2001.
[32] Lawrence W. Sherman and Richard A. Berk. The specific deterrent effects of
arrest for domestic assault. American Sociological Review, 49(2):261—272, April
1984.
[33] Douglas A. Smith and Patrick R. Gartin. Specifying specific deterrence: The
influence of arrest on future criminal activity. American Sociological Review,
54(1):94—106, February 1989.
[34] Gresham M. Sykes. The Society of Captives: A Study of A Maximum Security
Prison. Princeton University Press, Princeton, NJ, 1958.
[35] Bureau of Justice Statistics U.S. Department of Justice. Census of State and
Federal Adult Correctional Facilities. Inter-University Consortium for Political
and Social Research, Ann Arbor, MI, 1990.
[36] Bureau of Justice Statistics U.S. Department of Justice. Key facts at a glance.
http://www.ojp.usdoj.gov/bjs/keytabs.htm, 2002.
[37] Bureau of Prisons U.S. Department of Justice. Survey of Inmates of Federal
Correctional Facilities, 1991. Inter-University Consortium for Political and Social
Research, Ann Arbor, MI, 1994.
[38] Wilbert van der Klauuw. Estimating the effect of financial aid offers on college
enrollment: A regression-discontinuity approach. 2001. Forthcoming.
[39] Bruce Western, Jeffrey R. Kling, and David F. Weiman. The labor market
consequences of incarceration. Crime and Delinquency, 47(3):410—427, July 2001.

22

Table 1 Security Level and Prison Conditions
Percent of Inmates
Minimum
Receiving a furlough

Security Level
Low Medium Maximum

14.20%

2.50%

1.60%

0.78%

In cell for > 8 hours per day

49.01

55.21

55.03

58.22

Seriously injured

16.54

19.21

20.45

22.19

Found guilty of prison rule violation for:
Possession of drugs

0.45

2.02

3.59

15.78

Possession of alcohol

0.11

0.47

2.63

9.53

Possession of a weapon

0.00

0.12

0.99

7.66

Assaulting an inmate

1.07

3.32

5.05

9.38

Assaulting a correction officer

0.00

0.36

1.04

5.94

1782

843

2315

640

Number of observations

Source: Authors’ calculations based on U.S. Department of Justice (1991).
Notes: In all cases, a Pearson χ2 test rejects the null hypothesis of equal proportions
across security levels at the one percent level.

23

Table 2 Summary Statistics
Security level
Share rearrested within
One year

All

Minimum

0.1624

0.1179

0.2195 0.2171

Two years

0.2732

0.1996

0.3659 0.3643

Three years

0.3681

0.2966

0.4329 0.4729

36.62

37.14

35.88

High school graduates

0.5591

0.6464

0.4634 0.4419

Previously convicted

0.6867

0.5837

0.8049 0.8217

Married as of arrest

0.3850

0.4354

0.3659 0.2946

Employed before arrest 0.5380

0.6369

0.4451 0.3953

White

0.7131

0.7643

0.6829 0.6279

Male

0.9219

0.8612

1.000

0.9961

948

526

164

258

Mean age

Low

>Low

36.02

Share of inmates who are:

Number of observations

24

Table 3 Reduced-form Estimates of the Effect of Score Cutoffs on Rearrest

Model

(1)
Cox

(2)
Probit

(3)
Probit

(4)
Probit

Dependent

Time to

Probability of rearrest within

variable

rearrest

One year Two years Three years

Score>6

0.6999
(0.3338)

0.1826
(0.0976)

0.2515
(0.1105)

0.2003
(0.1155)

Score>9

0.4611
(0.3359)

0.0424
(0.0857)

0.1627
(0.1217)

0.1702
(0.1337)

Score>13

0.0460
(0.4942)

-0.1022
(0.0510)

0.2353
(0.1960)

0.0365
(0.1950)

Security custody 0.6852
score
(0.1320)

0.1417
(0.0268)

0.1784
(0.0356)

0.1737
(0.0417)

Score2

-0.1261
(0.0383)

-0.0304
(0.0080)

-0.0331
(0.0107)

-0.0300
(0.0129)

Score3 /100

0.7824
(0.3086)

0.2146
(0.0666)

0.1936
(0.0900)

0.1670
(0.1144)

Score4 /10000

-1.5603
(0.7632)

-0.4729
(0.1690)

-0.3690
(0.2305)

-0.2791
(0.3069)

Observations
948
948
948
948
Pseudo-R2
–
0.1047
0.1224
0.1163
Notes: Standard errors in parentheses. In Cox model, reported coefficients represent
underlying model parameters. In probit models, coefficients reflect marginal effects
evaluated at the mean of the independent variables.

25

Table 4 Tests for Discontinuities in Predetermined Correlates of Rearrest
(1)

(2)
(3)
(4)
Dependent variable is dummy for:

High school
Prior
graduate
convictions

Married

White

(5)

Employed before
arrest

Score>6

-0.0740
(0.1196)

0.1037
(0.1043)

-0.2007 -0.0389
(0.1021) (0.1033)

-0.1866
(0.1215)

Score>9

-0.1229
(0.1384)

-0.1958
(0.2035)

-0.1683 -0.0855
(0.1245) (0.1189)

-0.2100
(0.1512)

Score>13

0.2454
(0.1508)

-0.5038
(0.3187)

-0.1947 -0.0404
(0.1601) (0.1746)

-0.3230
(0.1799)

Security custody
score

-0.1161
(0.0438)

0.1689
(0.0428)

-0.0969 -0.1109
(0.0442) (0.0370)

-0.1355
(0.0465)

Score2

0.0127
(0.0138)

-0.0368
(0.0148)

0.0134
0.0167
(0.0143) (0.0112)

0.0066
(0.0150)

Score3 /100

-0.0414
(0.1229)

0.3300
(0.1540)

-0.0329 -0.0906
(0.1331) (0.0946)

0.0731
(0.1405)

Score4 /10000

-0.0112
(0.3324)

-0.8399
(0.4616)

-0.0501
0.1589
(0.3732) (0.2424)

-0.3689
(0.3966)

Observations

948

948

948

948

948

Notes: Standard errors in parentheses. Coefficients reflect marginal effects evaluated
at the mean.

26

Table 5 Robustness and Specification Checks

Model
Dependent
variable

(1)
Cox
Time to
rearrest

(2)
(3)
(4)
Probit
Probit
Probit
Probability of rearrest within
One year
Two years Three years

Panel A: Demographic controls
Baseline

0.6999
(0.3338)

0.1826
(0.0976)

0.2515
(0.1105)

0.2003
(0.1155)

Baseline
+ controls

0.4366
(0.3459)

0.1427
(0.0909)

0.1958
(0.1102)

0.1237
(0.1189)

Panel B: Comparison with Administrative sample
Baseline

0.6999
(0.3338)

0.1826
(0.0976)

0.2515
(0.1105)

0.2003
(0.1155)

Administrative
sample

-0.0658
(0.4706)

-0.0436
(0.1178)

-0.1560
(0.1775)

-0.0514
(0.2005)

Z-test of difference
1.21
1.39
1.90
in coefficients
(p = 0.225) (p = 0.164) (p = 0.058)

1.06
(p = 0.288)

Panel C: Weights to reflect release probability
Baseline
(unweighted)

–

0.1826
(0.0976)

0.2515
(0.1105)

0.2003
(0.1155)

Weighted by
time in prison

–

0.2346
(0.0950)

0.2666
(0.1047)

0.3071
(0.1080)

Notes: Standard errors in parentheses. Demographic controls include age and dummies for high school graduate, prior convictions, married, white, male, and employed
prior to arrest. Coefficients in probit models reflect marginal effects evaluated at the
sample mean of the independent variables.

27

Table 6 Structural Estimates of the Effect of Security Level on Rearrest
(1)
Dependent
variable

(2)

(3)

Probability of rearrest within
One year Two years Three years

Model coefficients:
Low

1.1513
(0.8651)

1.7678
(1.0595)

0.9564
(0.8790)

Low/Medium

1.7973
(1.2774)

2.8382
(1.5524)

2.0659
(1.2974)

Medium

0.0983
(1.9798)

3.8255
(2.4139)

1.9682
(2.0395)

Low-Minimum

0.2800

0.4634

0.3038

Low/Medium-Low

0.2450

0.3363

0.3566

Medium-Low/Medium

-0.5089

0.2540

-0.0283

948

948

948

Average marginal effects:

Observations

Notes: Standard errors in parentheses. Models estimated using Newey’s (1987) procedure. Average marginal effects reflect change in average predicted probability of
recidivism caused by indicated change in security level.

28

Figure 1 Inmate Load and Security Designation Form

29

Figure 2 Security Custody Score and Inmate Security Level

1

Low Security / (Minimum + Low)

0.8

0.6

0.4

0.2

0
0

1

2

3

4

5

6

7

8

9

10

Security Custody Score

Notes: Vertical axis measures the share of inmates in low security among those in
either minimum or low. That is, if Ms is the number of inmates with score s who are
housed in minimum security and Ls is the number who are housed in low security,
each datapoint shows
Ls
Ls + Ms
for some score s See Appendix Table 3 for underlying data.

30

Figure 3 Security Custody Score and Rearrest Rates

0.40

Share rearrested within one year

0.35

0.30

0.25
Actual
Predicted

0.20

0.15

0.10

0.05

0.00
0

1

2

3

4

5

6

7

8

9

10

Security Custody Score

Notes: Vertical axis measures the share rearrested within one year of release. Predicted values are predicted probabilities of rearrest based on a probit model with
independent variables: age and dummies for high school graduation status, prior arrest, married, white, male, and employed as of arrest date.

31

5

Appendix: Constructing the Security Custody
Score

Here, we detail the process by which a prisoner is assigned a security custody score by
the bureau of prisons. Upon entry to the federal prison system, an inmate is processed
using an Inmate Load and Security Designation Form (see Figure 1). Seven separate
items are evaluated by a regional designator for each inmate. Each item is governed
by a procedure found in the Bureau of Prisons Security Designation and Custody
Classification Manual (Federal Bureau of Prisons, 1982). Discussing each item in the
order in which it is addressed on the Designation Form:

5.1

Type of Detainer

This category refers to the severity of charges for which the inmate has not yet been
tried and sentenced. A pending charge under a state statute would fall under this
category, for example. The severity of the worst such charge is ranked from 0 to 7
according to the severity of offense scale (discussed below), and this number becomes
the inmate’s type of detainer score, with the exception that 0 means no pending
charges, and a score of 1 indicates a pending charge with a severity score of either 0
or 1.

5.2

Severity of Current Offense

All offenses are classified according to the Bureau of Prisons Severity of Offense
Scale, which exhaustively partitions the penal code into 5 categories: 0 (lowest),
1 (low/moderate), 3 (moderate), 5 (high), and 7 (greatest). The severity of current
offense score for an inmate is the severity of the most severe documented behavior
associated with the crime for which the individual is currently serving a period of
incarceration. For example, if an individual was involved in an armed robbery of a
bank (which scores a 7), but plead down at trial to simple robbery (which scores a
5), he would score a 7.

5.3

Expected Length of Incarceration

To determine this value the regional designator first looks up the reference (standard)
sentence length in months for the inmate, based only on the offense for which the
inmate is serving time. These are found in the Expected Length of Incarceration
Scale in the Sentencing Handbook. The minimum of this number and the months to
which the inmate was actually sentenced is compared to a set of cutoffs, with 0-12
months receiving 0 points, 13-59 receiving 1, 60-83 receiving 3, and 84 or more months
receiving 5 points.

32

5.4

Type of Prior Commitments

If an inmate has never been incarcerated before he receives a 0. Otherwise, the most
severe offense he has been incarcerated for (as evaluated by the severity of current
offense scale) is used. An inmate receives 1 point if his most serious prior offense is
classified as either low or low-moderate. Any more serious offence conviction leads to
a score of 3.

5.5

History of Escape Attempts

This measure classifies the escape history of the individual. The history includes a
individual’s entire background of escapes or attempts to escape from confinement,
excluding the current offense. This includes documented flight to escape prosecution,
and if multiple escape attempts were made the most severe is used. The severity of
the escape attempt is classified as either minor or serious. A minor attempt must
have been from an open institution (work camp, work release, furlough, flight to avoid
prosecution) and must not have involved a threat of violence. All other attempts are
considered serious. As the security designation form details, this severity and the
time elapsed since the attempt, combine to form this score component.

5.6

History of Violence

This classifies the violent acts history of the individual. This history comprises a
individual’s entire background of violent acts, excluding his current offense. Violent
acts enter the history even if noted by a prison discipline committee but never prosecuted. If an inmate has multiple such acts, the most severe is used. The severity of
each act is classified as either minor or serious. A minor act is a simple assault, fight,
or domestic squabble. Aggravated assault or worse, arson, or any act involving a
weapon, or explosives is considered serious. As the security designation form details,
this severity and the time elapsed since the act combine to form this score component.

5.7

Pre-Commitment Status

An inmate scores 0 if prior to incarceration he was not out on his own recognizance
and/or did not voluntarily surrender. He scores -3 if he was released on his own
recognizance during his trial without posting bail to ensure appearance, but was
incarcerated post-trial. An inmate scores -6 if he meets the previous criteria and
surrendered voluntarily to confinement, i.e. was not escorted by a law official to the
place of his confinement.

33

Appendix Table 1 Computing the Security Custody Score
Inmate characteristic

Score Range
From
To
0 (None)
7 (Greatest)

Type of detainer
(severity of outstanding charges)
Severity of current offense

0 (Lowest)

7 (Greatest)

0 (0-12 Months)

5 (84+ Months)

Type of prior commitments

0 (None)

3 (Serious)

History of escapes or attempts

0 (None)

7 (Recent Escape)

History of violence

0 (None)

7 (Recent Serious)

-6 (Voluntary Surrender)

0 (None)

0

36

Expected length of incarceration

Precommitment status
(bail, bond, etc. set in trial)
TOTAL

Appendix Table 2 Determining the Appropriate Security Level
Score Range Assigned Security Description
Level

Example

0-6

1

Minimum

Danbury Camp

7-9

2

Low

La Tuna

10-13

3

Low/Medium Otisville

14-22

4

Medium

Petersburg

23-29

5

High

Leavenworth

30-36

6

High

Marion

Source: Federal Bureau of Prisons (1985).

34

Appendix Table 3 Detailed Data Summary
Score Number
of
inmates

Percent of inmates in security level:
High

Percent rearrested
within (years):
One Two Three

Assigned security level based on score: Minimum
0
411
78.35 6.33
2.43
4.87

8.03

4.62

9.98

17.27

1

46

63.04 17.39

6.52

8.70

4.35

17.39 28.26

41.30

2

45

77.78 17.78

0.00

4.44

0.00

26.67 40.00

51.11

3

56

64.29 25.00

1.79

5.36

3.57

19.64 30.36

33.93

4

79

58.23 21.52

10.13

5.06

5.06

24.05 34.18

44.30

5

47

57.45 27.66

0.00

10.64

4.26

17.02 44.68

57.45

6

44

47.73 36.36

6.82

4.55

4.55

22.73 40.91

52.27

Assigned security level based on score: Low
7
31
3.23 54.84
25.81

9.68

6.45

32.26 54.84

61.29

8

20

10.00 65.00

25.00

0.00

0.00

35.00 55.00

65.00

9

33

9.09

18.18

6.06

3.03

27.27 36.36

48.48

Assigned security level based on score: Low/Medium
10
26
3.85 26.92
53.85
15.38

0.00

34.62 61.54

69.23

11

17

11.76

5.88

70.59

5.88

5.88

23.53 23.53

52.94

12

31

3.23

3.23

61.29

29.03

3.23

29.03 45.16

58.06

13

11

0.00

18.18

18.18

54.55

9.09

36.36 45.45

72.73

Min.

Low

63.64

Low/Med Medium

Assigned security level based on score: Medium
14+

51

0.00

0.00

11.76

60.78

27.45 29.41 60.78

72.55

ALL

948

55.49 17.30

10.23

10.13

6.86

36.81

16.24 27.32

Note: Inmate percentages may not add to 100 due to rounding error.

35