
Cjsc-california Prison Deaths 1994-2003
Download original document:
Document text
Document text
This text is machine-read, and may contain errors. Check the original document to verify accuracy.
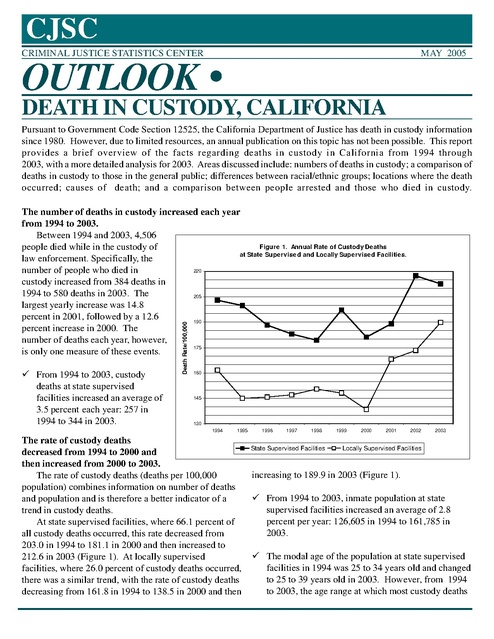
CJSC
CRIMINAL JUSTICE STATISTICS CENTER

MAY 2005


OUTLOOK
DEATH IN CUSTODY, CALIFORNIA

Pursuant to Government Code Section 12525, the California Department of Justice has death in custody information
since 1980. However, due to limited resources, an annual publication on this topic has not been possible. This report
provides a brief overview of the facts regarding deaths in custody in California from 1994 through
2003, with a more detailed analysis for 2003. Areas discussed include: numbers of deaths in custody; a comparison of
deaths in custody to those in the general public; differences between racial/ethnic groups; locations where the death
occurred; causes of death; and a comparison between people arrested and those who died in custody.

From 1994 to 2003, custody
deaths at state supervised
facilities increased an average of
3.5 percent each year: 257 in
1994 to 344 in 2003.

Death Rate/100,000

The number of deaths in custody increased each year
from 1994 to 2003.
Between 1994 and 2003, 4,506
Figure 1. Annual Rate of Custody Deaths
people died while in the custody of
at State Supervised and Locally Supervised Facilities.
law enforcement. Specifically, the
220
number of people who died in
custody increased from 384 deaths in
1994 to 580 deaths in 2003. The
205
largest yearly increase was 14.8
percent in 2001, followed by a 12.6
190
percent increase in 2000. The
number of deaths each year, however,
175
is only one measure of these events.
160

145

130
1994

1995

The rate of custody deaths
decreased from 1994 to 2000 and
then increased from 2000 to 2003.
The rate of custody deaths (deaths per 100,000
population) combines information on number of deaths
and population and is therefore a better indicator of a
trend in custody deaths.
At state supervised facilities, where 66.1 percent of
all custody deaths occurred, this rate decreased from
203.0 in 1994 to 181.1 in 2000 and then increased to
212.6 in 2003 (Figure 1). At locally supervised
facilities, where 26.0 percent of custody deaths occurred,
there was a similar trend, with the rate of custody deaths
decreasing from 161.8 in 1994 to 138.5 in 2000 and then

1996

1997

1998

State Supervised Facilities

1999

2000

2001

2002

2003

Locally Supervised Facilities

increasing to 189.9 in 2003 (Figure 1).
	 From 1994 to 2003, inmate population at state
supervised facilities increased an average of 2.8
percent per year: 126,605 in 1994 to 161,785 in
2003.
	 The modal age of the population at state supervised
facilities in 1994 was 25 to 34 years old and changed
to 25 to 39 years old in 2003. However, from 1994
to 2003, the age range at which most custody deaths

occurred at state supervised facilities changed from the
30 to 34-year-old group in 1994 to the 45 to 49-year-old
group in 2003.
The rate of death was higher for 55 to 74-year-olds in
custody compared to the general public.
In the general public, any number of conditions
affect the rate of death and the age at death. Being in
custody, however, provides another set of conditions,
which may either degrade or restore a person’s health
and well being and therefore further modify a person’s
life expectancy.
For people between 25 and 54 years old in 2001
(most current data available), the rate of death was
similar at state supervised facilities and for the general
public. However, for younger persons 15 to 24 years
old, the rate of death was higher for the general public,
and, for the 55 to 74 year-old age group, the death rate
was higher at state supervised facilities.
As expected for the general public, the largest
number of deaths occur at ages 75 to 84 years old.
However, at state supervised facilities, the largest
number of custody deaths occur at ages 45 to 54 years
old.

and local hospitals (4.3 percent), and state and local
juvenile facilities (0.3 percent) (Figure 2).
Sixty-two percent of custody deaths were from
natural causes.
In 2003, causes of custody deaths were 61.9 percent
natural causes, 13.1 percent suicide, 9.5 percent
accidental, 7.8 percent justified homicide, and 2.9
percent other homicides (Figure 3).
Most of the custody deaths at city jails, juvenile
facilities, squad car, street or residence were not due
to natural causes.
From 1994 to 2003, the number of custody deaths
due to natural causes was greater than other causes for
both genders and each racial/ethnic group. During this
period, custody deaths from natural causes were greater
than other causes of death at prisons, county jails, adult
camps/ranches, and state/local hospitals.
Conversely, custody deaths at city jails, state/local
juvenile facilities, and in squad car/street/residence were
greater for other than natural causes.
From 1994 to 2003, the percentage of custody deaths
due to natural causes was 73.0 percent for females
and 70.2 percent for males.

From 2000 to 2003, the rate of custody deaths for
whites increased, while the rate for Hispanics and
blacks remained the same.
From 1994 to 2003, the percentage of custody
The rate of custody deaths for whites at state
deaths due to natural causes was 80.8 percent for
supervised facilities
blacks, 62.2 percent for
decreased from 284.3 in
Hispanics, 68.5 percent for
Figure
2.
Locations
for
Custody
Deaths,
2003
1994 to 243.2 in 2000,
whites, and 62.7 percent
Hospital
then increased to 326.0 in
for other races.
4.3%
City Jail
Juvenile Facility
2003. However, during
2.4%
0.3% Street/Residence/
this time period, 1994From 1994 to 2003,
Squad Car
County Jail/Camps
15.7%
22.2%
2003, the rate of custody
most deaths in custody by
deaths for blacks and
natural causes were at
Hispanics remained about
prisons (83.5 percent),
the same, averaging, 197.9
county jails and adult
for blacks and 125.1 for
camps/ranches (58.6
Prison
Hispanics.
percent), and state/local
55.0%
hospitals (81.1 percent).
Fifty-five percent of
However, most custody
custody deaths occurred
deaths due to other than
in prison.
natural causes occurred at city jails (81.7 percent),
In 2003, most custody deaths occurred in prison
state/local juvenile facilities (75.0 percent), and in
(55.0 percent), followed by county jails and adult camps/
squad car/street/residence (85.8 percent).

ranches (22.2 percent), a squad car, on a street or in a

residence (15.7 percent), city jails (2.4 percent), state


2


Hanging and strangulation was most often the means
of death for Hispanics and for whites who died from
other than natural causes.
In 2003, the most common means of death (excluding natural causes) was injury from hanging/strangula-

percent), firearm (22.4 percent), drug overdose (20.1
percent), vehicle or explosive (19.6 percent), knife/
cutting instrument (4.6 percent), and club/blunt
instrument or hands/feet/fists (4.6 percent) (Figure 4).
	 From 1994 to 2003, for other than natural causes,
most Hispanics (39.3 percent), other races (44.7
percent), and whites (45.6 percent) died from
hanging/strangulation. Most blacks died from
vehicle or explosive injuries (27.6 percent), followed
by hanging/strangulation (25.2 percent) and drug
overdose (24.8 percent).

Figure 3. Causes of Death, 2003
Homicide
2.9%
Homicide
Justified
7.8%

Suicide
13.1%
Other
4.8%

Accidental
9.5%

Males are dying in custody at a higher rate than
females.
In 2003, males comprised the majority of both
arrestees (79.0 percent) and custody deaths (93.8 percent). The larger proportion of male custody deaths
suggests that males in custody are dying at a higher rate
than females.

Natural
61.9%

tion followed by a firearm, drug overdose, and a vehicle
or explosive, with equal numbers for a knife/cutting
instrument, and club/blunt instrument or hands/feet/fists
(Figure 4). From 1994 to 2003, most Hispanics, other

Figure 4. Means of Death, 2003 (Other
Than Natural Causes)

Knife
4.6%

Club/Hands/
Feet/Fists
4.6%
Vehicle/Explosive
19.6%

Drug Overdose
20.1%

Most arrestees were in the 15 to 24-year-old age
group, yet most deaths in custody occurred in the 45
to 54-year-old age group.
In 2003, most arrests consisted of Hispanics,
followed by whites and blacks, yet most custody deaths
consisted of whites, followed by blacks and Hispanics.
In 2003, most black, Hispanic, and white arrestees
were between 15 and 24 years old. In addition, for
blacks and whites, there was a second noticeable group
arrested between 35 and 44 years old.
In 2003, most black, Hispanic, and white deaths in
custody occurred for persons between 45 and 54 years
Figure 5. Custody Deaths by Racial/Ethnic Group, 2003

Firearm
22.4%

Hanging,
Strangulation
28.8%

Black
27.8%

Other
6.0%

races, and whites who died from other than natural
causes died from hanging/strangulation. Most blacks
died from injuries from a vehicle or explosive followed
by equal numbers of deaths by hanging/strangulation,
and drug overdose.

Hispanic
23.1%

White
43.1%

	 In 2003, for other than natural causes, the means of
death was usually hanging/strangulation (28.8

3


old. In addition, for Hispanics there was a second
noticeable group of death in custody for persons between
25 and 34 years old.

Example research topics include:
	 A study which uses rate of custody death to
investigate significant differences in location of fatal
injury, cause of death, and means of death in terms
of gender, age, and race/ethnic group.

	 In 2003, most deaths in custody consisted of whites
(43.1 percent), followed by blacks (27.8 percent),
Hispanics (23.1 percent), and other races (6.0
percent) (Figure 5).

	 A study to investigate significant differences
between people arrested, people in custody and
deaths in custody in terms of gender, age and race/
ethnic group.

	 In 2003, most arrestees consisted of Hispanics (40.0
percent), followed by whites (35.9 percent), blacks
(16.6 percent), and other races (7.6 percent).
Additional research needs to be done.
This Outlook was intended as a brief overview of
death in custody in California. Additional detailed
research could be done if resources were available.

Definitions
Custody is defined as any point in time when a
person’s freedom of movement has been denied by law
enforcement, such as during transport prior to booking,
or during arrest, prosecution, sentencing, and
correctional confinement.

This Outlook was authored by Robert R. Springborn, Ph.D. For any questions or feedback you
may have regarding this report’s contents, Dr. Springborn can be reached at (916) 227-3557. If
you need assistance in obtaining additional statistical information or a customized statistical report,
please contact the CJSC’s Special Requests Unit at (916) 227-3509.

CJSC
OUTLOOK
CRIMINAL JUSTICE STATISTICS CENTER
P.O. Box 903427
Sacramento, CA 94203-4270

Forwarding and Address
Correction Requested

Bill Lockyer, Attorney General
California Department of Justice

Division of California Justice Information Services

Bureau of Criminal Information and Analysis

CRIMINAL JUSTICE STATISTICS CENTER

ATTORNEY GENERAL ON THE INTERNET: http://ag.ca.gov

Analyst: Robert R. Springborn, PhD.