
DOJ Report -Indicators of Mental Health Problems
Download original document:
Document text
Document text
This text is machine-read, and may contain errors. Check the original document to verify accuracy.
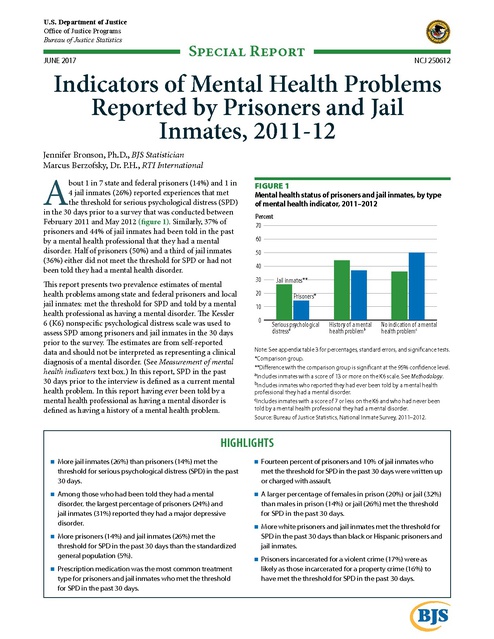
U.S. Department of Justice Office of Justice Programs Bureau of Justice Statistics JUNE 2017 Special Report NCJ 250612 Indicators of Mental Health Problems Reported by Prisoners and Jail Inmates, 2011-12 Jennifer Bronson, Ph.D., BJS Statistician Marcus Berzofsky, Dr. P.H., RTI International A bout 1 in 7 state and federal prisoners (14%) and 1 in 4 jail inmates (26%) reported experiences that met the threshold for serious psychological distress (SPD) in the 30 days prior to a survey that was conducted between February 2011 and May 2012 (figure 1). Similarly, 37% of prisoners and 44% of jail inmates had been told in the past by a mental health professional that they had a mental disorder. Half of prisoners (50%) and a third of jail inmates (36%) either did not meet the threshold for SPD or had not been told they had a mental health disorder. This report presents two prevalence estimates of mental health problems among state and federal prisoners and local jail inmates: met the threshold for SPD and told by a mental health professional as having a mental disorder. The Kessler 6 (K6) nonspecific psychological distress scale was used to assess SPD among prisoners and jail inmates in the 30 days prior to the survey. The estimates are from self-reported data and should not be interpreted as representing a clinical diagnosis of a mental disorder. (See Measurement of mental health indicators text box.) In this report, SPD in the past 30 days prior to the interview is defined as a current mental health problem. In this report having ever been told by a mental health professional as having a mental disorder is defined as having a history of a mental health problem. Figure 1 Mental health status of prisoners and jail inmates, by type of mental health indicator, 2011–2012 Percent 70 Jail inmates Prisoners* 60 50 40 30 Jail inmates** 20 Prisoners* 10 0 Serious psychological distressa History of a mental health problemb No indication of a mental health problemc Note: See appendix table 3 for percentages, standard errors, and significance tests. *Comparison group. **Difference with the comparison group is significant at the 95% confidence level. aIncludes inmates with a score of 13 or more on the K6 scale. See Methodology. bIncludes inmates who reported they had ever been told by a mental health professional they had a mental disorder. cIncludes inmates with a score of 7 or less on the K6 and who had never been told by a mental health professional they had a mental disorder. Source: Bureau of Justice Statistics, National Inmate Survey, 2011–2012. HIGHLIGHTS More jail inmates (26%) than prisoners (14%) met the threshold for serious psychological distress (SPD) in the past 30 days. Fourteen percent of prisoners and 10% of jail inmates who met the threshold for SPD in the past 30 days were written up or charged with assault. Among those who had been told they had a mental disorder, the largest percentage of prisoners (24%) and jail inmates (31%) reported they had a major depressive disorder. A larger percentage of females in prison (20%) or jail (32%) than males in prison (14%) or jail (26%) met the threshold for SPD in the past 30 days. More prisoners (14%) and jail inmates (26%) met the threshold for SPD in the past 30 days than the standardized general population (5%). More white prisoners and jail inmates met the threshold for SPD in the past 30 days than black or Hispanic prisoners and jail inmates. Prescription medication was the most common treatment type for prisoners and jail inmates who met the threshold for SPD in the past 30 days. Prisoners incarcerated for a violent crime (17%) were as likely as those incarcerated for a property crime (16%) to have met the threshold for SPD in the past 30 days. This report examines the prevalence of the two mental health indicators by different time periods, demographics, criminal justice history, and current offenses. The percentage of inmates who had a mental health indicator and who received mental health treatment while incarcerated are also presented. Estimates are based on the Bureau of Justice Statistics’ (BJS) 2011-12 National Inmate Survey (NIS-3). NIS-3 data were self-reported, and analyses include state and federal prisoners and local jail inmates. To facilitate comparisons to the general population, data from the National Survey on Drug Use and Health (NSDUH) were standardized to match the prison population and the jail population by age, sex, race, and Hispanic origin (see Methodology). In addition, the general population was divided into three groups based on self-reported involvement with the criminal justice system in the year prior to the interview: no involvement, under supervision (probation or parole), or arrested. Measurement of mental health indicators The 2011-12 National Inmate Survey (NIS-3) assessed the prevalence of serious psychological distress (SPD) in the 30 days prior to the interview and the percentage who had ever been told they had a mental disorder by a mental health professional. These two measures are used as indicators that an inmate likely has a current mental health problem or a history of a mental health problem. The estimates are from self-reported data and should not be interpreted as representing a clinical diagnosis of a mental disorder. Findings also should not be used to infer causation between an indicator of a mental health problem and incarceration, because the temporal relationship is unknown. SPD – The Kessler 6 (K6) nonspecific psychological distress scale was used to assess those who met the threshold for SPD in the 30 days prior to the interview. The K6 is a six-question tool developed to screen for serious mental illness among adults age 18 or older in the general U.S. population, with a score of 13 or higher indicating SPD.1 Inmates were asked how often during the 30 days prior to the interview they felt— nervous hopeless restless or fidgety so depressed that nothing could cheer them up everything was an effort worthless. The response options were (1) all of the time, (2) most of the time, (3) some of the time, (4) a little of the time, and (5) none of the time. The responses were recoded from 1Kessler, R. C., Barker, P. R., Colpe, L. J., Epstein, J. F., Gfroerer, J. C., Hiripi, E., Howes, M., Zaslavsky, A. M., et al. (2003). Screening for serious mental illness in the general population. Archives of General Psychiatry, 60(2), 184–189. Kessler, R. C., Green, J. G., Gruber, M. J., Sampson, N. A., Bromet, E., Cuitan, M., Zaslavsky, A. M., et al. (2010). Screening for serious mental illness in the general population with the K6 screening scale: results from the WHO World Mental Health survey initiative. International Journal of Methods in Psychiatric Research, 19(Supp. 1), 4-22. 4 to 0, with 4 assigned to “all of the time” and 0 assigned to “none of the time.” A summary scale with a range of 0 to 24 was then produced by combining the responses from all six items. Inmates with a score of 13 or higher were considered to have SPD, inmates with a score of 8 to 12 were considered to have an anxiety disorder (not reported), and inmates with a score of 7 or fewer were considered to not have an indicator of a current mental health problem (see Methodology). History of a mental health problem – This measure is based on the question, “Have you ever been told by a mental health professional, such as a psychiatrist or psychologist, that you had (1) manic depression, bipolar disorder, or mania; (2) a depressive disorder; (3) schizophrenia or another psychotic disorder; (4) post-traumatic stress disorder; (5) another anxiety disorder, such as panic disorder or obsessive compulsive disorder; (6) a personality disorder, such as antisocial or borderline personality; or (7) a mental or emotional condition other than those listed above?” Inmates who answered positively to this question were considered to have a history of a mental health problem. The time period in which an inmate was told they had a mental disorder is unknown (e.g., told last week or last year). This measure is also affected by a person’s access to professional mental health care. These two indicators are not mutually exclusive. An inmate could have met the threshold for SPD and a history of a mental health disorder. Relatedly, an inmate may have met the threshold for SPD, but not have ever been told by a mental health professional that they had a mental disorder. Or, they could have been told they had a mental disorder but did not meet the threshold for SPD. Trends are not presented because prior inmate surveys did not include the K6 scale. In addition, prior BJS inmate surveys were collected with different modes (e.g., audio computer assisted self-interview versus computer-assisted personal interviewing). This could introduce bias when comparing prevalence estimates of mental health indicators across survey years. INDICATORS OF MENTAL HEALTH PROBLEMS REPORTED BY PRISONERS AND JAIL INMATES, 2011-12 | JUNE 2017 2 Prisoners and jail inmates were more likely to have ever been told they had a major depressive disorder than other mental disorders Prisoners and jail inmates were three to five times as likely to have met the threshold for SPD as adults in the general U.S. population Prisoners and jail inmates who had been told in the past by a mental health professional that they had a mental disorder were asked to specify the disorder. Nearly a quarter (24%) of the prisoners who had ever been told they had a mental disorder said they were told they had major depressive disorder, a larger percentage than any other mental disorder (table 1). The second most common disorder reported by prisoners was bipolar disorder (18%). An estimated 13% of prisoners reported they were told they had post-traumatic stress disorder (PTSD) or a personality disorder, such as antisocial or borderline personality disorder. Less than 1 in 10 (9%) prisoners said they were told they had schizophrenia or another psychotic disorder. The percentage of prisoners who met the threshold for SPD (14%) was more than three times that of adults in the standardized total U.S. general population (5%) or those in the standardized general U.S. population with no criminal involvement in the past year (4%) (figure 2). However, the percentage of prisoners who met the threshold for SPD was almost the same as those in the standardized general population who had been arrested (13%) in the year prior to the interview. Of those jail inmates with a history of a mental health problem, 31% had been told they had major depressive disorder, compared to being told they had bipolar disorder (25%), an anxiety disorder (18%), or PTSD (16%). With the exception of personality disorder, jail inmates were more likely than prisoners to have been told they had each type of mental disorder. TABLE 1 Prevalence of mental health indicators among prisoners and jail inmates, by type of indicator, 2011–2012 Mental health indicator No indication of a mental health problema Current indicator of a mental health problemb Serious psychological distressc History of a mental health problem Ever told by mental health professional they had mental disorder Major depressive disorder Bipolar disorder Schizophrenia/other psychotic disorder Post-traumatic stress disorder Anxiety disorderd Personality disordere Prisoners* 49.9% FIGURE 2 Prisoners and adult general population who met the threshold for serious psychological distress, 2009–2012 Prisoners* a Adult general population** — Total With no criminal involvement**b Under supervision**c Arrested**d Jail inmates 36.0%** 14.5% 26.4%** 36.9% 24.2 17.5 44.3%** 30.6** 24.9** 8.7 12.5 11.7 13.0 11.7** 15.9** 18.4** 13.5 Note: See appendix table 4 for standard errors. *Comparison group. **Difference with the comparison group is significant at the 95% confidence level. aIncludes persons with a score of 7 or less on the K6 scale and who had never been told by a mental health professional they had a mental disorder. bCurrent at time of the interview. cIncludes persons with a score of 13 or more on the K6 scale. See Methodology. dIncludes panic disorder and obsessive compulsive disorder, and excludes post-traumatic stress disorder. eIncludes antisocial and borderline personality disorder. Source: Bureau of Justice Statistics, National Inmate Survey, 2011–2012. 0 3 6 9 12 15 Percent Note: Includes persons with a score of 13 or more on the K6 scale. See Methodology. See appendix table 5 for percentages, standard errors, and significance tests. *Comparison group. **Difference with the comparison group is significant at the 95% confidence level. aGeneral population estimates were standardized to the prison population based on sex, race, Hispanic origin, and age. bIncludes respondents from the 2009–2012 NSDUH who indicated they had not been arrested or on probation or parole in the past 12 months. cIncludes respondents from the 2009–2012 NSDUH who indicated they had been on probation or parole in the past 12 months. dIncludes respondents from the 2009–2012 NSDUH who indicated they had been arrested in the past 12 months. Source: Bureau of Justice Statistics, National Inmate Survey, 2011–2012; and Substance Abuse and Mental Health Services Administration, National Survey on Drug Use and Health (NSDUH), 2009–2012. INDICATORS OF MENTAL HEALTH PROBLEMS REPORTED BY PRISONERS AND JAIL INMATES, 2011-12 | JUNE 2017 3 The percentage of jail inmates who met the threshold for SPD (26%) was five times higher than the percentage of adults who met the threshold for SPD in the total standardized general U.S. population (5%) or those in the standardized general population with no criminal involvement in the past year (4%) (figure 3). The percentage of jail inmates who met the threshold for SPD was almost double the percentage of adults in the standardized general population who had SPD who were on probation or parole (11%) or who had been arrested in the past year (14%). Female prisoners and jail inmates were more likely to have met the threshold for SPD than males A larger percentage of female prisoners than male prisoners met the threshold for SPD or had been told by a mental health professional that they had a mental health disorder (table 2). Among prisoners, 20% of females and 14% of males met the threshold for SPD. More females (66%) than males (35%) in prison also had a history of a mental health problem. Like prisoners, a larger percentage of female jail inmates (32%) met the threshold for SPD FIGURE 3 Jail inmates and adult general population who met the threshold for serious psychological distress, 2009–2012 than male jail inmates (26%). Females in jail (68%) were also more likely to have been told they had a mental disorder than males in jail (41%). Seventeen percent of white prisoners met the threshold for SPD, which was larger than the percentage of black (12%) and Hispanic (12%) prisoners with SPD. Inmates of other races (20%) were more likely than white prisoners to have met the threshold for SPD. White prisoners (50%) were also more likely than black prisoners (30%) to have ever been told they had a mental disorder. An estimated 48% of prisoners of other races had ever been told they had a mental disorder, which did not statistically differ from their white counterparts. The pattern of SPD among jail inmates by race and Hispanic origin was also similar to that of prisoners. An estimated 31% of white jail inmates met the threshold for SPD, which was larger than the 22% of black jail inmates and 23% of Hispanic jail inmates. White (57%) jail inmates were also more likely than black (36%) or Hispanic (31%) jail inmates to have ever been told they had a mental disorder. TABLE 2 Prevalence of mental health indicators among prisoners and jail inmates, by demographic characteristics, 2011–2012 Serious psychological distressa Prisoners Jail inmates 14.5% 26.4% Jail inmates* a Adult general population**Total — With no criminal involvement**b Under supervision**c Arrested**d 0 5 10 15 Percent 20 25 30 Note: Includes persons with a score of 13 or more on the K6 scale. See Methodology. See appendix table 6 for percentages, standard errors, and significance tests. *Comparison group. **Difference with the comparison group is significant at the 95% confidence level. aGeneral population estimates were standardized to the jail population based sex, race, Hispanic origin, and age. bIncludes respondents from the 2009–2012 NSDUH who indicated they had not been arrested or on probation or parole in the past 12 months. cIncludes respondents from the 2009–2012 NSDUH who indicated they had been on probation or parole in the past 12 months. dIncludes respondents from the 2009–2012 NSDUH who indicated they had been arrested in the past 12 months. Source: Bureau of Justice Statistics, National Inmate Survey, 2011–2012; and Substance Abuse and Mental Health Services Administration, National Survey on Drug Use and Health (NSDUH), 2009–2012. Characteristic All inmates Sex Male* 14.0% Female 20.5** Race/Hispanic originc White* 17.3% Black 12.5** Hispanic 11.5** Otherd 19.7** Age 18–24* 14.9% 25–34 14.8 35–44 14.1 45–54 15.1 55–64 13.1 65 or older 9.5** History of a mental health problemb Prisoners Jail inmates 36.9% 44.3% 25.5% 32.3** 34.8% 65.8** 40.8% 67.9** 31.0% 22.3** 23.2** 31.5 50.5% 30.0** 25.6** 47.9 56.8% 36.2** 31.3** 55.8 26.3% 25.9 26.1 28.8** 25.2 20.2 36.3% 37.3 36.4 37.9 37.3 30.8** 42.3% 43.6 44.4** 47.7** 50.4** 39.9 Note: See appendix table 7 for standard errors. *Comparison group. **Difference with the comparison group is significant at the 95% confidence level. aIncludes inmates with a score of 13 or more on the K6 scale. See Methodology. bIncludes inmates who reported they had ever been told by a mental health professional they had a mental disorder. cExcludes persons of Hispanic or Latino origin, unless specified. dIncludes American Indian or Alaska Natives; Asian, Native Hawaiian, or Other Pacific Islanders; and persons of two or more races. Source: Bureau of Justice Statistics, National Inmate Survey, 2011–2012; and Substance Abuse and Mental Health Services Administration, National Survey on Drug Use and Health, 2009-2012. INDICATORS OF MENTAL HEALTH PROBLEMS REPORTED BY PRISONERS AND JAIL INMATES, 2011-12 | JUNE 2017 4 Prisoners age 65 or older were less likely to have a mental health indicator, compared to other age groups There was little variation in the prevalence estimates of mental health indicators among prisoners by age group. One in six (15%) prisoners ages 18 to 64 reported experiences that met the threshold for SPD (not shown). Prisoners age 65 or older (10%) were less likely than prisoners ages 18 to 24 (15%) to have met the threshold for SPD. Similarly, the percentage of prisoners who had ever been told they had a mental disorder also varied little across age groups. An estimated 37% of prisoners in each age category, from ages 18 to 64, reported ever being told they had a mental disorder. A smaller percentage of prisoners age 65 or older (31%) than prisoners ages 18 to 24 (36%) had ever been told they had a mental disorder. Prevalence estimates of SPD among jail inmates varied somewhat by age. An estimated 26% of jail inmates ages 18 to 44 and ages 55 to 64 reported experiences that met the threshold for SPD. Jail inmates ages 45 to 54 (29%) were more likely to have met the threshold for SPD than those ages 18 to 24 (26%). Approximately 42% of jail inmates ages 18 to 24 met the threshold for SPD, compared to those ages 35 to 44 (44%), ages 45 to 54 (48%), and ages 55 to 64 (50%). Prisoners who were married were less likely to have met the threshold for SPD than prisoners with other marital statuses Married prisoners (12%) were less likely to have met the threshold for SPD than prisoners who were widowed (18%), divorced (15%), separated (16%), or never married (15%) (table 3). Married prisoners (31%) were also less likely to have ever been told they had a mental disorder than prisoners with other marital statuses. An estimated 28% of married jail inmates met the threshold for SPD, which was similar to the percentage of widowed (31%), divorced (28%), or separated (29%) jail inmates who met the threshold for SPD. However, the percentage of never married jail inmates who met the threshold for SPD (25%) was less than the percentage of married jail inmates who had SPD (28%). Married jail inmates were the least likely to have ever been told they had a mental disorder (40%) when compared to inmates with other marital statuses. Approximately 58% of jail inmates who were widowed, 51% who were divorced, 50% who were separated, and 43% who were never married had ever been told they had a mental disorder. Prisoners and jail inmates with a college degree were more likely than high school graduates to have a history of a mental health problem An estimated 16% of prisoners with less than a high school education met the threshold for SPD. This was larger than the percentage who met the threshold for SPD and who were high school graduates (12%) or who had a college degree or more (13%). An estimated 38% of prisoners with less than a high school degree had ever been told they had a mental disorder, compared to 32% of those with a high school degree. However, prisoners with at least a college degree (41%) were more likely than those without a high school degree or equivalent (38%) to have been told they had a mental disorder. Among jail inmates, 27% of those with less than a high school education met the threshold for SPD. This did not statistically differ from the percentage of jail inmates with some college education (26%). An estimated 45% of jail inmates with less than a high school degree had ever been told they had a mental disorder, compared to 39% with a high school degree or equivalent, 47% with some college, and 50% of those with a college degree or more. TABLE 3 Indicators of a mental health problem among prisoners and jail inmates, by marital status and education, 2011–2012 Characteristic All inmates Marital status Married* Widowed Divorced Separatedc Never married Education Less than high school* High school graduate Some college College degree or more Serious psychological distressa Prisoners Jail inmates 14.5% 26.4% History of a mental health problemb Prisoners Jail inmates 36.9% 44.3% 12.2% 18.4** 15.4** 15.8** 14.6** 28.3% 31.3 27.9 28.7 25.0** 30.8% 45.0** 42.9** 38.1** 36.6** 39.8% 58.2** 51.2** 49.6** 43.0** 15.6% 12.1** 13.9 13.4** 27.1% 24.4** 26.4 28.2** 37.5% 32.1** 39.3 40.7** 45.2% 38.8** 47.2** 49.8** Note: See appendix table 8 for standard errors. *Comparison group. **Difference with the comparison group is significant at the 95% confidence level. aIncludes inmates with a score of 13 or more on the K6 scale. See Methodology. bIncludes inmates who reported they had ever been told by a mental health professional they had a mental disorder. cFor reasons other than incarceration. Source: Bureau of Justice Statistics, National Inmate Survey, 2011–2012. The percentage of prisoners incarcerated for a violent offense who met the threshold for SPD was similar to those incarcerated for a property offense who met the threshold for SPD Prisoners incarcerated for a violent offense (17%) or a property crime (16%) were equally likely to have met the threshold for SPD (table 4). Likewise, the percentage of prisoners incarcerated for a violent offense who had a history of a mental health disorder (42%) was similar to the percentage of prisoners incarcerated for a property offense (41%) who had a mental health disorder. Prisoners incarcerated for a violent crime were more likely to have met the threshold for SPD than those incarcerated for a drug crime (10%), DWI/DUI (14%), or other public order offense (13%). Among prisoners with a history of a mental health problem, those incarcerated for a drug offense (27%), a DWI/DUI (32%), or other public order offense (36%) were less likely to have ever been told they had a mental disorder than prisoners incarcerated for a violent offense (42%). TABLE 4 Indicators of a mental health problem among prisoners and jail inmates, by current offense, sentence status and length, and time served, 2011–2012 Serious psychological distressa Offense and time served Prisoners Jail inmates Most serious offense Violent* 16.6% 29.2% Property 15.6 27.1** Drug 10.2** 24.6** DWI/DUI 14.0** 23.5** 13.2** 25.9** Other public orderc Sentence status Unsentenced* : 23.3% Sentenced : 29.3** Sentence lengthd Less than 1 year* 14.9% 22.5% 1–4 years 13.0 22.4 5 years or more 14.5 25.3** Life sentence 17.4 : Time served since admission to current facility Less than 1 month* 16.6% 29.3% 1–5 months 14.8 25.8** 6–11 months 15.2 23.3** 1–4 years 13.7** 23.6** 5 years or more 14.1 : History of a mental health problemb Prisoners Jail inmates 41.7% 41.4 26.8** 32.4** 35.6** 47.9% 49.8 39.8** 37.9** 45.4** : : 43.7% 45.1 35.7% 35.9 37.3 38.9 42.9% 45.6** 44.7 : 38.4% 37.0 38.9 35.5 37.7 43.9% 45.2 43.6 41.1 : Note: See appendix table 9 for standard errors. : Not calculated. *Comparison group. **Difference with the comparison group is significant at the 95% confidence level. aIncludes inmates with a score of 13 or more K6 scale. See Methodology. bIncludes inmates who reported they had ever been told by a mental health professional they had a mental disorder. cExcludes DWI/DUI. dExcluded unsentenced inmates. Source: Bureau of Justice Statistics, National Inmate Survey, 2011–2012. An estimated 29% of jail inmates incarcerated for a violent offense met the threshold for SPD. This was larger than the percentage of jail inmates incarcerated for a property offense (27%), a drug offense (25%), a DWI/DUI (24%), or other public order offense (26%). The percentage of jail inmates incarcerated for a violent crime who had ever been told they had a mental disorder (48%) did not statistically differ from the percentage of jail inmates incarcerated for a property offense (50%). However, this was higher than the percentage incarcerated for a drug (40%), DWI/DUI (38%), or other public order (45%) offense. The percentage of prisoners who met the threshold for SPD did not differ by sentence length Among sentenced prisoners, those sentenced to 1 to 4 years (13%), 5 years or more (14%), or a life sentence (17%) were as likely to have met the threshold for SPD as prisoners sentenced to less than 1 year (15%). There was no statistical difference across sentence length in the percentage of prisoners who reported they had ever been told they had a mental disorder (about 36% across sentence length categories). Unsentenced jail inmates (23%) were less likely than sentenced jail inmates (29%) to have met the threshold for SPD. There was no statistical difference between the percentage of unsentenced (44%) and sentenced (45%) jail inmates who had ever been told they had a mental disorder. Compared to jail inmates with a sentence of less than 1 year (22%), those with a sentence of 5 years or more (25%) were more likely to have met the threshold for SPD. The percentage of inmates who had ever been told they had a mental disorder did not differ by time served since admission Among prisoners, 17% who had served less than 1 month since admission in the current facility met the threshold for SPD. This percentage was not statistically different than the percentage who had served 1 to 5 months (15%), 6 to 11 months (15%), or 5 years or more (14%). However, prisoners who had served 1 to 4 years (14%) were less likely to have met the threshold for SPD, compared to those with less than 1 month time served (17%). There was no difference by time served and the percentage of prisoners who had ever been told they had a mental disorder, averaging 37% across time served groups. Jail inmates who had served less than 1 month were more likely to have met the threshold for SPD (29%) than inmates who had been in the current facility for 1 to 5 months (26%), 6 to 11 months (23%), or 1 to 4 years (24%) since admission. As was the case with prisoners, there was no difference by time served and the percentage of jail inmates who reported that they had been told they had a mental disorder (about 43%). INDICATORS OF MENTAL HEALTH PROBLEMS REPORTED BY PRISONERS AND JAIL INMATES, 2011-12 | JUNE 2017 6 A larger percentage of prisoners and jail inmates with more than one arrest than those with one arrest had been told they had a mental disorder Prisoners with more than one arrest were more likely to have a mental health indicator than prisoners with one arrest (table 5). Twelve percent of prisoners with one arrest met the threshold for SPD, compared to 14% of those with 2 to 3 arrests, 15% with 4 to 10 arrests, and 18% with 11 or more arrests. Prisoners with one arrest (27%) were less likely to have ever been told they had a mental disorder than all other prisoners. For example, among prisoners who reported 11 or more arrests in their lifetime, 49% had been told at some point that they had a mental disorder. TABLE 5 Indicators of a mental health problem among prisoners and jail inmates, by criminal history, 2011–2012 Serious psychological History of a mental distressa health problemb c Prisoners Jail inmates Prisoners Jail inmatesc Criminal history Number of times arrested (lifetime) 1 time* 12.1% 2–3 times 13.5** 4–10 times 14.6** 11 times or more 18.1** Total time in a correctional facility prior to current facilityd None* 13.4% 1–5 months 14.3 6–11 months 13.7 1–4 years 13.4 5 years or more 16.5** 23.4% 23.8 23.2 25.3 27.0% 32.0** 39.6** 48.9** 30.8% 36.7** 46.7** 55.9** 24.6% 24.1 23.9 22.5** 24.9 28.7% 35.4** 37.0** 37.8** 42.6** 35.1% 41.0** 45.4** 46.9** 54.0** Note: See appendix table 10 for standard errors. *Comparison group. **Difference with the comparison group is significant at the 95% confidence level. aIncludes inmates with a score of 13 or more on the K6 scale. See Methodology. bIncludes inmates who reported they had ever been told by a mental health professional they had a mental disorder. cIncludes jail inmates who served 3 months or more since admission to current facility. dTotal time incarcerated as an adult or juvenile in a prison, jail, or other correctional facility prior to admission to the current facility. Source: Bureau of Justice Statistics, National Inmate Survey, 2011–2012. Unlike prisoners, the percentage of jail inmates who met the threshold for SPD did not increase with number of arrests. About 24% of jail inmates in each arrest category met the threshold for SPD. Like prisoners, jail inmates with multiple arrests were more likely to have been told they had a mental disorder. More than half (56%) of jail inmates who had been arrested 11 times or more had been told they had a mental disorder, compared to a third (31%) of jail inmates with one arrest. Prisoners who spent 5 years or more previously incarcerated were more likely to have met the threshold for SPD than those with no prior time served Total time incarcerated in a correctional facility includes the time spent as an adult or juvenile in a prison, jail, or other correctional facility prior to admission to the current facility. Among prisoners who met the threshold for SPD, there was no statistical difference between those with no prior incarceration time (13%) and those who spent up to 5 years incarcerated (an average of 14%). However, prisoners who spent 5 years or more total time in a prior correctional facility (17%) were more likely than those with no prior incarceration time (13%) to have met the threshold for SPD. Prisoners with no prior incarceration time were the least likely to have been told they had a mental disorder (29%). An estimated 37% of prisoners who were previously incarcerated for 6 to 11 months, 38% of those incarcerated for 1 to 4 years, and 43% of those incarcerated for 5 years or more had been told they had a mental disorder. Twenty-five percent of jail inmates with no prior incarceration time met the threshold for SPD, which was more than the 22% of jail inmates incarcerated for 1 to 4 years. Jail inmates with no prior incarceration (35%) were less likely than inmates with any prior incarceration (41% to 54%) to have been told they had a mental disorder. More than half (54%) of jail inmates incarcerated for 5 years or more had been told they had a mental disorder. INDICATORS OF MENTAL HEALTH PROBLEMS REPORTED BY PRISONERS AND JAIL INMATES, 2011-12 | JUNE 2017 7 Almost three-quarters of inmates who met the threshold for SPD had received mental health treatment in their lifetime Approximately 3 in 4 prisoners (74%) and jail inmates (73%) who met the threshold for SPD said they had received mental health treatment in their lifetime (table 6). About 42% of prisoners and 43% of jail inmates who met the threshold for SPD said they had stayed overnight in a hospital, and about 62% said they had taken prescription medication during their lifetime for a mental health problem. Of prisoners who had been told they had a mental disorder, 88% said they had received mental health treatment in their lifetime, including 45% had stayed overnight in a hospital, 76% had received prescription medicine, and 75% had received counseling or therapy. Among jail inmates, 90% of those who had ever been told they had a mental disorder received mental health treatment in their lifetimes, including 80% who had received prescription medication. Prisoners who had a mental health indicator were more likely than similar jail inmates to have received treatment since admission to their current facility More than half (54%) of prisoners who met the threshold for SPD had received mental health treatment since admission to the current facility, compared to a third (35%) of jail inmates. An estimated 46% of prisoners who met the threshold for SPD had received prescription medication, 42% had received counseling or therapy, and 34% had received prescription medication and counseling or therapy. Among jail inmates who met the threshold for SPD, 30% had received prescription medication, 18% had received counseling or therapy, and 13% had received prescription medication and counseling or therapy since admission. Prisoners who had ever been told they had a mental disorder (63%) were more likely than jail inmates (44%) to have received treatment since admission. Among those with a mental health problem, a greater percentage of prisoners (49%) than jail inmates (24%) had received counseling or therapy. Likewise, a greater percentage of prisoners (39%) than jail inmates (18%) with a mental health problem had received a combination of counseling or therapy and prescription medication. About a third of inmates with a mental health indicator were currently receiving treatment Inmates who had a mental health indicator were also asked if they were currently receiving treatment for a mental health problem. An estimated 36% of prisoners and 30% jail inmates who met the threshold for SPD said they were receiving treatment for a mental health problem as of the time of the interview. There was no statistical difference between the percentage of prisoners and jail inmates who met the threshold for SPD and said they were currently receiving prescription medication (29% of prisoners and 26% of jail inmates). Jail inmates who met the threshold for SPD were half as likely to report receiving counseling or therapy (13%) as prisoners who met the threshold for SPD (26%). TABLE 6 Mental health treatment received by prisoners and jail inmates with an indicator of a mental health problem, by type of indicator, time period, and treatment type, 2011–2012 Time period and treatment type Ever received mental health treatment during lifetime Ever overnight hospital stayc Ever taken prescription medication Ever had counseling/therapy from trained professionald Mental health treatment since admission Prescription medication Counseling/therapy from trained professionald Prescription medication and counseling/therapy Currently treated for a mental health probleme Prescription medication Counseling/therapy from trained professionald Prescription medication and counseling/therapy Serious psychological distressa Prisoners* Jail inmates 74.2% 72.7% 41.8 43.1 62.8 61.3 60.9 54.9** 54.3% 35.0%** 45.8 30.0** 42.2 17.8** 33.9 12.9** 35.6% 29.7%** 29.1 25.7 25.8 12.6** 19.5 8.7** History of a mental health problemb Prisoners* Jail inmates 88.1% 90.3%** 44.8 51.3** 76.4 80.4** 74.6 73.9 63.0% 44.5%** 52.6 38.3** 48.9 23.5** 38.7 17.5** 37.0% 37.8% 29.9 33.0 26.7 16.4** 19.7 11.8** Note: See appendix table 11 for standard errors. *Comparison group. **Difference with the comparison group is significant at the 95% confidence level. aIncludes inmates with a score of 13 or more on the K6 scale. See Methodology. bIncludes inmates who reported they had ever been told by a mental health professional they had a mental disorder. cIncludes inmates who stayed overnight or longer in any type of hospital or other facility to receive treatment or counseling for any problems with their emotions, nerves, or mental health. dIncludes a psychiatrist, psychologist, social worker, or nurse. eAs of the time of the interview. Source: Bureau of Justice Statistics, National Inmate Survey, 2011–2012. INDICATORS OF MENTAL HEALTH PROBLEMS REPORTED BY PRISONERS AND JAIL INMATES, 2011-12 | JUNE 2017 8 Among inmates who had ever been told they had a mental disorder, 37% of prisoners and 38% of jail inmates said they were currently receiving treatment for a mental health problem. An estimated 30% of each group said they were currently taking prescription medication. Prisoners and jail inmates who met the threshold for SPD were more likely than those without SPD to be written up or charged with an assault while incarcerated Prisoners and jail inmates were asked if they had been written up or charged with assaulting an inmate, physically assaulting a correctional officer or staff, or verbally assaulting a correctional office or staff since admission to the current facility.2 Compared to prisoners without an indicator of a mental health problem (4%), prisoners 2Estimates who met the threshold for SPD (14%), or who had ever been told they had a mental disorder (12%) were more likely to be written up or charged with a verbal or physical assault against a correctional officer, staff, or assault of another inmate (table 7). Three percent of prisoners with no indicator of a mental health problem were written up or charged with assaulting another inmate, compared to 9% of prisoners who met the threshold for SPD and 7% of those who had been told they had a mental disorder. Among jail inmates with no indicator of a mental health problem, 4% were written up or charged with assault. This group was less likely to be written up or charged with assault than jail inmates who met the threshold for SPD (10%) or who had been told they had a mental disorder (10%). derived from the 90% sample only. See Methodology. TABLE 7 Prisoners and jail inmates written up or charged with assault, by mental health status, 2011–2012 Type of assault Total Verbal assault of correctional officer or other staff Physical assault of correctional officer or other staff Assault against another inmate No indicator of mental health problem*a Prisoners Jail inmates 4.1% 4.2% 1.6 1.6 0.4 0.4 2.7 2.9 Serious psychological distressb Prisoners Jail inmates 14.2%** 9.7%** 6.8** 4.6** 2.8** 1.3** 8.5** 6.2** History of a mental health problemc Prisoners Jail inmates 11.6%** 9.9%** 5.7** 4.6** 1.9** 1.2** 7.0** 6.6** Note: Data comes from the 90% sample only. See Methodology. See appendix table 12 for standard errors. *Comparison group. **Difference with the comparison group is significant at the 95% confidence level. aIncludes inmates with a score of 7 or less on the K6 scale and who had never been told by a mental health professional they had a mental disorder. bIncludes inmates with a score of 13 or more on the K6 scale. See Methodology. cIncludes inmates who reported they had ever been told by a mental health professional they had a mental disorder. Source: Bureau of Justice Statistics, National Inmate Survey, 2011–2012. INDICATORS OF MENTAL HEALTH PROBLEMS REPORTED BY PRISONERS AND JAIL INMATES, 2011-12 | JUNE 2017 9 Methodology The 2011-12 National Inmate Survey The 2011-12 National Inmate Survey (NIS-3) was conducted in 233 state and federal prisons, 358 jails, and 15 special facilities (military, Indian country, and Immigration and Customs Enforcement (ICE) facilities) between February 2011 and May 2012. The data were collected by RTI International under a cooperative agreement with the Bureau of Justice Statistics (BJS). The NIS-3 administered two questionnaires to inmates: a survey about sexual victimization and an alternative survey about mental and physical health, past drug and alcohol use, and treatment for substance abuse. Inmates were randomly assigned to receive one of the two questionnaires so that, at the time of the interview, the content of the survey remained unknown to facility staff and the interviewers. A total of 106,532 inmates participated in NIS-3, receiving either the sexual victimization survey or the randomly assigned alternative survey. Combined, the surveys were administered to inmates in state and federal prisons (43,721), jails (61,351), military facilities (605), Indian country jails (192), and ICE facilities (663). The interviews, which averaged 35 minutes in length, used computer-assisted personal interviewing (CAPI) and audio computer-assisted self-interviewing (ACASI) data collection methods. For approximately the first 2 minutes, interviewers conducted a personal interview using CAPI to obtain background information and the date of admission to the facility. For the remainder of the interview, inmates interacted with a computer-administered questionnaire using a touchscreen and synchronized audio instructions delivered via headphones. Respondents completed the ACASI portion of the interview in private, with the interviewer either leaving the room or moving away from the computer. The entire ACASI questionnaire (listed as the National Inmate Survey-3) is available on the BJS website. A shorter paper questionnaire (PAPI) was made available for inmates who were unable to come to the private interviewing room or interact with the computer. The paper form was completed by 751 prisoners (1.9% of all prisoner interviews) and 264 jail inmates (0.5% of all jail inmate interviews). Those who completed the PAPI were not asked about their physical health, mental health, past drug and alcohol use, or treatment for substance abuse. Additional information on the methodology for sample selection of facilities and inmates can be found in Sexual Victimization in Prisons and Jails Reported by Inmates, 2011–12 (NCJ 241399, BJS web, May 2013). Mental health module The analysis of the mental health module was restricted to adult prisoners or jail inmates. Juvenile inmates who were 16 or 17 years of age and inmates in military, Indian country, or ICE facilities were excluded from this report. To determine whether inmates had an indicator of a current mental health problem, the NIS-3 included the Kessler 6 scale for nonspecific psychological distress (see Measurement of mental health indicators text box). The NIS-3 also included questions to assess whether or not an inmate had a history of a mental health problem, defined as having ever been told by a mental health professional that they had a mental disorder. The mental health indicator questions were contained in a mental health screener that was part of a mental health module. Among inmates who received the sexual victimization survey (90% of inmates surveyed), all inmates received the mental health screener component. Respondents who completed the core sexual victimization survey in less than 35 minutes were eligible to receive the follow-up mental health component. Respondents who did not indicate a mental health problem legitimately skipped the items in the detailed follow up. Based on these threshold, within prisons 37,359 inmates received the mental health screener questions. Among those respondents, 84% (31,508 prisoners) were eligible to receive the detailed mental health follow-up items. Among jail respondents, 52,384 inmates received the mental health screener items. Among those, 92% (48,338 jail inmates) were eligible to receive the detailed mental health follow-up items. Among inmates who received the alternative survey on mental and physical health, past drug and alcohol use, and treatment for substance abuse (10% of inmates surveyed), both mental health components were administered to prisoners and jail inmates. All 4,304 prisoners and 6,704 jail inmates who were randomized to the alternative survey received the full mental health module. Nonresponse bias analysis Bias occurs when the estimated prevalence of an outcome is different from the actual prevalence of the outcome for a given facility. One potential source of bias is nonresponse. For each survey in the NIS-3, a nonresponse bias analysis was conducted to determine whether inmates did not receive the mental health module due to it only being administered in ACASI. The PAPI respondents were found to have a higher prevalence of sexual victimization and more likely to reside in administrative segregation. These two conditions may be correlated to an inmate’s mental health status. Given that the PAPI respondents made up 1.9% of prisoners and 0.5% of jail inmates, it was determined that a weight adjustment could reduce the potential bias due to PAPI respondents not receiving the mental health screener items. INDICATORS OF MENTAL HEALTH PROBLEMS REPORTED BY PRISONERS AND JAIL INMATES, 2011-12 | JUNE 2017 10 Weighting and nonresponse adjustments Responses from interviewed inmates were weighted to produce national-level estimates. Each interviewed inmate was assigned an initial weight corresponding to the inverse of the probability of selection within each sampled facility. A series of adjustment factors was applied to the initial weight to minimize potential bias due to nonresponse and to provide national estimates. For the analysis of the mental health module, these adjustments were one of two types: 1. adjustments to account for survey nonresponse 2. adjustments to account for survey mode nonresponse. Methods to adjust for survey nonresponse are described in detail in Sexual Victimization in Prisons and Jails Reported by Inmates, 2011-12 (NCJ 241399, BJS web, December 2014). Bias could result if the PAPI respondents were different from the ACASI respondents. The adjustment for mode nonresponse included a calibration of the weights so that the weight from a PAPI respondent was assigned to an ACASI respondent with similar characteristics. Because both ACASI and PAPI respondents provided demographic and criminal history information, these data were used in weight adjustment. For each inmate, these adjustments were based on a generalized exponential model, developed by Folsom and Singh (2002), and applied to the sexual victimization survey respondents.3 The mode nonresponse adjustment maintained the bench marked totals designed to make national-level estimates for the total number of inmates age 18 or older who were held in jails at midyear 2011 or in prison at yearend 2011. These benchmark totals represented the estimated number of inmates by sex, from BJS’s 2011 Annual Survey of Jails and 2011 National Prisoner Statistics. The national estimates for state prisons were 1,154,600 adult males and 83,400 adult females; for federal prisons, 190,600 adult males and 13,200 adult females; and for jails (with an average daily population of six or more inmates), 628,620 adult males, and 91,551 adult females. After the adjustment for potential nonresponse bias, a final adjustment was conducted to combine the data from the sexual victimization survey and the alternative survey. For this adjustment, the weight for each responding inmate was multiplied by the probability of receiving the survey type received. In other words, the survey nonresponse and mode 3Folsom, Jr., R. E., & Singh, A. C. (2002). The generalized exponential model for sampling weight calibration for extreme values, nonresponse, and poststratification. Proceedings of the American Statistical Association, Survey Research Methods Section, 598-603. nonresponse adjusted weight for the ACASI respondents were multiplied by 0.90 and for respondents to the sexual victimization survey and alternative survey. Comparison of estimates by NIS-3 survey type Prior to producing estimates from the combined set of sexual victimization and alternative survey respondents, a comparison of key estimates was conducted. This was done to ensure that questions on sexual victimization did not alter how inmates responded to the mental health screener items, compared to inmates that were not asked about their sexual victimization status. Using the analysis weights created for each survey, estimates were produced and tested to determine if they were significantly different. For all key estimates, the sexual victimization and alternative survey respondents had statistically similar estimates. Therefore, it was determined that the combined data could be used for all analyses. Standard errors and tests of significance As with any survey, the NIS-3 estimates are subject to error arising from their basis on a sample rather than a complete enumeration of the population of adult inmates in prisons and jails. For each mental health indicator, the estimated sampling error varies by the size of the estimate, number of completed interviews, and intra-cluster correlation of the outcome within facilities. A common way to express this sampling variability is to construct a 95% confidence interval around each survey estimate. Typically, multiplying the standard error by 1.96 and then adding or subtracting the result from the estimate produces the confidence interval. This interval expresses the range of values that could result among 95% of the different samples that could be drawn. To facilitate the analysis, rather than provide the detailed estimates for every standard error, differences in the estimates of sexual victimization for subgroups in this report have been tested and notated for significance at the 95% confidence level. For example, the difference in the percentage of female jail inmates who met the threshold for serious psychological distress (SPD) (32.3%) compared to male jail inmates (26.0%) is statistically significant at the 95% confidence level (table 2). In all tables providing detailed comparisons, statistically significant differences at the 95% confidence level or greater have been designated with two asterisks (**). INDICATORS OF MENTAL HEALTH PROBLEMS REPORTED BY PRISONERS AND JAIL INMATES, 2011-12 | JUNE 2017 11 General population estimates Standardization of general population estimates In the general population, prevalence rates of SPD in the past 30 days come from the National Survey on Drug Use and Health (NSDUH). The NSDUH is an annual nationwide survey that provides national and state-wide estimates on the use of tobacco products, alcohol, illicit drugs, and the prevalence of mental health problems among the general U.S. population. Respondents are randomly selected at the household level.4 This sampling method is unlikely to capture persons who are homeless, in temporary shelters, transient or highly mobile, or in hospitals or residential rehabilitation or treatment centers—all populations who may have a higher risk for mental disorders, substance use disorders, or both. When comparing two populations, differences found for some characteristics or conditions may be statistically different as a result of a true difference in the populations or due to basic demographics differences that are associated with the outcome of interest. Standardizing the estimates is one method to determine if these demographic differences are the sole cause for differences found in other characteristics or conditions. To be most comparable to the inmate population included in the NIS-3, the survey years 2009 through 2012 of NSDUH were used in this analysis. While the NIS-3 reference period does not include 2009 or 2010, these years were included to increase the precision in the general population estimates. An analysis of the estimates of general population across the 4 years found that the mental health estimates did not change appreciably during this period. Therefore, including additional years of data to increase precision would not shift the study period estimates enough to alter any comparisons to the 2011-12 inmate population. The NSDUH includes indicators that measure a person’s selfreported past year criminal justice involvement. With this information, the total general population was split into three groups: persons not involved in the criminal justice system during the past 12 months those on probation or parole during the past 12 months those arrested in the past 12 months. Standardization of survey estimates consists of calibrating the survey weights for one population such that, for key demographic characteristics that are known for each population, the distributions are identical. This process was done using SUDAAN’s PROC DESCRIPT procedure. The resulting estimates are not a representation of the standardized population by themselves (i.e., generalizations about the population cannot be made from standardized estimates), but are appropriate estimates for comparison with other populations of interest. In this report, estimates were standardized for each of the four general population types (e.g., the total general population and three criminal justice involvement subgroups). For each general population type, estimates were standardized to the inmate populations’ distribution by sex, race, Hispanic origin, and age. Because the inmate populations for prisoners and jail inmates differed, the general population was standardized separately to each inmate population (see appendix tables 1 and 2). Figure 2 includes standardized estimates to the prison population. Figure 3 includes standardized estimates to the jail population. These groups are not mutually exclusive in that a person can be both on probation or parole and have been arrested in the past 12 months. It is assumed that persons in the general population on probation and parole or those arrested in the past 12 months are more similar to the inmate populations than those not involved with the criminal justice system during the past 12 months. 4SAMHSA. NSDUH - About the Survey. Retrieved on March 30, 2016 from https://nsduhweb.rti.org/respweb/project_description.html. INDICATORS OF MENTAL HEALTH PROBLEMS REPORTED BY PRISONERS AND JAIL INMATES, 2011-12 | JUNE 2017 12 APPENDIX TABLE 1 Characteristics of prisoners and jail inmates, 2011–2012 Prisonersa* Number Percent 1,441,800 100% Characteristic All inmates Sex Male 1,345,200 Female 96,600 Race/Hispanic originb White 430,300 Black 506,100 Hispanic 341,400 Otherc 147,500 Age 18–24 179,600 25–34 458,500 35–44 397,800 45–54 281,800 55–64 98,800 65 or older 25,300 Marital status Married 270,800 Widowed 26,400 Divorced 286,700 Separatedd 87,200 Never married 761,100 Education Less than high school 825,000 High school graduate 283,400 Some college 230,100 College degree or more 99,600 Jail inmates Number Percent 720,200 100% 93.3% 6.7 628,600 91,600 87.3%** 12.7** 30.2% 35.5 24.0 10.3 242,600 237,500 158,000 74,100 34.1%** 33.3 22.2 10.4 12.5% 31.8 27.6 19.5 6.9 1.8 186,000 251,100 150,700 102,400 26,200 3,800 25.8%** 34.9** 20.9** 14.2** 3.6** 0.5** 18.9% 1.8 20.0 6.1 53.1 134,900 11,600 104,000 52,800 412,000 18.9% 1.6 14.5** 7.4** 57.6** 57.4% 382,300 53.4%** 19.7 16.0 166,900 120,500 23.3** 16.8 6.9 46,500 6.5 Note: See appendix table 2 for standard errors. *Comparison group. **Difference with the comparison group is significant at the 95% confidence level. aIncludes state and federal prisoners. bExcludes persons of Hispanic origin, unless specified. cIncludes American Indian or Alaska Natives; Asian, Native Hawaiian, or Other Pacific Islanders; and persons of two or more races. dFor reasons other than incarceration. Source: Bureau of Justice Statistics, National Inmate Survey, 2011–2012. APPENDIX TABLE 2 Standard errors for appendix table 1: Characteristics of prisoners and jail inmates, 2011–2012 Characteristic All inmates Sex Male Female Race White Black Hispanic Other Age 18–24 25–34 35–44 45–54 55–64 65 or older Marital status Married Widowed Divorced Separated Never married Education Less than high school High school graduate Some college College degree or more Prisoners Number Percent 79,900 Jail inmates Number Percent 32,800 79,800 8,600 0.68% 0.68 29,500 6,500 0.74% 0.74 27,300 38,600 29,300 10,700 1.08% 1.41 1.87 0.39 11,400 15,700 12,800 3,700 1.20% 1.30 1.33 0.34 13,300 25,300 25,800 17,800 7,500 2,300 0.72% 0.61 0.47 0.60 0.33 0.14 8,200 11,300 7,300 6,100 1,600 400 0.38% 0.41 0.29 0.33 0.14 0.05 15,800 1,600 19,600 5,100 47,400 0.78% 0.13 0.59 0.24 1.05 7,500 700 5,100 3,000 18,600 0.44% 0.08 0.34 0.18 0.62 46,800 0.82% 17,100 0.61% 17,500 15,100 0.53 0.44 8,000 6,700 0.41 0.37 6,200 0.25 3,000 0.22 Source: Bureau of Justice Statistics, National Inmate Survey, 2011–2012. APPENDIX TABLE 3 Percentages and standard errors for figure 1: Mental health status of prisoners and jail inmates, by type of mental health indicator, 2011–2012 Prisoners* Jail inmates Standard Standard Mental health indicators Percent error Percent error Serious psychological distress 14.5% 0.46% 26.4%** 0.51% History of a mental health problem 36.9 1.15 44.3** 0.79 No indication of a mental health problem 49.9 1.07 36.0** 0.62 *Comparison group. **Difference with the comparison group is significant at the 95% confidence level. Source: Bureau of Justice Statistics, National Inmate Survey, 2011–2012. INDICATORS OF MENTAL HEALTH PROBLEMS REPORTED BY PRISONERS AND JAIL INMATES, 2011-12 | JUNE 2017 13 APPENDIX TABLE 4 Standard errors for table 1: Prevalence of mental health indicators among prisoners and jail inmates, by type of indicator, 2011–2012 Mental health indicators No indicator of a mental health problem Current indicator of a mental health problem Serious psychological distress History of a mental health problem Ever told by mental health professional they had mental disorder Major depressive disorder Bipolar disorder Schizophrenia/other psychotic disorder Post-traumatic stress disorder Anxiety disorder Personality disorder Prisoners 1.07% Jail inmates 0.62% 0.46% 0.51% 1.15% 0.95 0.75 0.45 0.60 0.59 0.48 0.79% 0.66 0.62 0.43 0.45 0.54 0.32 Source: Bureau of Justice Statistics, National Inmate Survey, 2011–2012. APPENDIX TABLE 5. Percentages and standard errors for figure 2: Prisoners and adult general population who met the threshold for serious psychological distress, 2009–2012 Population Prisoners* Adult general population With no criminal involvement Under supervision Arrested Serious psychological distress Percent Standard error 14.5% 0.46% 4.6** 0.15 4.0** 0.14 10.8** 1.13 13.0 1.12 *Comparison group. **Difference with the comparison group is significant at the 95% confidence level. Source: Bureau of Justice Statistics, National Inmate Survey, 2011–12; Substance Abuse and Mental Health Services Administration, National Survey on Drug Use and Health, 2009–2012. APPENDIX TABLE 6. Percentages and standard errors for figure 3: Jail inmates and adult general population who met the threshold for serious psychological distress, 2009–2012 Serious psychological distress Percent Standard error 26.4% 0.51% 5.1** 0.13 4.5** 0.12 11.4** 0.82 13.8** 0.90 Population Jail inmates* Adult general population With no criminal involvement Under supervision Arrested *Comparison group. **Difference with the comparison group is significant at the 95% confidence level. Source: Bureau of Justice Statistics, National Inmate Survey, 2011–12; Substance Abuse and Mental Health Services Administration, National Survey on Drug Use and Health, 2009–2012. APPENDIX TABLE 7 Standard errors for table 2: Prevalence of mental health indicators among prisoners and jail inmates, by demographic characteristics, 2011–2012 Characteristic All inmates Sex Male Female Race/Hispanic origin White Black Hispanic Other Age 18–24 25–34 35–44 45–54 55–64 65 or older Serious psychological distress Prisoners Jail inmates 0.46% 0.51% History of a mental health problem Prisoners Jail inmates 1.15% 0.79% 0.49% 1.03 0.51% 0.89 1.16% 1.84 0.77% 1.25 0.61% 0.63 0.73 0.99 0.67% 0.73 0.70 1.09 1.26% 1.27 1.72 1.68 0.78% 1.11 1.08 1.23 0.99% 0.64 0.65 0.81 0.87 1.32 0.57% 0.68 0.80 0.90 1.61 3.40 1.66% 1.27 1.32 1.47 1.40 2.08 0.82% 0.96 1.07 1.05 1.79 4.52 Source: Bureau of Justice Statistics, National Inmate Survey, 2011–2012. INDICATORS OF MENTAL HEALTH PROBLEMS REPORTED BY PRISONERS AND JAIL INMATES, 2011-12 | JUNE 2017 14 APPENDIX TABLE 8 Standard errors for table 3: Indicators of a mental health problem among prisoners and jail inmates, by marital status and education, 2011–2012 Serious psychological distress Selected characteristics Prisoners Jail inmates All inmates 0.46% 0.51% Marital status Married 0.66% 0.94% Widowed 1.97 2.44 Divorced 0.71 0.96 Separated 1.16 1.06 Never married 0.53 0.49 Education Less than high school 0.56% 0.61% High school graduate 0.71 0.70 Some college 0.83 0.74 College degree or more 0.92 1.18 History of a mental health problem Prisoners Jail inmates 1.15% 0.79% 1.37% 2.44 1.24 1.70 1.14% 2.77 1.08 1.63 1.34 0.81 1.09% 0.83% 1.49 1.09 1.52 0.94 1.44 1.24 APPENDIX TABLE 9 Standard errors for table 4: Indicators of a mental health problem among prisoners and jail inmates, by current offense, sentence status and length, and time served, 2011–2012 Serious psychological distress Prisoners Jail inmates History of a mental health problem Prisoners Jail inmates 0.52% 0.91 0.61 1.31 0.75% 0.64 0.84 1.24 1.18% 1.72 1.46 2.82 0.96% 1.00 0.99 1.45 0.97 0.91 2.08 1.14 : : 1.47% 0.77 0.44 1.01 7.90 0.56% 0.61 0.67% 0.81 1.12 4.84 10.31 Criminal history Number of times arrested (lifetime) 1 time 2–3 times 4–10 times 11 times or more Total time in a correctional facility prior to current facility None 1–5 months 6–11 months 1–4 years 5 years or more Serious psychological distress Prisoners Jail inmates History of a mental health problem Prisoners Jail inmates 0.68% 0.52 0.61 0.86 1.34% 1.17 0.74 1.08 1.32% 1.10 1.30 1.56 1.82% 1.31 1.40 1.44 0.59% 0.77 0.72 0.65 0.70 0.90% 1.09 1.29 1.05 1.17 1.34% 1.46 1.44 1.30 1.29 1.42% 1.59 1.85 1.46 1.28 Source: Bureau of Justice Statistics, National Inmate Survey, 2011–2012. Source: Bureau of Justice Statistics, National Inmate Survey, 2011–2012. Criminal justice status and history Most serious offense Violent Property Drug DWI/DUI Other public order Status Unsentenced Sentenced Sentence length Less than 1 year 1–4 years 5 years or more Life sentence Death sentence Time served since admission to current facility Less than 1 month 1–5 months 6–11 months 1–4 years 5 years or more APPENDIX TABLE 10 Standard errors for table 5: Indicators of a mental health problem among prisoners and jail inmates, by criminal history, 2011–2012 : : 2.77% 1.71 1.10 1.78 7.18 0.90% 0.85 1.08% 1.28 1.52 4.43 11.34 APPENDIX TABLE 11 Standard errors for table 6: Mental health treatment received by prisoners and jail inmates with an indicator of a mental health problem, by type of indicator, time period, and treatment type, 2011–2012 Time period and treatment type Ever received mental health treatment during lifetime Ever overnight hospital stay Ever taken prescription medication Ever had counseling/ therapy from trained professional Mental health treatment since admission Prescription medication Counseling/therapy from trained professional Prescription medication and counseling/therapy Currently treated for a mental health problem Prescription medication Counseling/therapy from trained professional Prescription medication and counseling/therapy Serious psychological distress Jail Prisoners inmates History of a mental health problem Jail Prisoners inmates 1.25% 0.79% 0.56% 0.35% 1.21 0.84 0.85 0.61 1.69 1.01 0.89 0.56 1.31 0.83 0.67 0.43 1.71% 1.92 1.11% 1.07 1.36% 1.69 1.06% 1.07 1.49 0.85 1.15 0.81 1.61 0.75 1.33 0.75 2.16% 1.92 1.07% 1.04 1.79% 1.56 1.07% 1.07 1.73 0.61 1.44 0.64 1.38 0.49 1.13 0.53 Source: Bureau of Justice Statistics, National Inmate Survey, 2011–2012. 1.16% 0.76 0.86 0.57 0.76 0.64% 0.59 0.76 1.30 3.87 2.11% 1.43 1.37 1.51 1.37 0.87% 0.91 1.16 1.83 5.05 : Not calculated. Source: Bureau of Justice Statistics, National Inmate Survey, 2011–2012. INDICATORS OF MENTAL HEALTH PROBLEMS REPORTED BY PRISONERS AND JAIL INMATES, 2011-12 | JUNE 2017 15 APPENDIX TABLE 12 Standard errors for table 7: Prisoners and jail inmates written up or charged with assaults, by mental health status, 2011–2012 Type of assault Total Verbal assault of correctional officer or other staff Physical assault of correctional officer or other staff Assault against another inmate No indicator of a mental health problem Prisoners Jail inmates 0.31% 0.22% 0.16 0.13 0.08 0.06 0.23 0.18 Serious psychological distress Prisoners Jail inmates 0.79% 0.47% 0.49 0.25 0.35 0.16 0.56 0.39 History of a mental health problem Prisoners Jail inmates 0.55% 0.44% 0.32 0.20 0.22 0.10 0.46 0.35 Source: Bureau of Justice Statistics, National Inmate Survey, 2011–2012. INDICATORS OF MENTAL HEALTH PROBLEMS REPORTED BY PRISONERS AND JAIL INMATES, 2011-12 | JUNE 2017 16 The Bureau of Justice Statistics (BJS) of the U.S. Department of Justice is the principal federal agency responsible for measuring crime, criminal victimization, criminal offenders, victims of crime, correlates of crime, and the operation of criminal and civil justice systems at the federal, state, tribal, and local levels. BJS collects, analyzes, and disseminates reliable and valid statistics on crime and justice systems in the United States, supports improvements to state and local criminal justice information systems, and participates with national and international organizations to develop and recommend national standards for justice statistics. Jeri M. Murlow is acting director. This report was written by Jennifer Bronson of BJS and Marcus Berzofsky of RTI International. Todd Minton verified the report. Caitlin Scoville and Jill Thomas edited the report. Steve Grudziecki produced the report. June 2017, NCJ 250612 NCJ250612 Office of Justice Programs Building Solutions • Supporting Communities • Advancing Justice www.ojp.usdoj.gov