
Doj Report Policing and Homicide 1976-98
Download original document:
Document text
Document text
This text is machine-read, and may contain errors. Check the original document to verify accuracy.
U.S. Department of Justice
Office of Justice Programs
Bureau of Justice Statistics
Policing and Homicide, 1976-98:
Justifiable Homicide by Police,
Police Officers Murdered by Felons
Number of homicides
500
400
300
Felons justifiably killed by police
200
Police officers murdered by felons
100
0
1976
1982
1988
1994
1998
U.S. Department of Justice
Office of Justice Programs
810 Seventh Street, N.W.
Washington, D.C. 20531
John Ashcroft
Attorney General
Office of Justice Programs
World Wide Web site:
http://www.ojp.usdoj.gov
Bureau of Justice Statistics
World Wide Web site:
http://www.ojp.usdoj.gov/bjs/
For information contact:
BJS Clearinghouse
1-800-732-3277
U.S. Department of Justice
Office of Justice Programs
Bureau of Justice Statistics
Policing and Homicide,
1976-98: Justifiable
Homicide by Police,
Police Officers Murdered
by Felons
Jodi M. Brown
and Patrick A. Langan, Ph.D.
BJS Statisticians
March 2001, NCJ 180987
U.S. Department of Justice
Bureau of Justice Statistics
Lawrence A. Greenfeld
Acting Director
This report was prepared by Jodi M.
Brown and Patrick A. Langan of the
Bureau of Justice Statistics. Matthew
Durose and Donna Oliphant assisted
with verification. Tina Dorsey and Tom
Hester edited and produced the report.
Jayne Robinson prepared the report for
printing.
Frankie Kelley of the Federal Bureau
of Investigation provided tabulations
of LEOKA data specially for this report.
Staff members of the Criminal Justice
Information Services Division of the
Federal Bureau of Investigation read
drafts of this report and responded with
many helpful comments.
Police departments in the following
cities contributed valuable descriptions
of actual cases of justifiable homicide
by police in 1996: Atlanta, Baltimore,
Cleveland, Houston, Los Angeles, New
York City, Oklahoma City, and
Philadelphia.
The data and the report, as well as
others from the Bureau of Justice
Statistics, are available through the
Internet —
http://www.ojp.usdoj.gov/bjs/
ii Policing and Homicide, 1976-98
Highlights
This report brings together in a single
publication national statistics on two
distinct types of homicide: the justifiable homicide of felons by police, and
the murder of police officers by felons.
Although the two are fundamentally
different — the use of deadly force
against a police officer is almost never
justified, while the use of deadly force
by police often is — certain connections
can be made between them beyond the
fact that both always involve the police.
Sometimes one directly results in the
other: 1 in 6 murders of a police officer
result in the justifiable killing of the
murderer. (Still, of all the justifiable
homicides by police only about 3%
occur in connection with the murder of a
police officer.) The two also share
demographic similarities. For example,
almost all the felons justifiably killed by
police (98%) and almost all of the felons
who murdered a police officer (97%)
are males; in both types of homicide
just over half of the felons are ages 18
to 30; and in both types just over half of
the felons are white.
Percent of
felons killed
by police in
justifiable
homicides,
1976-98
Male
Ages 18-30
White
Black
Young white males
Young black males
98%
53%
56%
42%
16%
16%
From 1976 to 1998, the U.S. population
age 13 or older grew by about 47 million
people and the size of the police force
in the United States grew by over
200,000 officers, but the number of
felons justifiably killed by police did not
generally rise.
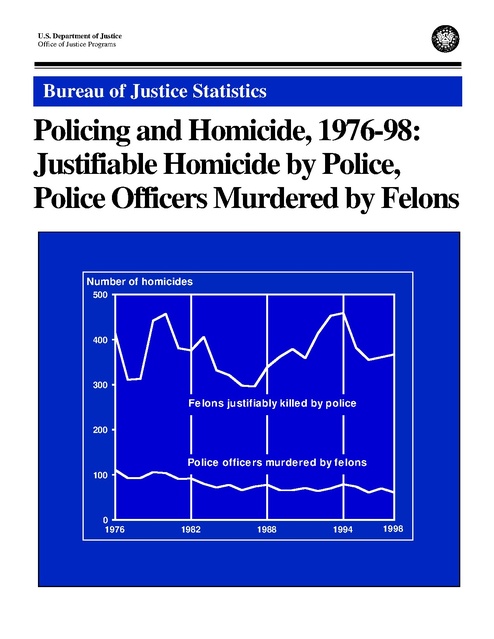
Justifiable homicide by police,
1976-98
In this report, killings by police are
referred to as “justifiable homicides,”
and the persons that police kill are
referred to as “felons.” These terms
reflect the view of the police agencies
that provide the data used in this report. A growing percentage of felons killed by
police are white, and a declining
The killing of a felon by police is consid- percentage are black (figure 4).
ered justified when it is done to prevent
Race of felons killed
imminent death or serious bodily injury
50% White
49% Black
to the officer or another person. Police 1978
1988
59% White
39% Black
justifiably kill on average nearly 400
1998
62% White
35% Black
felons each year (the figure below and
figure 1).
Felons justifiably killed by police represent a tiny fraction of the total populaNumber of justifiable homicides by police
tion. Of the 183 million whites in 1998,
500
police killed 225; of the 27 million
blacks, police killed 127. While the rate
400
(per million population) at which blacks
were killed by police in 1998 was about
300
4 times that of whites (the figure below
200
and figure 5), the difference used to be
much wider: the black rate in 1978 was
100
8 times the white rate.
0
Percent of
felons who
murdered
police officers,
1976-98
97%
54%
54%
43%
20%*
21%*
*Percent is for 1980-98.
The first section of the report deals with
the justifiable homicide of felons by
police; the second, with the murder of
police officers by felons. Together, the
two types account for around 2% of all
intentional killings in the United States.
The types of homicide not covered in
this report are: negligent homicides;
justifiable homicides by private citizens;
and murders in which the victim is
someone other than an officer slain in
the line of duty.
1976
1982
1988
1994 1998
Number of justifiable homicides by police
per 1 million U.S. population age 13 or older for each race
12
10
8
6
Black felons
4
2
White felons
Other felons
0
1976
1982
1988
1994
1998
Policing and Homicide, 1976-98 iii
The highest rates of justifiable homicide
are of young black males. Of the
Nation’s 3.4 million young black males
(black males under age 25) in 1998, 48
were justifiably killed by police. That
year, young black males made up 1% of
the total U.S. population but 14% of
felons justifiably killed by police. By
comparison, of the Nation’s 18.3 million
young white males, 53 were justifiably
killed. Young white males were 7% of
the population and 15% of those killed
in 1998.
In 1978, 1 in 4,000 police officers were
murdered; in 1988, 1 in 6,000; and
in 1998, 1 in 11,000 officers (figure 14).
Throughout much of the 1990's, white
police officers made up about 87% of all
police officers in the United States and
83% of all officers murdered by felons.
Black officers were 11% of police
officers but 15% of those murdered.
Officers of other races were 2% of
police officers and 2% of those
murdered (figure 15).
Firearms claimed the lives of 92% of
the officers killed in the line of duty from
1976 to 1998. The officer’s own gun
was used in 12% of all murders of
police officers.
Murderers of police officers represent
a tiny fraction of the total population.
Of the Nation’s 18.3 million young white
males (white males under age 25),
17 murdered a police officer in 1998.
Of the 3.4 million young black males,
13 murdered an officer that year.
From 1980 to 1998, young black males
made up about 1% of the U.S. population but 21% of felons who murdered a
police officer (figure 17); young white
males were 8% of the population but
According to the latest statistics (1998), From 1976 to 1998, two-thirds of the
20% of the murderers of law enforcefelons who murdered a police officer
white officers are 87% of the Nation’s
ment officers. Young black males
had a prior criminal arrest (figure 16).
police force and account for 82% of
murdered police officers at a rate
justifiable homicides by police. Black
The majority of police officers murdered almost 6 times that of young white
officers make up 11% of the Nation’s
males (5.7 versus 1 per million populapolice and account for 17% of the justifi- by felons were killed while responding
tion) (the figure below and figure 18).
to disturbance calls (16%) or arrest
able homicides (figure 10).
situations (39%).
Police officers murdered by felons,
Young male felons who murdered police officers,
1976-98
Of all the felons justifiably killed by
police from 1976 to 1998, 53% were
ages 18 to 30, and 98% were males.
On average, officers murdered from
1976 to 1998 had 9 years of law
enforcement service.
rate per 1 million U.S. males ages 13 to 24 for each race
Since 1976, an average of 79 police
officers have been murdered each year
in the line of duty (figure 12). The
number of officers murdered each year
is dropping, and the rate at which police
officers are being murdered is steadily
falling (the figure below and figure 14).
Police officers murdered by felons,
rate per 100,000 officers
30
12
10
Young black male felons
8
6
4
25
20
2
15
10
0
1980
5
0
1976
1982
1988
1994 1998
iv Policing and Homicide, 1976-98
Young white male felons
1986
1992
1998
Contents
Page
Page
Highlights. . . . . . . . . . . . . . . . . . . . . . . . . . . . .
iii
Justifiable homicide by police, 1976-98. . . . .
1
Annual trends in justifiable
homicides by police. . . . . . . . . . . . . . . . . .
Felons killed by police in justifiable
homicides. . . . . . . . . . . . . . . . . . . . . . . . .
Felons' gender
Felons' race
Felons' age
Felons' gender and race
Felons' gender, race, and age
Officers who killed felons in justifiable
homicides. . . . . . . . . . . . . . . . . . . . . . . . .
Officers' gender
Officers' race
Officers' age
Officers' gender and race
Officers' and felons' gender
Officers' and felons' race
Detailed 1998 racial statistics
Descriptions of actual cases of justifiable
homicide by police, 1996. . . . . . . . . . . . .
1
3
Felons who murdered police officers. . . . . . 24
Felons' age
Felons’ gender
Felons’ race
Felons' criminal record
Felons' race and officers' race, 1980-98
Felons' age, race, and gender, 1980-98
Descriptions of actual cases of police officers
killed in the line of duty. . . . . . . . . . . . . . . . 27
Methodology. . . . . . . . . . . . . . . . . . . . . . . . . . . 28
The SHR national database on justifiable
homicides by police.. . . . . . . . . . . . . . . . . . . . . . 28
9
Evolution of the SHR database. . . . . . . . . . . . . . 28
Nonjustifiable homicide by police. . . . . . . . . . . . . 28
13
Police officers murdered by felons, 1976-98. . 19
Drop in murders of police officers. . . . . . . . . 19
Errors in the SHR database. . . . . . . . . . . . . . . . . 29
Nonjustifiable homicides by police
in the SHR database
Justifiable homicides by police missing
from the SHR database
Misinformation in the SHR database
regarding officer characteristics
Missing characteristics of felons and
officers in the SHR database
Cautionary note on this report's statistics
on justifiable homicides by police. . . . . . . . . . . 30
Drop in rate of murders of police officers. . . 20
Police officers murdered with their
own firearm. . . . . . . . . . . . . . . . . . . . . . . . 21
Circumstances at scene of incident. . . . . . . 22
Murdered police officers. . . . . . . . . . . . . . . . 23
Officers' age
Officers' gender
Officers' race
Officers' other characteristics
Detailed racial statistics for the 1990's
Justifiable homicides by police in cases
involving more than one officer. . . . . . . . . . . . 30
Source of national statistics on police officers
murdered by felons. . . . . . . . . . . . . . . . . . . . . 31
Source of size and characteristics
of U.S. police force. . . . . . . . . . . . . . . . . . . . .
31
Police use of non-lethal force. . . . . . . . . . . . . .
31
A new source of data on police officers
killed and assaulted. . . . . . . . . . . . . . . . . . . .
32
Data for figures. . . . . . . . . . . . . . . . . . . . . . . . .
Data for tables. . . . . . . . . . . . . . . . . . . . . . . . . .
33
48
Appendix tables. . . . . . . . . . . . . . . . . . . . . . . . .
50
Policing and Homicide, 1976-98 v
Justifiable homicide by police, 1976-98
When a police officer deliberately kills
someone, a determination is made as
to whether the homicide occurred in the
line of duty and whether the homicide
was justified to prevent imminent death
or serious bodily injury to the officer or
another person. If an investigation
determines that the homicide did occur
in the line of duty and that circumstances did warrant lethal force, a
record of a justifiable homicide is voluntarily sent by the officer’s agency to the
FBI in Washington. Each record of
justifiable homicide received is then
entered into a database.
The database contains such information
as the felon’s age, race, and gender,
and such information on the officer as
age, race, and gender.
In this report, killings by police are
referred to as “justifiable homicides,”
and the persons that police kill are
referred to as “felons.” These terms
reflect the view of the police agencies
that provide the data used in this report.
According to FBI national data on justifi- • From 1976 to 1998, the U.S. populaable homicides by police from 1976 to
tion age 13 or older grew by about 47
1998 —
million people and the size of the police
force in the United States grew by over
• 8,578 felons were justifiably killed
200,000 officers, but the number of
by police in the United States.
felons justifiably killed by police did not
generally rise.
• The largest number of recorded justifiable homicides in a single year was 459 • On average each year about 2
(in 1994), and the smallest number was persons per 1 million residents age 13
or older were justifiably killed by law
296 (in 1987) (figure 1).
enforcement officers (figure 2).
• On average 373 felons were lawfully
(Because police rarely kill someone
killed by police each year.
under age 13, the rate calculation is per
1 million U.S. population age 13 or
older.)
Number of felons killed by police in justifiable homicides, 1976-98
Number of felons
500
400
300
Felons killed
200
Annual trends in justifiable
homicides by police
100
Though the FBI database has records
of justifiable homicides by police from
0
1998
1976
1982
1988
1994
1968, this report is concerned just with
homicides occurring since 1976 (see
Figure 1
Methodology page 28). The records
Felons killed by police in justifiable homicides:
since 1976 have fuller information than
Rate per 1 million U.S. population age 13 or older, 1976-98
earlier records, including information not
only on the felons, but also on the police
Rate per 1 million U.S. population age 13 or older
officers.
3
2.5
2
1.5
Felons killed
1
0.5
0
1976
1982
1988
1994
1998
Figure 2
Policing and Homicide, 1976-98 1
Throughout this report, the national statistics given on justifiable homicides
by police were “unadjusted,” meaning no correction was made for the fact
that some States did not report to the FBI any of the justifiable homicides
that occurred in certain years. For example, Florida did not report in 1988,
and so the national total of 339 justifiable homicides in 1988 is missing
whatever number of justifiable homicides occurred in Florida that year.
To illustrate what effect missing States might have, unadjusted and adjusted
rates of justifiable homicide were plotted on the same graph (below).
In calculating unadjusted rates, missing States were treated as having no
justifiable homicides; in adjusted rates, missing States were treated as
having the same number of justifiable homicides they had reported in the
closest preceding year. For example, Florida submitted no data for 1988
but did report 24 justifiable homicides in 1987. The 1988 adjusted national
rate therefore includes an estimated 24 Florida homicides.
Rates of felons killed by police in justifiable homicides
3
2.5
2
Adjusted rates
Unadjusted rates
1.5
1
0.5
0
1976
Adjusted
year(s)
1988-91
1997-98
1988
1993-98
1995
1996
1998
1998
1982
1988
Missing
State
Florida
Florida
Kentucky
Kansas
Illinois
D.C.
D.C.
Wisconsin
2 Policing and Homicide, 1976-98
1994
1998
Estimate used to
calculate adjusted rate
Number
Year
24
1987
6
1996
0
1987
7
1992
25
1994
12
1995
7
1997
5
1997
Table 1. Felons killed by police in
justifiable homicides: Percent killed
with firearms, 1976-98
Year
Total number Percent
of justifiable with
homicides
firearms
Table 2. Gender of felons killed
by police in justifiable homicides,
1976-98
Year
Total number Percent of
of justifiable killed felons
homicides
Male Female
• Police used a firearm (usually a
handgun) in 99% of justifiable
homicides (table 1). In many cases
where police killed a felon with a
firearm, the felon was shot multiple
times. This is consistent with police
training. When police have to shoot,
they will keep shooting until the felon no
longer poses a threat.
Annual average
373
99.0%
Annual average
373
98%
2%
1976
1977
1978
1979
415
311
313
442
99.8%
99.0
99.7
98.9
1976
1977
1978
1979
415
311
313
442
99%
98
98
97
1%
2
2
3
1980
1981
1982
1983
1984
457
381
376
406
332
98.9%
98.7
96.8
99.5
98.5
1980
1981
1982
1983
1984
457
381
376
406
332
98%
99
98
99
98
2%
1
2
1
2
1985
1986
1987
1988
1989
321
298
296
339
362
98.4%
99.0
99.0
98.8
99.2
1985
1986
1987
1988
1989
321
298
296
339
362
98%
99
98
98
96
2%
1
2
2
4
1990
1991
1992
1993
1994
379
359
414
453
459
99.2%
98.6
98.3
99.6
99.8
1990
1991
1992
1993
1994
379
359
414
453
459
97%
96
98
97
96
3%
4
2
3
4
Of the 8,578 felons killed by police
from 1976 to 1998, 98% of them had all
3 of their demographic characteristics
recorded in the database.
1995
1996
1997
1998
382
355
361
367
99.2%
98.3
99.4
99.5
1995
1996
1997
1998
382
355
361
367
99%
98
97
98
1%
2
3
2
According to FBI national data on
justifiable homicides by police from
1976 to 1998 —
Note: “Total number” includes all instances
of justifiable homicide by police whether or
not the type of weapon used is known. The
type of weapon is known in 99.9% of the
justifiable homicides committed by police
between 1976 and 1998.
Source: FBI database, Supplementary
Homicide Reports.
Note: “Total number” includes all instances
of justifiable homicide by police whether or not
the demographic characteristics are known.
The felon’s gender is known in 99.9% of the
justifiable homicides by police between 1976
and 1998.
Source: FBI database, Supplementary
Homicide Reports.
Felons killed by police in justifiable
homicides
Persons justifiably killed by police are
referred to in the FBI's national
database as "felons" because, at the
time of the homicide, they were involved
(or were thought to be involved) in a
violent felony. The demographic information available on them in the
database is their gender, race, and age.
Felons' gender
• 98% of persons justifiably killed
by police were males (table 2).
Policing and Homicide, 1976-98 3
Gender of felons killed by police in justifiable homicides:
Rate per 10 million population age 13 or older, 1976-98
Rate per 10 million U.S. population age 13 or older
60
50
• In 1998, males made up 48% of
the population age 13 or older, but
accounted for 83% of persons arrested
for violent crime and 98% of felons
killed by police. The 1998 statistics
illustrate both the comparatively high
rate of justifiable homicide involving
males and the similarity between
persons arrested by police and felons
killed by police.
Male felons
40
30
20
10
Female felons
0
1976
1982
1988
• Males were slain by police in justifiable
homicides at a rate almost 40 times that
of females (39 deaths of males per
10 million male residents versus 1
death per 10 million female residents)
(figure 3).
1994
1998
Felons' race
Figure 3
Race of felons killed by police in justifiable
homicides: Percent white, black, and other, 1976-98
Percent of killed felons
100%
• Most felons killed by police each year
were white (except for 1976 and 1977)
(figure 4).
• A growing percentage of felons killed
by police are white, and a declining
percentage are black.
80%
White felons
60%
1978
1988
1998
40%
Black felons
20%
Other felons
0%
1976
1982
1988
Figure 4
4 Policing and Homicide, 1976-98
1994
1998
Race of felons killed
50% white
49% black
59% white
39% black
62% white
35% black
Race of felons killed by police in justifiable homicides:
Rate per 1 million U.S. population age 13 or older, 1976-98
Rate per 1 million U.S. population age 13 or older
12
9
• In 1998 blacks made up 12% of the
population age 13 or older but
accounted for 40% of persons arrested
for violent crime and 35% of felons
killed by police. The 1998 statistics
illustrate both the comparatively high
rate of justifiable homicide involving
blacks and the racial similarity between
persons arrested by police and felons
killed by police.
6
Black felons
3
White felons
Other felons
0
1976
1982
1988
1994
1998
Figure 5
Rates of arrest for violent crime (per 10,000)
and justifiable homicide by police (per 10,000,000)
age 13 or older, 1976-98
Rates of arrest and justifiable homicide
140
• Felons justifiably killed by police represent a tiny fraction of the total population. Of the 183 million whites in 1998,
police killed 225; of the 27 million
blacks, police killed 127. While the rate
(per million population) at which blacks
were killed in 1998 was about 4 times
that of whites, the difference used to be
much wider: the black rate in 1978 was
8 times the white rate (figure 5).
• The rate at which blacks are killed by
police in justifiable homicides is declining, while the rate at which whites are
killed by police shows no consistent
trend.
120
Black violent
crime arrest
100
80
60
Black justifiable
homicide by police
40
White violent
crime arrest
White justifiable
homicide bty police
20
0
1976
Figure 6
1982
1988
1994
1998
1978
1988
1998
Rate of justifiable homicide
by police (per 1 million
population)
White Black
1.0
8.0
1.2
5.7
1.2
4.8
Correlation with arrest for violent crime
• There is little correspondence between
trends in arrests for violent crimes and
trends in justifiable homicides by police
(the correlation is +0.2 for whites and
-0.2 for blacks) (figure 6).
Policing and Homicide, 1976-98 5
Felons' age
Table 3. Age of felons killed by police in justifiable homicides, 1976-98
• Except for an 11-year-old killed by
police in 1981 and a 12-year-old in
1992, all persons slain by police in
justifiable homicides from 1976 to 1998
were in their teens or older.
Total number
of justifiable
homicides
13-19
Annual average
373
11%
21%
21%
17%
11%
19%
1976
1977
1978
1979
415
311
313
442
15%
12
14
13
25%
23
25
25
25%
21
17
21
13%
13
13
15
8%
10
11
9
14%
21
20
17
1980
1981
1982
1983
1984
457
381
376
406
332
11%
12
10
8
10
27%
21
22
20
22
22%
26
26
21
21
17%
15
17
19
16
11%
10
9
9
10
12%
16
16
23
21
• Felons ages 18 to 30 (not shown
in table 3) were 53% of justifiable
homicides by police from 1976 to 1998.
1985
1986
1987
1988
1989
321
298
296
339
362
7%
10
7
10
9
22%
18
21
16
19
25%
22
19
26
23
15%
21
16
19
19
11%
11
14
11
10
20%
18
23
18
20
• In most years, felons in their twenties
accounted for more justifiable
homicides than any other age categories (table 3).
1990
1991
1992
1993
1994
379
359
414
453
459
9%
15
13
14
12
19%
20
22
20
21
22%
22
21
17
17
17%
18
16
16
17
12%
9
11
11
13
21%
16
17
22
20
1995
1996
1997
1998
382
355
361
367
13%
13
11
12
22%
19
17
18
15%
17
18
18
20%
19
17
16
12%
11
15
12
18%
21
22
24
• Persons in their twenties had the
highest rates of being slain by police
in justifiable homicides (almost 4 per
million population) and persons in their
early thirties had the next highest rate
(figure 7).
Year
Percent of killed felons who were ages —
20-24
25-29
30-34
35-39 40 or older
Note: “Total number” includes all instances of justifiable homicide
by police whether or not the demographic characteristics are known.
The felon’s age is known in 98.7% of the justifiable homicides by police
between 1976 and 1998. The 13-19 age category includes one
11-year-old in 1981 and one 12-year-old in 1992.
Source: FBI database, Supplementary Homicide Reports.
Age of felons killed by police in justifiable homicides:
Rate per 1 million population, 1976-98
Rate per 1 million U.S. population that age
6
Ages
20-24
25-29
30-34
4
2
0
1976
1982
1988
Figure 7
6 Policing and Homicide, 1976-98
1994
1998
• The average age of felons justifiably
killed by police from 1976 to 1998 was
31 years.
• In 1998 persons in their twenties
made up 16% of the population age
13 or older, but accounted for 31%
of persons arrested for violent crime
and 36% of felons killed by police.
The 1998 statistics illustrate both the
comparatively high rate of justifiable
homicide involving persons in their
twenties and the age similarity between
persons arrested by police and felons
killed by police.
• According to latest statistics (1998),
the average age of felons killed by
police is 32, and half are age 30 or
older.
Felons' gender and race
• Felons justifiably killed by police represent a tiny fraction of the total popula• The vast majority of felons killed by
tion. Of the 89 million white males (age
police each year (about 96%) are either 13 or older) in 1998, police killed 220; of
the 12 million black males (age 13 or
white males or black males (table 4).
older), police killed 125. In 1998 black
• Of the felons killed by police from
males were around 6% of the general
1976 to 1998, 55% were white males,
population (age 13 or older) but 34% of
41% were black males, 1% were white persons killed by police, and white
females, 1% were black females, and
males were 41% of the general populathe rest were mostly males in the "other tion (age 13 or older) but 61% of those
races" category (Asian, Pacific Islander, killed.
Alaska Native, and American Indian).
• Among persons killed by police, white
males outnumbered black males.
Percent of all felons killed by police
1978 48% white males 49% black males
1988 57% white males 39% black males
1998 61% white males 34% black males
Table 4. Gender and race of felons killed by police
in justifiable homicides, 1976-98
Year
Total number
of justifiable
homicides
Total
Percent of killed felons who were —
Male
Female
White
Black
Other
Total White
Black
Other
Annual average
373
98%
55%
41%
2%
2%
1%
1%
0%
1976
1977
1978
1979
415
311
313
442
99%
98
98
97
46%
47
48
49
51%
49
49
47
2%
2
1
2
1%
2
2
3
1%
0
1
1
0%
2
1
2
0%
0
0
0
1980
1981
1982
1983
1984
457
381
376
406
332
98%
99
98
99
98
50%
54
51
54
56
47%
44
46
44
40
1%
1
2
2
1
2%
1
2
1
2
1%
0
1
0
2
1%
1
1
1
1
0%
0
0
0
0
1985
1986
1987
1988
1989
321
298
296
339
362
98%
99
98
98
96
59%
57
63
57
58
35%
40
33
39
36
4%
2
2
2
2
2%
1
2
2
4
2%
1
1
2
2
1%
0
1
0
2
0%
0
0
0
0
1990
1991
1992
1993
1994
379
359
414
453
459
97%
96
98
97
96
61%
51
58
53
54
34%
42
38
41
39
2%
3
2
3
3
3%
4
2
3
4
1%
2
2
2
3
2%
1
0
1
1
0%
1
0
0
0
1995
1996
1997
1998
382
355
361
367
99%
98
97
98
59%
60
61
61
37%
36
34
34
3%
2
2
3
1%
2
3
2
1%
2
2
1
0%
1
1
1
0%
0
0
0
Note: “Total number” includes all instances of justifiable homicide by police,
whether or not the gender and race are known. The felon’s gender and race
are both known in 99.3% of the justifiable homicides by police between 1976 and 1998.
Due to rounding error, detail may not sum to total.
Source: FBI database, Supplementary Homicide Reports.
Policing and Homicide, 1976-98 7
Felons killed by police in justifiable homicide:
Percent under and over age 25, by race and gender, 1976-98
Percent of killed male felons
60%
White males age 25 or older
40%
Black males age 25 or older
White males under age 25
Black males under age 25
20%
0%
1976
1982
1988
Figure 8
1994
1998
Felons' gender, race, and age
• The highest rates of justifiable
homicide are of young black males.
Of the Nation's 3.4 million young black
males (black males under age 25) in
1998, 48 were justifiably killed by police.
That year, young black males made up
1% of the total U.S. population but 14%
of felons justifiably killed by police. By
comparison, of the Nation's 18.3 million
young white males, 53 were justifiably
killed. Young white males were 8% of
the population and 15% of those killed
in 1998.
• From 1976 to 1998 young black males
(black males under age 25) made up
about 1% of the population but 16% of
felons killed by police in justifiable
homicides; young white males made up
about 8% of the population but 16% of
felons killed by police (figure 8).
• Of all felons justifiably killed by police
from 1976 to 1998, the majority were
young white males under age 25 (16%),
young black males under age 25 (16%),
white males age 25 or older (39%), and
black males age 25 or older (25%).
8 Policing and Homicide, 1976-98
• From 1980 to 1998 young black
males were killed by police in justifiable
homicides at a rate approximately
6 times that of young white males
(16.5 versus 2.9 per million population)
(figure 9).
• Latest statistics (1998) indicate that
white males ages 20 to 34 are 8% of
the general population but 29% of those
killed by police, and black males ages
20 to 34 are 1.4% of the general
population but 20% of persons killed
by police in justifiable homicides.
• Average ages of felons killed by police
from 1976 to 1998 were —
Officers who killed felons
in justifiable homicides
Race
White
Black
Other
Males
32 yrs
29
29
Females
35 yrs
39
33
• Median ages of felons killed by police
from 1976 to 1998 were —
Race
White
Black
Other
Males
30 yrs
27
27
Females
33 yrs
36
33
• White and black males ages 20 to 34
made up most of the felons killed by
police (56%) from 1976 to 1998.
The police officer's gender, race, and
age are a part of the record for each
justifiable homicide entered into the
national database, but since participation is voluntary, police agencies do not
always supply this information. There
were 8,578 felons killed by police from
1976 to 1998. The age, race, and
gender of the officer involved in the
homicide were recorded on 69% of
them, and at least one of the three
characteristics was recorded on 85%.
• Based on latest statistics (1998),
together white males and black males
ages 20 to 34 are 10% of the general
population but 48% of those killed
by police.
Young male felons killed by police in justifiable homicides:
Rate per 1 million young white and black males, 1980-98
Rate per 1 million U.S. population ages 13-24
30
Young black male felons
20
10
Young white male felons
0
1980
1986
1992
1998
According to FBI national data on
justifiable homicides by police from
1976 to 1998 —
Officers' gender
• The officer in a justifiable homicide
case is almost always a male (98%)
(table 5).
Table 5. Gender of police officers who
killed felons in justifiable homicides:
Percent male and female, 1976-98
Total
number of
justifiable
homicides Percent of officers
by police
Male
Female
Year
Annual
average
373
98%
2%
1976
1977
1978
1979
415
311
313
442
99%
98
99
99
1%
2
1
1
1980
1981
1982
1983
1984
457
381
376
406
332
99%
99
98
98
99
1%
1
2
2
1
1985
1986
1987
1988
1989
321
298
296
339
362
97%
99
96
97
98
3%
1
4
3
2
1990
1991
1992
1993
1994
379
359
414
453
459
97%
98
98
98
99
3%
2
2
2
1
1995
1996
1997
1998
382
355
361
367
98%
98
97
97
2%
2
3
3
Note: “Total number” includes all instances
of justifiable homicide by police whether or
not the demographic characteristics are
known. The officer’s gender is known in
84.8% of the justifiable homicides by police
between 1976 and 1998.
Source: FBI database, Supplementary
Homicide Reports.
Figure 9
Policing and Homicide, 1976-98 9
Officers' race
Race of police officers who killed felons in justifiable
homicides: Percent white and black, 1976-98
• From 1976 to 1998 the officer in 84%
of justifiable homicides by police was
white, and the officer in 15% was black
(figure 10).
Percent of officers who killed felons
100%
80%
White officers
Officers' age
60%
• In most years officers ages 25 to 29
accounted for more justifiable
homicides than any other age category
(table 6).
40%
Black officers
• The average age of the officer in a
justifiable homicide by police was 33
years.
20%
0%
1976
1982
1988
1994
1998
• 55% of officers in justifiable homicides
were over age 30 (not shown in table 6).
Figure 10
Table 6. Age of police officers who killed felons in justifiable homicides, 1976-98
Year
Total number
of justifiable
homicides
by police
Under 20
Percent of officers who were ages —
20-24
25-29
30-34
35-39
40 or older
Annual average
373
1%
9%
28%
28%
17%
17%
1976
1977
1978
1979
415
311
313
442
0%
0
1
0
10%
11
13
9
37%
39
35
30
30%
28
32
29
10%
10
12
16
13%
12
7
16
1980
1981
1982
1983
1984
457
381
376
406
332
0%
0
0
0
0
9%
13
7
11
10
31%
26
30
24
22
34%
31
32
28
31
17%
18
19
19
23
9%
12
12
18
14
1985
1986
1987
1988
1989
321
298
296
339
362
0%
0
1
0
0
7%
7
8
4
10
24%
28
29
25
27
31%
28
23
35
24
24%
21
22
18
22
14%
16
17
18
17
1990
1991
1992
1993
1994
379
359
414
453
459
1%
0
0
1
2
7%
12
12
8
8
26%
29
25
33
25
23%
25
25
24
28
21%
17
16
12
18
22%
17
22
22
19
1995
1996
1997
1998
382
355
361
367
4%
0
2
2
8%
5
6
7
28%
31
28
27
26%
23
27
27
14%
15
20
22
20%
26
18
15
Note: “Total number” includes all instances of justifiable homicide by police,
whether or not the age of the police officer is known. The officer’s age is known
in 70.1% of the justifiable homicides by police between 1976 and 1998.
Due to rounding error, detail may not sum to 100%.
Source: FBI database, Supplementary Homicide Reports.
10 Policing and Homicide, 1976-98
Officers' and felons' race
Table 7. Gender and race of police officers who killed felons
in justifiable homicides, 1976-98
Total number
of justifiable
homicides
by police
White
Annual average
373
83%
14%
1%
1%
1%
0%
1976
1977
1978
1979
415
311
313
442
82%
82
85
83
15%
17
14
15
2%
0
0
1
0%
1
0
0
1%
0
1
1
0%
0
0
0
1980
1981
1982
1983
1984
457
381
376
406
332
85%
86
85
89
87
13%
13
14
8
11
0%
0
0
1
2
1%
0
1
1
0
1%
1
0
1
0
0%
0
0
0
0
1985
1986
1987
1988
1989
321
298
296
339
362
84%
89
82
82
84
12%
10
11
12
13
2%
0
2
2
0
1%
1
4
3
3
1%
0
1
1
0
0%
0
0
0
0
1990
1991
1992
1993
1994
379
359
414
453
459
81%
80
81
81
76
15%
17
15
16
22
1%
1
2
1
1
2%
1
1
1
1
1%
1
1
1
0
0%
0
0
0
0
1995
1996
1997
1998
382
355
361
367
83%
86
79
80
14%
11
16
16
1%
1
2
1
1%
1
2
2
1%
1
1
1
0%
0
0
0
Year
Percent of officers who were —
Male
Female
Black
Other
White
Black
Other
Note: “Total number” includes all instances of justifiable homicide by police, whether or not the
gender or race of the police officers is known. The officer’s gender and race are known in 77.2%
of the justifiable homicides by police between 1976 and 1998.
Source: FBI database, Supplementary Homicide Reports.
In 77% of the 8,578 justifiable
homicides by police in the Nation's
database, the race of both the felon
and the officer was recorded. Some
of the justifiable homicides are interracial, with the race of the felon differing
from that of the officer. Because statistics on interracial homicide are easily
misinterpreted, a few preliminary
comments are offered.
If every police officer in the United
States were white, then any time a
nonwhite person was justifiably killed
by police, the homicide would be interracial. This illustrates that the extent to
which justifiable homicide is interracial
in the United States is influenced by the
racial makeup of the police.
Since, according to latest available
statistics (1998), approximately 87%
of all police officers in the United States
are white (11% are black and 2% are
of other races), by chance alone the
likelihood is high that the officer who
kills a nonwhite felon is white. The
likelihood is also high that the officer
who kills a white felon is white. It
should not be surprising to find that
most black felons killed by police (just
as most white felons killed by police)
are killed by a white police officer.
"Chance" factors are not the only ones
According to FBI national data on justifi- affecting the likelihood that a justifiable
able homicides by police from 1976 to
homicide is interracial. Nonchance
• The officer in a justifiable homicide is
1998 —
factors have an effect as well. An
almost always a white or black male
obvious one is the policy that police
• When a justifiable homicide by police departments may have for assigning
(97%) (table 7).
occurs, it is almost always a male
officers to particular neighborhoods.
• White male officers accounted for
officer killing a male felon (96%).
A common policy is to assign black
83% of justifiable homicides from 1976
officers to black neighborhoods.
to 1998 and black male officers
• When a male officer kills, the felon
Consequently, it might be expected
accounted for 14%.
killed is almost always a male (98%).
that, when a black officer kills a felon,
there is a high likelihood that the felon
Officers' and felons' gender
• When a female officer kills, the felon
is also black. In line with that expectakilled is almost always a male (93%).
tion, national statistics indicate that
There were 8,578 felons killed by police
most of the felons killed by black
from 1976 to 1998. In 85% of these
• When a male felon is killed, the officer officers are themselves black. More
homicides the gender of both the felon
is almost always a male (98%).
generally, national statistics indicate
and the officer was recorded in the
that most justifiable homicides by police
• When a female felon is killed, the
national database.
are intraracial.
officer is almost always a male (95%).
Officers' gender and race
Policing and Homicide, 1976-98 11
According to FBI national data on
justifiable homicides by police from
1976 to 1998 —
• In about 65% of justifiable homicides
by police, the officer's race and the
felon's race were the same (figure 11).
Intraracial
White officer kills white felon
Black officer kills black felon
Other-race officer kills otherrace felon
53.1%
11.8
0.3
Interracial
White officer kills black felon
Black officer kills white felon
White officer kills other-race felon
Black officer kills other-race felon
Other-race officer kills white felon
Other-race officer kills black felon
29.6%
2.8
1.6
0.1
0.5
0.2
• Interracial homicide by police (for
example, the killing of a black felon by
a white officer or the killing of a white
felon by a black officer) make up about
a third of justifiable homicides.
Felon statistics give one perspective on
the number of police justifiable
homicides that are interracial (for
example, from 1976 to 1998, police
justifiably killed 4,786 white felons, and
in 5% of these homicides the officer
was black). Officer statistics gave
another perspective (for example, from
1976 to 1998 white police officers justifiably killed 5,579 felons, and in 35% of
these homicides the felon was black).
The extent to which justifiable homicide
by police officers are interracial
depends on which statistics are used:
• The majority of black felons killed
were by white officers (71%); the majority of white felons killed were by white
officers (94%); and the majority of other
race felons killed were by white officers
(81%).
Percent interracial and intraracial
60%
White officer kills white felon
40%
White officer kills black felon
20%
Black officer kills black felon
Black officer kills white felon
0%
1982
1988
Figure 11
12 Policing and Homicide, 1976-98
Percent of all justifiable
homicides by police
White officer
Black officer
kills —
kills —
White Black
White Black
felon
felon
felon felon
1978
1988
1998
46% 38%
57
27
56
24
2%
3
5
14%
10
12
• When a white officer kills a felon, that
felon is usually a white (63%); and when Detailed 1998 racial statistics
a black officer kills a felon, that felon is
usually a black (81%).
According to latest statistics (1998) —
Race of felons and police officers in justifiable
homicides: Percent interracial and intraracial, 1976-98
1976
• White-officer-kills-white-felon makes
up a growing fraction of all justifiable
homicides by police, while white-officerkills-black-felon makes up a declining
fraction (figure 11).
1994
1998
• White officers make up 87% of the
Nation's 641,208 police and account
for 82% of justifiable homicides by
police. Black officers make up 11%
of the Nation's police and account
for 17% of all justifiable homicides.
• White officers (42 justifiable homicides
per 100,000 white officers in 1998) and
black officers (44 justifiable homicides
per 100,000 black officers) commit justifiable homicides at about the same rate,
but the rate for officers of other races
is lower (25 per 100,000).
• The black-officer-kills-black-felon rate
is 32 per 100,000 black officers in 1998,
which is higher than the white-officerkills-black-felon rate of 14 per 100,000
white officers.
• The white-officer-kills-white-felon rate
is 28 per 100,000 white officers in 1998,
which is higher than the black-officerkills-white-felon rate of 11 per 100,000
black officers.
The descriptions below are of cases of
justifiable homicide by police in 1996.
The choice of which cases to describe
was left to the police departments that
voluntarily prepared and submitted the
narratives. Only large urban police
departments were asked to participate.
One officer observed a subject reaching
into his waistband, at which time the
subject was ordered to the ground by
the officer. The other officer observed a
second subject reaching into his waistband as he ran from the scene. The
suspect removed a dark colored
handgun from his waistband. The
Atlanta
officers ordered the suspect to drop the
weapon, but the suspect refused. The
• On Saturday, December 14, 1996, two suspect continued to run. Numerous
Atlanta police officers attempted to
times the officer ordered the suspect to
conduct a traffic stop. The suspect, a
“stop and drop the weapon,” but the foot
25-year-old male, refused to stop his
chase continued. The suspect fired
vehicle and a chase ensued. The
several rounds at the officer from his
suspect wrecked, then exited his
Smith and Wesson .357 caliber
vehicle, brandishing a weapon. The
revolver. The officer returned fire. The
officers began to chase the suspect on suspect approached a vehicle parked
foot. The suspect then turned and fired on the road. He entered the vehicle
several shots in the direction of both
from the passenger side and ordered
officers. One officer returned fire, strik- the operator of the vehicle to “drive!”
ing the suspect multiple times. The
Instead, the operator fled.
suspect ran into a nearby apartment
complex where he collapsed and died.
The suspect continued to fire at the
officer from the parked vehicle. The
• On Thursday, June 6, 1996, at
officer returned fire, striking the
approximately 5:00 p.m., several plain- suspect, the vehicle, and two additional
clothes Atlanta fugitive investigators
vehicles in the immediate area. The
went to a residence to serve an arrest
suspect was observed slumped in the
warrant on a 30-year-old male. The
front passenger seat of the vehicle with
officers approached the residence and a gunshot wound to the right eye and a
identified themselves. The suspect,
gunshot wound to the back. He
armed with a loaded handgun, tried to
succumbed to his wounds at the scene
escape through a bedroom window two and was pronounced dead by a medic
stories off the ground. When the
at 11:48 a.m.
suspect looked down from the bedroom
window, he saw officers outside, on the • At approximately 2:15 p.m., on Thursground below him. The suspect pointed day, January 25, 1996, a Baltimore City
his weapon in the direction of the
police officer was responding to a drugofficers. One of the officers discharged related call when he was stopped by an
his service weapon striking the suspect elderly male who advised the officer
in the chest. The suspect later died at a that a male had just discharged a
local hospital.
handgun in a nearby park and was still
there. The elderly male pointed to the
Baltimore
park area and stated, "there he is," as
he pointed to a male wearing a black
• At approximately 11:35 a.m., on
hat, green jacket, and blue jeans standMonday, June 24, 1996, two uniformed ing in the park. The officer broadcast
Baltimore City police officers were
over the police radio information relating
working as a unit when they observed a to the man armed with a gun, giving
large group of individuals in an alley.
both physical and clothing descriptions.
Knowing the area to be a high-crime,
Two plainclothes officers (with visible
high-drug area, they exited their vehicle
police ID's on chains around their neck)
to conduct field interviews. At that time,
and one uniformed officer were together
two of the subjects ran from the group.
in a marked police vehicle when they
spotted and approached the suspect.
The suspect was advised by one of the
officers to keep his hands in the air
where the officers could see them. The
suspect turned around to face the
officers and lifted up his coat.
The officers could see in the suspect's
waistband a black pistol that appeared
to be a semi-automatic. The suspect
withdrew the pistol and fired at the
officers.
The officers returned fire with their
departmentally issued weapons (each a
Glock model 17). The suspect began to
run while continuing to fire at the
officers. The officers returned fire until
the suspect was incapacitated. When
the suspect finally dropped his gun, he
was no longer a threat. One officer
approached the suspect, kicked the
pistol out of the suspect's reach, and
handcuffed him.
The officers immediately called for
medical personnel because the suspect
was still alive. The suspect was
uncuffed to receive medical aid. The
suspect was pronounced dead of multiple gunshot wounds at a local hospital.
The decedent's green coat was found at
the scene with a black ski mask, more
than 80 .22 caliber cartridges, and a
stainless steel Smith and Wesson
break front revolver with 5 .32 caliber
cartridges. Less than 1 year prior to his
death, the deceased was released from
a super maximum security prison where
he had served a lengthy sentence for
rape and burglary.
• On Thursday, November 7, 1996, at
approximately 11:05 a.m., responding
to a report of a missing elderly woman,
a Baltimore City police officer was sent
to investigate the woman’s apartment.
After discovering the elderly woman
stabbed to death on her bed, the officer
called the Baltimore City Homicide Unit
to assist with a “questionable death”
investigation. While searching the
apartment for the possible murder
weapon, a detective noticed the
suspect’s feet under a daybed in the
Policing and Homicide, 1976-96 13
living room. The officers ordered the
person under the bed to come out.
When the suspect did not respond to
their commands, the officers began to
move the bed, continuing to command
the person to get up. Suddenly the
suspect jumped up, armed with a large
butcher knife raised over his head. The
officers demanded several times that
the suspect drop the knife, but the
suspect refused and began to advance
toward one of the officers. Both officers
opened fire after the suspect’s continued refusal to drop the knife. The
suspect fell to the floor after being
struck several times in the upper torso.
The suspect was a 41-year-old male.
He was a drug user with a long prior
record of arrests (including rape,
assault, and attempted robbery). The
elderly woman was his grandmother,
with whom he lived. Family of the
suspect reported that he frequently
stole from her to support his drug habit
and had been known to be physically
abusive to her, on at least one occasion
twisting her arm and pushing her to the
ground.
threatening to crash into a pole or a car
and “take both of them out.” The officer
was pleading with the suspect to stop
the car. The suspect yelled to the
officer, “if we don’t hit a pole and kill
you, I’m going to pull your gun and
shoot you.” At that time, the officer
checked for his weapon and pulled it
out. The officer placed the weapon to
the head of the suspect telling him
numerous times to stop the vehicle or
the officer would be forced to shoot him.
When the suspect would not stop, the
officer fired one time, striking the
suspect in the head. Prior to the vehicle
striking a pole, the officer rolled out.
The suspect died at the scene.
As officers approached him, the
suspect walked away, then attempted to
run. One officer caught the suspect
and wrestled him to the ground. As the
suspect reached the ground, he pulled
a pistol from his pocket and fired at the
officers. Officers returned fire, killing
the suspect. One sergeant involved in
the shooting was shot in the side, but
was not seriously injured because he
was wearing body armor.
• At approximately 9:57 p.m., on Friday,
March 8, 1996, four Houston police
officers were dispatched to a "home
invasion in progress" call. As the
officers approached the house, they
observed a male standing in the
Houston
shadows of the doorway. Officers
asked the man to step outside and
• On Sunday, February 18, 1996, a
remove his hands from his pockets.
Harris County, Texas, deputy sheriff
The suspect responded by telling the
was working in uniform at an off-duty
officers that he had a gun and for the
job in a liquor store. (Officers may work officers to come in and get him. The
off-duty jobs in uniform after the
suspect then ran toward one of the
employer has received a permit from
officers, who discharged his weapon at
the Harris County Sheriff’s Department.) the suspect, severing the left femoral
Two males came into the store in an
artery.
attempt to purchase tequila. The
A Baltimore City Fire Department medic deputy noticed that the males were
• On the night of Tuesday, March 12,
responded to the scene and a technialready intoxicated and advised the
1996, a Houston police officer working
cian pronounced the suspect dead at
clerk not to sell the alcohol. One of the an off-duty job was called to invest1:22 p.m.
men threw four bottles of mineral water igate a loud noise complaint. As the
into a tub with other bottles, walked out uniformed officer walked from his apartCleveland
of the store, and got into his car.
ment, he observed two vehicles — one
Believing the bottles had broken, the
had the engine running. The officer
• On Friday, July 26, 1996, at approxideputy attempted to stop the man. The also observed a male standing between
mately 10:29 p.m., a Cleveland police
deputy stood between the driver’s seat the two vehicles. The officer heard a
officer observed a vehicle driving
and the open car door, but the suspect man say, "hurry up," then witnessed the
without headlights. When the officer
refused to turn off his vehicle. As the
other man jump into the vehicle with its
made a traffic stop, the suspect
suspect backed his car away from the
motor running. The officer ordered the
indicated that he had no driver’s
liquor store, the deputy was trapped and occupants to stop. The vehicle struck
license. The officer asked the suspect believed that he would be dragged
the officer in the right leg. The officer
to step out of the car. Rather than
under the car. Fearing for his life, the
fired two rounds at the vehicle, but was
obeying, the suspect put the vehicle
deputy fired his weapon two times at the unsure whether he fired before or after
into reverse, at which time the officer
suspect, striking him one time in the
he was struck. Approximately 10
reached into the vehicle in an attempt to chest.
minutes later, one suspect was found
turn off the key. The suspect began
dead at his house from a gunshot
driving at a high rate of speed holding
• On Tuesday, February 27, 1996,
wound to the head. The other suspect
onto the officer.
Houston police officers were searching confessed that they were burglarizing a
for a male escapee who was wanted for vehicle when the officer confronted
The officer was yelling for the suspect
aggravated assault of a police officer.
them.
to stop the car, but the suspect refused. After receiving a tip on the suspect's
In response to the officer hitting him
location, the officers observed the
with a flashlight, the suspect was
suspect get off a bus.
14 Policing and Homicide, 1976-98
• On Thursday, August 8, 1996,
Houston police officers were assisting a
"neighborhood protection inspector"
with inspections of abandoned houses.
As officers approached one house, a
male walked out of and away from the
house. One officer attempted to stop
the suspect who was walking away,
while the other officer walked onto the
porch. When the officer stepped on the
porch, another male suspect ran out of
the house and grabbed the officer's
weapon. Fearing for his life, the officer
fired one time, striking the suspect in
the chest.
• On Sunday, December 15, 1996, a
Harris County, Texas, deputy constable
was dispatched to a "man down" call.
The deputy observed the man lying in
the grass and approached him. The
man jumped up and grabbed a club,
which consisted of two 2x4's nailed
together with nails protruding from the
wood. The deputy drew his service
weapon, but the suspect began advancing toward him and threatening him with
the club. After the deputy retreated
approximately 140 feet, he shot the
suspect one time in the chest.
Los Angeles
• On Friday, November 8, 1996, at 5:00
a.m., Houston police patrol officers
observed two males walking down the
street carrying a television, a radio, and
a bucket of tools. As officers
approached, the suspects began acting
suspiciously and speaking Spanish to
each other. Officers heard them use
the word "pistola." One suspect
reached into his pocket as if to retrieve
a weapon. In Spanish, the officer
ordered the suspect to raise his hands,
but the suspect refused. The officer
attempted to physically control the
suspect, but the suspect broke away
and continued reaching into his pocket.
Being in fear for his life, the officer fired
two times at the suspect. The suspect
had been attempting to retrieve an open
pocket knife.
• On Tuesday, December 10, 1996,
Houston police narcotic officers were
attempting to buy 5 kilos of cocaine
through an informant. Officers
observed four suspects walking into the
parking lot with the informant. As one
of the officers was parking his car, he
heard someone yell, "police, police."
The officer then observed one male run
past him carrying a gym bag. The
officer chased the suspect, identified
himself as a police officer, and ordered
the man to raise his hands.
As the suspect raised his left hand, he
pulled a .25 caliber pistol from his right
pocket. The officer fired two times at
the suspect, striking him in the chest
and leg.
• At approximately 6:14 p.m. on Thursday, February 1, 1996, uniformed Los
Angeles police officers driving a marked
police vehicle approached the subject.
The subject produced a 9 mm pistol
and fired several shots at the officers,
hitting the police vehicle and wounding
one officer. Both officers returned fire,
wounding the subject. The subject was
subsequently transported to a Los
Angeles medical center where he
expired during surgery.
• At approximately 6:25 a.m. on Saturday, April 20, 1996, the suspect, armed
with a handgun, confronted and threatened to kill several of his apartment
complex neighbors. Los Angeles police
were notified and responded to the
scene.
Upon arrival at the apartment complex,
officers were confronted by the suspect,
who was still armed with a handgun.
The suspect pointed the handgun at
several officers, threatening to kill them.
An officer-involved shooting occurred
and the suspect sustained multiple
gunshot wounds.
A Los Angeles City Fire Department
rescue ambulance responded to the
scene. The suspect was pronounced
dead at 7:42 a.m.
• At approximately 9:40 p.m. on Saturday, July 20, 1996, an armed subject
confronted Los Angeles police officers.
The subject was shot to death.
• At approximately 4:30 p.m. on
Sunday, December 22, 1996, two
uniformed Los Angeles police officers
• At approximately 7:30 p.m. on Saturwere investigating a shoplifting in which
day, June 22, 1996, Los Angeles police two six-packs of beer were stolen from
responded to a radio call regarding a
a convenience store. As the officers
“man with a shotgun.” Arriving at the
were driving in the alley to the rear of
scene, officers were confronted by the
the store, they observed the suspect
suspect who was located at the top of a carrying a six-pack of beer in each
stairwell in front of the apartment door. hand. As soon as the officers stopped
The suspect was armed with a shotgun. their police vehicle behind the suspect,
the suspect turned and immediately
The Los Angeles Police Department’s
walked toward the right side of the
S.W.A.T. team was notified. S.W.A.T.
police vehicle. The suspect pulled a
officers were confronted by the suspect .380 caliber semiautomatic pistol from
still armed with a shotgun. When the
his right front pocket and fired two
suspect pointed the shotgun at the
rounds at the officer seated in the front
S.W.A.T. officers, the officers opened
passenger seat. Both officers opened
fire. The suspect sustained multiple
fire with their 9 mm pistols, killing the
shotgun wounds to his chest.
suspect. As a result of the suspect’s
gunfire one officer died.
A Los Angeles Fire Department rescue
ambulance responded to the scene,
where the suspect was pronounced
dead at 11:05 p.m.
Policing and Homicide, 1976-98 15
• At approximately 5:00 p.m. on
Monday, March 11, 1996, the suspect
was driving a vehicle that was stopped
in an alley. Uniformed Los Angeles
police officers approached the vehicle
to conduct a possible stolen vehicle
investigation. During the course of the
investigation, the suspect started the
vehicle in an attempt to flee, dragging
the officer alongside.
was approached by a bus driver who
told the officer that he had just seen a
man armed with a shotgun enter a
crowded office two blocks away.
Responding to the location, the officer
encountered a detective who had
observed several people fleeing the
building and had stopped to investigate.
Looking through the front window, the
officers observed the gunman shouting
and waving the shotgun at a female
An officer-involved shooting occurred
hostage. The officers entered the buildand the suspect sustained a gunshot
ing and were crawling on their hands
wound to his neck. The suspect
and knees toward the rear office when
expired at the scene. Paramedics
the gunman spotted them and twice
responded and pronounced the suspect fired at them through the office window.
As the hostage took cover under a
dead at 5:04 p.m.
desk, the detective and police officer
New York City
returned fire, striking the gunman six
times and mortally wounding him. A
• On Monday, April 8, 1996, two New
total of 20 hostages were rescued from
York City police officers were conductthe location. Recovered from the scene
ing an undercover “buy and bust” drug
were a 12-gauge shotgun, a fully loaded
operation in the Bronx. As one officer
.22 caliber revolver, 123 rounds, and
approached a group of males to
103 shotgun shells. It was learned that
purchase the drugs, he overheard
the gunman had threatened to kill
several of the males arguing. During
everyone in the office until he located
the argument a gun was mentioned.
his estranged girlfriend, an employee
The officer turned back to relay this
who had transferred to another office
information to his partner. As the two
just days earlier.
officers conferred, one officer observed
one of the male suspects brandish a
• Late one Friday night in July 1996, two
gun and fire two bullets at another
New York City police officers were on
person in the group. The officers drew routine patrol when they received a
their firearms and sought cover behind radio broadcast of a “man with a gun.”
a telephone pole. One officer identified Although they were not yet aware of it,
himself as a police officer and ordered
the subject had just robbed a grocery
the suspect to drop his weapon. The
store while armed with a .44 caliber
gunman, standing 25 feet away, turned revolver. As they pulled up to the
toward the officers and began firing his scene, they observed one of the
9 mm semi-automatic pistol at them.
robbery victims running from the store.
Both officers returned fire. During the
course of the gun battle, the officers
He told the officers that the gunman
exhausted their ammunition supply.
was still inside. Suddenly, the suspect
The perpetrator, with his gun in hand,
emerged from the store with the
then began to advance toward the
weapon in his hand. Despite repeated
officers. With no bullets remaining in
orders to drop the weapon, the suspect
their pistols, one officer retrieved his
cocked the revolver and aimed it
off-duty revolver and fired one shot at
directly at the officers. The officers fired
the advancing gunman, causing him to a total of five rounds and mortally
stagger and collapse to the ground,
wounded the perpetrator.
where he succumbed to his wounds.
• On Tuesday, September 3, 1996,
• On the morning of Thursday, May 9,
two police officers in Staten Island
1996, a New York City police officer
responded to a family dispute.
16 Policing and Homicide, 1976-98
The officers were met by the complainant across the street from the location.
She stated that her estranged husband
was in the house, in violation of an
order of protection. She said he was
not armed and informed the officers that
he had ripped the telephone from the
wall, forcing her to call the police from
outside of the house. As the officers
approached the building, the suspect
fired a rifle from the second floor of the
building, barely missing them, but piercing the gas tanks of a parked vehicle.
As the officers took cover, the gunman
fired two more shots. Pinned down by
the rifle-wielding perpetrator and with no
other way to protect either the civilian or
themselves, the officers returned fire
and mortally wounded the gunman.
Oklahoma City
• At approximately 4:37 p.m. on Thursday, April 4, 1996, Oklahoma City
Police Department officers served a
warrant for an immediate drug search
of a residence. Upon arrival at the
residence, the raid officers each went to
the position that was assigned during
the pre-raid briefing. The front door of
the residence was broken open and,
before making entry, the officers identified themselves as police officers.
As the first two officers entered the
living room, they observed a subject
lying on a sofa. The subject raised up
and pointed a long barreled handgun at
the officers. The two officers fired their
service weapons. Both officers stopped
shooting when the armed subject
collapsed to the floor.
Another subject appeared in the
doorway to the living room. He had
apparently come from another area of
the residence. The officer nearest the
doorway was grabbed from behind by
the second subject. That officer turned
and fired at the second subject. One
suspect died at the scene, and the
second suspect died later at a local
hospital.
• At approximately 12:37 a.m. on Friday,
August 6, 1996, several Oklahoma City
Police Department officers were
attempting to locate an armed subject
who was reported to be en route to his
girlfriend’s residence. Information
about the suspect had been announced
in a general broadcast over the police
radio. The suspect had been recently
released from the Oklahoma State
penitentiary. Initially, officers did not
have an address but after searching
phone records from the enhanced 911
system, dispatchers were able to find
an address for the subject’s girlfriend.
While on the phone with someone at
the girlfriend’s residence, a female
dispatcher heard what she thought
were three gunshots.
From inside the bedroom and out of
sight of the officer, the suspect
announced he was going to push the
two children out through the bedroom
door. As the suspect came into view of
the officer in the bathroom, the officer
could see that the suspect was still
armed with a handgun. The suspect
moved and was standing directly over
the body of the dead female. He began
to raise his weapon and then pointed it
in the direction of the officer in the
bedroom. The officer responded by
firing two rounds from his .45 caliber
service weapon. Both rounds struck the
suspect, killing him. The deceased
suspect had just committed three
homicides.
Philadelphia
• On Friday, June 21, 1996, at approximately 3:38 p.m., a Philadelphia police
officer responded to a “man with a
knife” disturbance. Upon arrival at the
residence, the officer was informed by a
woman yelling from the second floor of
the house that the suspect was
downstairs in the house. She told the
officer to enter through the front door as
it was already open. The officer drew
his gun, then entered the residence.
Inside, a 50-year-old male was carrying
a steak knife while walking out of the
kitchen and toward the officer. Despite
several demands from the officer to
drop the knife, the suspect continued to
approach the officer. The officer fired
his service weapon (a Glock model 17)
one time striking the suspect in the
chest. With the knife still in his right
hand, the suspect fell to the floor.
When rescue services and back-up
officers arrived, the knife was recovered
and the suspect was transported to a
local hospital. The suspect was
pronounced dead at 4:05 p.m.
• At approximately 5:25 a.m. on
Tuesday, November 16, 1996, several
Oklahoma City Police Department
officers met for breakfast at a local
24-hour restaurant. While adjusting
tables to accommodate other officers
who had not yet arrived, the officers
observed a subject sitting in a booth by
himself. The subject matched the
description of a suspect who was
wanted in connection with an “assault
• On Friday, November 15, 1996, at
The officers kicked open the apartwith a deadly weapon with intent to kill” approximately 8:51 a.m., a Philadelphia
ment’s front door. The first officer to
that had occurred earlier in the evening. police officer at a school crossing was
enter confirmed a body on the floor.
approached by a 29-year-old male in a
The officer stepped over the body in the One officer went over to the suspect
car. The man asked for directions.
hallway and moved toward a bedroom
while the other officers moved into
The officer noticed a gun in the
where he observed the body of another position to back up the confronting
suspect’s vehicle. While the officer was
female also on the floor. A small child
officer. To confirm that the suspect was investigating the incident, the suspect
was sitting on the shoulder of the dead the one who was wanted for the
pulled out another gun and shot at the
female, looking at the officer. Another
assault, the officer asked to look at the officer, striking him one time in the
child was nearby. As the officer began suspect’s forearm. The officer was
chest. The officer returned fire, striking
to move into the bedroom, a voice from looking for an identifying tattoo.
the suspect several times in the chest
the bedroom warned the officer that if
and neck. Both officer and suspect
he came in he would be shot. The only When the officer saw the identifying
were taken to a local hospital. Because
light in the bedroom was that of a televi- tattoo, he immediately began to back
the officer had been wearing a bulletsion. The officer observed the silhouaway from the booth where the suspect proof vest, he was not seriously injured
ette of a man holding a handgun. The
was seated. The seated suspect, with
and was soon released. The suspect
officer immediately retreated to a
his right hand, reached into his waistwas pronounced dead at 9:20 a.m.
nearby bathroom. The officers identiband and produced a semiautomatic
fied themselves and ordered the
pistol. The officer ordered the suspect
suspect to drop his weapon. When the down, but the suspect ignored the order
gunman changed locations inside the
and brought the gun above the table
bedroom, the officer attempted to
top. All four officers began shooting at
verbally coax the children out of the
the suspect. The suspect was struck
bedroom.
several times and died at the scene.
When responding officers arrived at the
apartment, the first responding officer
knocked on the front door without a
response. Officers were able to peer
inside the apartment through a window
near the front door. From the window
the officers observed what appeared to
be blood spattered on the walls and a
person lying on the floor.
Policing and Homicide, 1976-98 17
• On Sunday, November 17, 1996, at
approximately 1:08 a.m., three Philadelphia police officers responded to a
“burglary in progress” call. While covering the rear of the residence, two
officers witnessed a male exiting the
property. The suspect fired a weapon
at the officers. Both officers returned
fire with their service weapons (Glock,
model 17; Glock, model 19), hitting the
suspect in the chest, neck, shoulder,
and hand.
A second male suspect pushed open
the front door. Seeing a police officer
covering the front of the residence, the
second suspect fired a weapon from
inside the house at the officer. The
officer returned fire, hitting the second
suspect in the chest. The suspect
collapsed on the sidewalk in front of the
house. At the time of the shooting, the
other two officers were inside the
house.
The first suspect was taken to a local
hospital where he was pronounced
dead. The second suspect was
pronounced dead at the scene. Both
guns used by the suspects were recovered at the scene.
18 Policing and Homicide, 1976-98
Police officers murdered by felons, 1976-98
Throughout this report, the term “police
officer” refers to persons with sworn
arrest powers. Such persons include
sheriffs, deputies, State troopers, and
other law enforcement officers.
police officer, and such information on
• On average, 79 law enforcement
the felon as age, race, gender, and prior officers were murdered in the United
record.
States each year from 1976 to 1998,
but the annual number is dropping
Drop in murders of police officers
(figure 12).
When a felon murders a police officer in
the line of duty, the deceased officer’s
agency voluntarily sends a record of the
offense to the FBI in Washington. The
record is then entered into a national
database. The database contains such
information as the officer’s age, race,
and gender, the number of years as a
According to national data on felonious
killings of police officers —
• 1,820 law enforcement officers were
murdered between 1976 and 1998.
Number of police officers murdered by felons, 1976-98
Number of police officers
1978
1988
1998
Number of
police officers
murdered
93
78
61
• There is little correspondence between
trends in the murder of police officers
and trends in justifiable homicides
by police (the correlation is +0.3)
(figure 13).
• Of all the murders of police officers
from 1987 to 1998 (834), about 1 in 6,
or 15% (129), were by felons who were
then killed by police in a justifiable
homicide.
100
• Of all the justifiable homicides by
police from 1987 to 1998 (4,535), about
3% (129) were of felons who had
murdered a police officer.
Police officers murdered
50
0
1976
1982
1988
1994
1998
Figure 12
Number of police officers murdered by felons compared to the
number of felons killed by police in justifiable homicides, 1976-98
Number of homicides
480
Felons killed
400
320
240
160
Officers murdered
80
0
1976
1982
1988
1994
1998
Figure 13
Policing and Homicide, 1976-96 19
Table 8. Police officers murdered by
felons: Percent wearing body armor
at the time of death, 1981-98
Year
Percent of murdered
officers wearing body armor
Annual average
33%
1981
1982
1983
1984
12%
15
25
24
1985
1986
1987
1988
1989
19%
24
25
26
32
1990
1991
1992
1993
1994
25%
34
27
56
47
1995
1996
1997
1998
46%
56
42
57
Note: Data on police killed wearing body
armor are not available prior to 1981.
Source: FBI, Law Enforcement Officers
Killed and Assaulted.
Perhaps an explanation for the drop
in police officer murders has something
to do with increasing police use of
bullet-proof vests and other types
of body armor. Presumably the more
often that police wear body armor, the
less often that police die in violent
encounters with felons. Needed to test
this explanation are annual statistics
that indicate what percentage of law
enforcement officers wear body armor.
While such statistics apparently do not
exist, annual statistics do exist that
indicate what percentage of murdered
officers are wearing armor at the time of
their attack. These statistics should
suffice so long as it is assumed that
increases in the percentage of
murdered officers wearing armor mirror
a broader trend toward increasing use
of body armor by police. Consistent
with this explanation —
• Police wearing of body armor has
risen (as reflected in the percentage of
murdered officers who are wearing
armor at the time of their attack) and
police deaths have fallen (table 8).
Police officers murdered by felons:
Rate per 100,000 officers, 1976-98
Rate per 100,000 officers
30
Police officers murdered
20
10
0
1976
1982
1988
Figure 14
20 Policing and Homicide, 1976-98
1994
1998
Other factors beyond increased use of
body armor probably have contributed
to the drop in murders of police officers.
These other factors include better training, better communications, and better
police practices.
Drop in rate of murder of police
officers
From 1976 to 1998, on average 17 of
every 100,000 police officers were
murdered annually. Each year this was
an average of more than 1 murdered for
every 6,500 law enforcement officers.
A police officer's risk of being murdered
has dropped (figure 14):
In 1978, 1 in 4,000 police officers was
murdered
In 1988 1 in 6,000 police officers was
murdered
In 1998 1 in 11,000 police officers was
murdered.
Table 9. Police officers murdered by felons:
Percent killed with firearm and percent slain
with own weapon, 1976-98
Year
Annual average
Total number Percent of murdered police
of officers
officers killed with —
murdered
a firearm
their own firearm
79
92%
12%
1976
1977
1978
1979
111
93
93
106
85%
89
98
94
14%
10
15
16
1980
1981
1982
1983
1984
104
91
92
80
72
91%
95
89
93
92
13%
13
5
15
17
1985
1986
1987
1988
1989
78
66
74
78
66
90%
94
89
97
86
14%
23
18
15
15
1990
1991
1992
1993
1994
66
71
64
70
79
86%
96
86
96
99
5%
11
6
7
8
1995
1996
1997
1998
74
61
70
61
84%
93
96
95
8%
7
7
10
Police officers murdered with
their own firearm
Firearms claimed the lives of 92%
of the 1,820 law enforcement officers
murdered from 1976 to 1998 (table 9).
Twelve percent of murdered officers
were killed with their own firearms
during the 23-year period. The vast
majority of the officers who were slain
with their own weapons were killed with
a handgun.
Police officers slain with their own firearm
Number Percent
1978
14
15.1%
1988
12
15.0
1998
6
9.8
Source: FBI, Law Enforcement Officers Killed and Assaulted.
Policing and Homicide, 1976-98 21
Circumstances at scene of incident
On average, 39% of officers lost their
lives during arrest situations. One in
six officers (16%) were killed while
responding to disturbance calls, 14%
were killed while enforcing traffic laws,
14% were slain while investigating
suspicious persons or circumstances,
and 11% were killed in an ambush
situation (table 10).
Table 10. Police officers murdered by felons: Circumstances at scene of incident, 1976-98
Year
Annual average
Total number
of officers
Disturbance Arrest
murdered
calls
situations
Handling,
transporting,
custody of
Civil
disorders prisoners
Investigating
suspicious
persons/
Ambush
circumstances situation
Mentally
deranged
Traffic
pursuits/
stops
79
16%
39%
0%
4%
14%
11%
2%
14%
1976
1977
1978
1979
111
93
93
106
18%
24
11
16
44%
42
42
44
0%
0
0
0
4%
8
8
3
10%
10
9
9
12%
4
13
10
4%
0
3
4
9%
13
15
14
1980
1981
1982
1983
1984
104
91
92
80
72
12%
21
20
19
11
46%
41
39
39
49
0%
0
1
0
0
1%
1
3
4
4
16%
11
11
13
14
7%
10
10
11
11
2%
2
2
1
0
16%
14
14
14
11
1985
1986
1987
1988
1989
78
66
74
78
66
17%
9
30
9
20
37%
39
37
42
36
0%
0
0
0
0
5%
8
8
3
9
12%
17
7
28
15
9%
8
6
9
6
0%
5
1
1
3
21%
15
11
8
11
1990
1991
1992
1993
1994
66
71
64
70
79
15%
24
17
14
10
46%
20
42
40
42
0%
0
0
0
0
3%
9
3
1
1
14%
14
11
21
19
12%
16
11
7
10
2%
0
0
1
5
9%
18
16
14
13
1995
1996
1997
1998
74
61
70
61
11%
7
20
26
28%
41
30
26
0%
0
0
0
5%
0
6
7
23%
21
14
10
19%
12
17
16
1%
2
1
0
12%
18
11
15
Note: Detail may not sum to 100% due to rounding error. Disturbance calls include: bar fights, man with gun, family quarrels.
Arrests situations include: burglaries in progress/pursuing burglary suspects, robberies in progress/pursuing robbery suspects,
drug-related matters, attempting other arrests. Civil disorders include: mass disobedience, riot.
Ambush situations include: entrapment/premeditation, unprovoked attack.
Source: FBI, Law Enforcement Officers Killed and Assaulted.
22 Policing and Homicide, 1976-98
Officer's age
Under 25
25 to 30
31 to 40
41 or older
Murdered police officers
According to FBI national data on
felonious killings of police officers
from 1976 to 1998 —
Officers' gender
Officers' age
• Police officers slain in the line of duty
were almost always males (98%)
(table 12).
• 65% were over 30 years of age
(table 11).
Table 12. Gender of police officers
murdered by felons, 1976-98
Table 11. Age of police officers
murdered by felons, 1976-98
Year
8%
27
36
29
Percent of murdered officers who were —
Under 25 25-30
31-40 41 or older
Year
8%
27%
36%
29%
Annual average
1976
1977
1978
1979
11%
11
14
9
32%
39
30
20
28%
23
30
41
29%
27
26
30
1980
1981
1982
1983
1984
12%
13
9
10
6
26%
23
24
30
28
43%
42
44
45
40
1985
1986
1987
1988
1989
5%
8
11
15
5
26%
30
26
15
20
1990
1991
1992
1993
1994
5%
7
6
6
8
1995
1996
1997
1998
8%
4
2
11
Annual average
Percent of murdered officers
Male
Female
98%
2%
1976
1977
1978
1979
100%
99
100
99
0%
1
0
1
19%
22
23
15
26
1980
1981
1982
1983
1984
99%
98
97
100
94
1%
2
3
0
6
35%
29
32
40
38
34%
33
31
30
37
1985
1986
1987
1988
1989
96%
98
100
97
97
4%
2
0
3
3
14%
27
21
38
26
41%
36
39
34
38
40%
30
34
22
28
1990
1991
1992
1993
1994
98%
96
100
94
96
2%
4
0
6
4
26%
35
26
30
24%
39
35
28
42%
22
37
31
1995
1996
1997
1998
99%
96
100
90
1%
4
0
10
Source: FBI, Law Enforcement Officers
Killed and Assaulted.
Source: FBI, Law Enforcement Officers Killed
and Assaulted.
Policing and Homicide, 1976-98 23
Officers' race
Race of police officers murdered by felons:
Percent white and black, 1976-98
• 86% of murdered officers were white
and 13% were black (figure 15).
Percent of murdered officers
100%
Officers' other characteristics
80%
• 72% of officers murdered from 1976
to 1996 were wearing their uniform
(table 13).
White officers
60%
• Murdered police officers had an
average of 9 years of law enforcement
service.
40%
Black officers
20%
Years of service
Less than 1
6%
1 to 4
29
5 to 10
31
Over 10
34
0%
1976
1982
1988
1994
1998
Figure 15
Detailed racial statistics for the 1990's
Table 13. Police officers murdered
by felons: Percent wearing uniform
at time of death, 1976-98
Year
Table 14. Age of felons who
murdered police officers: Percent
under age 18 and age 18-30, 1976-98
Percent wearing uniform
Annual average
72%
1976
1977
1978
1979
71%
81
80
71
1980
1981
1982
1983
1984
69%
80
52
80
75
1985
1986
1987
1988
1989
73%
67
79
68
67
1990
1991
1992
1993
1994
63%
73
65
81
63
1995
1996
1997
1998
66%
78
75
79
Source: FBI, Law Enforcement Officers
Killed and Assaulted.
Year
Percent of murderers of
police officers who were —
Age
Under
age 18
18-30
Annual average
10%
54%
1976
1977
1978
1979
10%
11
8
5
45%
58
62
60
1980
1981
1982
1983
1984
9%
7
5
8
20
62%
46
57
47
53
1985
1986
1987
1988
1989
4%
2
13
5
7
59%
58
41
63
42
1990
1991
1992
1993
1994
8%
9
13
20
18
53%
60
54
47
47
1995
1996
1997
1998
18%
7
3
13
46%
66
58
58
Source: FBI, Law Enforcement Officers
Killed and Assaulted.
24 Policing and Homicide, 1976-98
• According to statistics for 1993-98,
white police officers made up about
87% of all police officers in the United
States and 83% of all police officers
murdered by felons. Black officers
were 11% of police officers but 15% of
those murdered, and officers of other
races were 2% of police officers and
2% of those murdered.
Felons who murdered police officers
According to FBI national data on felonious killings of police officers from 1976
to 1998 —
Felons' age
• Most persons who murdered police
were ages 18 to 30 (54%) (table 14).
According to FBI national data on feloni- Felons' race
ous killings of police officers from 1976
• Most persons who murdered a police
to 1998 —
officer were white (54%) (table 16).
Felons' gender
• Blacks made up about 12% of the
• Persons who murdered a police officer U.S. population but were 43% of the
were almost always males (97%)
felons who murdered a police officer;
(table 15).
whites were about 83% of the U.S.
population but about 54% of murderers
of police officers.
Table 15. Gender of felons who murdered
police officers, 1976-98
Year
Percent of murderers
of police officers
Male
Female
• Murderers of police officers represent
a tiny fraction of the total population.
Of the Nation's 89 million white males
(age 13 or older), 35 murdered a police
officer in 1998. Of the 12 million black
males (age 13 or older), 21 murdered
an officer that year. White males were
41% of the U.S. population (age 13 or
older) and 58% of those who murdered
a law enforcement officer. Black males
were 6% of the population (age 13 or
older) and 35% of the murderers of
officers.
Table 16. Race of felons who murdered police
officers, 1976-98
Year
Percent of murderers
of police officers
White
Black
Other
Annual average
97%
3%
Annual average
54%
43%
3%
1976
1977
1978
1979
94%
99
94
97
6%
1
6
3
1976
1977
1978
1979
54%
58
56
51
43%
37
39
47
3%
5
5
2
1980
1981
1982
1983
1984
93%
96
95
97
98
7%
4
5
3
2
1980
1981
1982
1983
1984
57%
41
61
66
55
43%
57
38
32
38
0%
2
1
2
7
1985
1986
1987
1988
1989
99%
97
91
98
96
1%
3
9
2
4
1985
1986
1987
1988
1989
47%
60
65
58
56
50%
37
35
42
42
3%
3
0
0
2
1990
1991
1992
1993
1994
94%
99
99
99
96
6%
1
1
1
4
1990
1991
1992
1993
1994
56%
54
53
43
54
43%
45
46
57
43
1%
1
1
0
3
1995
1996
1997
1998
92%
99
100
99
8%
1
0
1
1995
1996
1997
1998
56%
45
50
58
40%
48
41
35
4%
7
9
7
Source: FBI, Law Enforcement Officers
Killed and Assaulted.
Source: FBI, Law Enforcement Officers
Killed and Assaulted.
Policing and Homicide, 1976-98 25
According to FBI national data on feloni- Felons' race and officers' race, 1980-98
ous killings of police officers from 1976
A total of 1,417 law enforcement
to 1998 —
officers were murdered during the
Felons' criminal record
period 1980 to 1998, and —
• Two-thirds of the felons who murdered • In most of the murders of police
a police officer had a prior criminal
officers between 1980 and 1998 (62%),
the officer's race and the felon’s race
arrest (figure 16).
were the same:
• Half were convicted in the past.
• A third had a prior arrest for a violent
crime.
• A fifth were on parole or on probation
at the time of the murder.
• 4% had a prior arrest for murder
charges.
• 24% had a prior arrest for narcotic
drug law violations.
• 11% had a prior arrest for assaulting
police or resisting arrest.
Intraracial
White felon kills white officer
Black felon kills black officer
Other-race felon kills otherrace officer
Percent of murderers of police officers
100%
80%
Prior arrest
Criminal arrest
60%
40%
Violent crime
20%
Assaulting police
0%
1988
Figure 16
26 Policing and Homicide, 1976-98
Victim statistics provide one perspective
on the number of police murders that
are interracial (for example, of all black
officers murdered from 1980 to 1998,
19% were murdered by a white felon).
Offender statistics provide another
perspective (for example, of all white
felons who murdered a police officer
from 1980 to 1998, 3% of the murdered
officers were black).
The extent to which murders of police
officers are interracial depends on
which statistics — victim or offender —
are used:
• When a white police officer is
murdered, the offender is usually a
white (60%); and when a black police
officer is murdered, the offender is
usually a black (76%).
• When a black felon murders a police
officer, the officer is usually a white
(74%); and when a white felon murders
a police officer, the officer is usually a
white (95%).
Felons who murdered police officers:
Percent with criminal history, 1976-98
1982
0.6
Interracial
White felon kills black officer
2.4%
Black felon kills white officer
28.5
White felon kills other-race officer
0.4
Black felon kills other-race officer
0.0
Other-race felon kills white officer
2.6
Other-race felon kills black officer
0.1
Multiple felons of different races kill —
white officer
2.9%
black officer
0.6
other-race officer
0.0
• 28% had a prior arrest for weapons
violations.
1976
51.9%
10.0
• 38% of murders of police officers are
interracial (for example, a white felon
killing a black officer, or a black felon
killing a white officer).
1994
1998
Felons' age, race, and gender, 1980-98
• Murderers of police officers represent
a tiny fraction of the total population.
Of the Nation’s 18.3 million young white
males (white males ages 13 to 24),
17 murdered a police officer in 1998.
Of the 3.4 million young black males,
13 murdered an officer that year.
On average from 1980 to 1998 —
• Young black males murdered police
officers at a rate almost 6 times that of
• Young white males made up about 8% young white males (5.7 versus 1 per
of the population but 20% of felons who million population) (figure 18).
murdered a police officer (figure 17).
Young black males made up about 1% Descriptions of actual cases
of the population but 21% of felons who of police officers killed in the line
murdered a police officer.
of duty
Descriptions of actual cases of police
officers killed in the line of duty can be
found in the annual FBI publication,
Law Enforcement Officers Killed and
Assaulted, or on the FBI website at
http://www.fbi.gov/ucr.htm.
Felons who murdered police officers:
Percent young white and black males, 1980-98
Percent of murderers of police officers
40%
30%
Young white male felons
20%
Young black male felons
10%
0%
1980
1986
1992
1998
Figure 17
Felons who murdered police officers:
Rate per 1 million population for young white and black males, 1980-98
Rate per 1 million U.S. population ages 13-24
12
10
8
6
4
Young black male felons
2
Young white male felons
0
1980
1986
1992
1998
Figure 18
Policing and Homicide, 1976-98 27
Methodology
The SHR national database
on justifiable homicides by police
Ideally, every time police kill a felon in a
justifiable homicide, a record of the
event is sent to the FBI in Washington.
Each record of justifiable homicide
received by the FBI is then entered into
the Supplemental Homicide Reports
(SHR) database.
The number of justifiable homicides by
police in the year is available in two
places: the SHR database and the FBI
annual publication Crime in the United
States. (The first published count
covers 1987.)
Evolution of the SHR database
Three stages describe the evolution of
the SHR database.
1. Early stage: 1963 to 1967
In the early 1960's the FBI started the
SHR database. Police departments
across the Nation began sending to the
FBI a record of each murder (including
nonnegligent manslaughter) in their
jurisdiction. The first records covered
murders occurring in 1963.
The FBI decided to expand the
database to include justifiable
homicides by police and civilians. The
Published counts found in Crime in the first records received were for justifiable
United States do not agree precisely
homicides occurring in 1966 and 1967.
with the number of justifiable homicides The records included the age, race, and
by police found in the database (see
gender of persons justifiably killed. The
below). Moreover, in certain years
age, gender, and race of the police
there are police justifiable homicides in officers involved in the homicides were
a State that are unaccounted for either not included because this information
in the annual publication or in the SHR
was not requested. The FBI did not
database. (The FBI publication
disseminate statistics on 1966 and 1967
routinely summarizes year-to-year
justifiable homicides because the
counts of justifiable homicides in a
records were based on too few police
table. Summary counts in this table are departments.
often not national in scope. To avoid
confusion, the table should alert readers 2. Middle stage: 1968 to 1975
when States are missing.)
The cooperation of the Nation's police
Two sources of FBI statistics on the annual departments grew to the point where
number of justifiable homicides by police:
the FBI began disseminating statistics
published versus SHR database
on justifiable homicides by police. The
earliest statistics covered those justifiYear
Published
SHR
Difference
able homicides occurring in 1968.
1998
365
367
2
1997
366
361
5
Statistics from 1968 to 1986 were not
1996
358
355
3
published but were made available
1995
389
382
7
upon request. FBI statistics from 1987
1994
462
459
3
and later were routinely published.
1993
455
453
2
1992
1991
1990
1989
1988
1987
418
366
385
363
343
300
414
359
379
362
339
296
4
7
6
1
4
4
28 Policing and Homicide, 1976-96
Justifiable homicides in the SHR
database for 1968 through 1975
contained information on the age, race,
and gender of persons killed by police,
but no information on the officers
involved in these incidents. According
to the database, the number of justifiable homicides by police from 1968 to
1975 was:
Year
1968
1969
1970
1971
1972
1973
1974
1975
Number of justifiable
homicides by police
395
424
412
557
469
492
553
559
3. Current stage: 1976 to present
After 1975 the FBI expanded the scope
of the SHR database to include information (age, race, gender) on the police
officers who commit justifiable
homicide.
Nonjustifiable homicide by police
In addition to justifiable homicides by
police, the SHR database also contains
records of two other types of homicide:
• a record of each justifiable homicide
by citizens
• a record of each murder.
While the database has primarily a
statistical purpose, one statistic that is
impossible to obtain from it (or from any
currently existing database) is the
number of murders by police. Murder is
a type of nonjustifiable homicide. If a
police officer deliberately kills someone
and the homicide is not justified, that
type of nonjustifiable homicide is
supposed to go into the database as a
"murder." Undoubtedly some of the
"murders" in the SHR database are
murders by police officers, but their
number is unknown because nothing in
the database distinguishes murders by
police officers from murders committed
by others. Consequently the annual
number of nonjustifiable homicides by
police in the United States is unknown.
Errors in the SHR database
If the SHR database had the name of
the officer who committed the homicide,
the process would be fairly simple: find
Justifiable homicides by police for an
the officer's name and check to see if
entire State are sometimes missing
the homicide is classified as "justifiable
from the SHR database. One way of
determining whether a State is missing homicide by police" or "murder." But
the database has no names. So the
in a particular year is to examine the
check must rely on other recorded
number of justifiable homicides that
State reported in previous years. If the information about the incident: the
month and year of the homicide; the
State reports a sizable number year
police agency in whose jurisdiction the
after year but then reports none, that
homicide occurred; the age, race, and
probably indicates the State is missing
gender of the victim; the age, race, and
from the database. For example, in a
gender of the offender; the type of
large State such a Florida, there is at
weapon used; the number of victims in
least one justifiable homicide by police
the incident; the number of offenders in
each year. Yet none are recorded in
the incident; and victim-offender
the SHR database for Florida for certain relationship.
years.
To illustrate this type of check, eight
The opposite problem — too many
news accounts were obtained of police
rather than too few records of justifiable officers convicted of murder in the line
homicide by police in the database —
of duty. In four of the eight the check
also exists. To understand how that
was inconclusive:
happens, imagine an officer deliberately
killing a citizen in circumstances that
1. The SHR database has a record of a
initially appear to warrant lethal force.
homicide occurring in the place and on
The police department sends a record
the date shown in the news account,
to the FBI showing the incident to be a
but the database is missing too much
justifiable homicide, but some time later data to match the news account.
a judge or jury decides that the killing
was unlawful and finds the officer guilty 2. The SHR database has a record of a
of murder. The FBI urges police
homicide occurring in the place and on
departments to send in a revised record the date shown in the news account,
in such situations so that the SHR
but some of the information in the SHR
database can be updated. But if the
database does not match the homicide
police department fails to do that, the
in the news account.
killing will remain in the database as a
"justifiable homicide by police" when it
For the remaining four news accounts
should instead be coded as a “murder” the homicide characteristics in the SHR
on the “circumstance” variable.
database did match those in the news
account.
Nonjustifiable homicides by police
in the SHR database
1. In two cases the homicide is classified correctly as "murder." In both
The number of nonjustifiable homicides cases there is evidence of an update,
by police (or murders) incorrectly
possibly to change the classification
labeled as "justifiable homicide" in the
from "justifiable homicide by police" to
SHR database is unknown. One way to "murder" when the officer was
spot these errors is to find in the
convicted.
database a case labeled as "justifiable
homicide by police" that actually
2. The other two cases are coded
involved a police officer known to have incorrectly: one as "justifiable homicide
been convicted of murder for that
by police" and one as "undetermined."
homicide.
The news accounts indicated that the
police officers involved in these two
cases were convicted of murder or
manslaughter.
Justifiable homicides by police
missing from the SHR database
The number of missing justifiable
homicides by police is unknown, but
one way to spot missing records is by
examining reporting by States that,
because of their large populations, are
almost certain to have had at least one
justifiable homicide by police in a year.
A year with no recorded justifiable
homicide by police suggests missing
information. A problem with this
method of identifying missing data is
that a State can still have a sizable
number of justifiable homicides in the
database even when a big city police
department in that State fails to send in
any records. Nevertheless, it is instructive to search the SHR database for
years in which a large State has no
justifiable homicides. For 1976 to 1998,
the results are summarized below:
States with justifiable homicides
by police but no record of them
in the SHR database that year
Year
1988
1989
1990
1991
1993
1994
1995
1996
1997
1998
Florida, Kentucky
Florida
Florida
Florida
Kansas
Kansas
Illinois, Kansas
District of Columbia, Kansas
Florida, Kansas
District of Columbia, Florida,
Kansas, and Wisconsin
Statistics given in this report were not
adjusted to account for missing States.
For example, figure 1 "national" counts
of justifiable homicides are not adjusted
for justifiable homicides thought to be
missing for two States (Florida and
Kentucky) in 1988. However, were
adjustment made by including in the
figure only those States that were missing no data throughout the period from
1976 to 1998, figure 1 would not look
much different from how it looks now.
Policing and Homicide, 1976-98 29
Adjusted and unadjusted numbers of
justifiable homicides by police have a
strong positive correlation (+0.95).
Similarly, figure 2 "national" rates of
justifiable homicide are not adjusted for
States missing for certain years. To
illustrate, no justifiable homicides were
recorded for Kansas 1995, but the base
for the 1995 "national" rate includes the
Kansas population. However, excluding
populations of missing States would
have made little difference since
adjusted and unadjusted rates of justifiable homicides by police have a strong
positive correlation (+0.99).
gender." To police agencies, the only
"offenders" in a justifiable homicide are
the felons. Consequently, police
agencies may occasionally report felon
characteristics under both "victim" and
"offender" headings.
The effect of such occasional errors on
the national statistics presented in this
report is generally small. Excluding
cases in which the age, race, and
gender of felon and officer are identical
made little difference in this report's
main findings. The one instance of a
sizable effect was the percentage of all
justifiable homicides that were "black
officer kills black felon” (figure 11).
The percent of justifiable homicide that
Misinformation in the SHR database
were “black officer kills black felon” was
regarding officer characteristics
14% in 1993, 20% in 1994, and 12% in
1995. The large rise from 14% in 1993
to 20% in 1994 was due to a large
Of the 8,578 records in the SHR
database on justifiable homicides by
number of justifiable homicides in 1994
police from 1976 to 1998, about 5,800
that involved felons and officers with
records include both the felon’s and the identical characteristics. More specifiofficer's age, race, and gender. In
cally, the large increase is attributable to
about 4.6% of these 5,800 records (270 the New York City Police Department’s
cases), the felon’s and officer's age,
reporting an unusually large number of
race, and gender are identical. For
"black officer kills black felon" justifiable
example, the SHR database describes homicides.
both the felon and the officer as a
41-year-old white male.
Over the 23 years from 1976 to 1998,
270 felons killed in justifiable homicides
By chance alone the age, race, and
had the same age, race, and gender as
gender of the felon and the officer can
the officer. Of the 270 felons, 68.9%
be the same, but a 4.6% match rate is
were white, 30.7% were black, and .4%
too high to be explained solely by
were of other races.
chance. (The likelihood of a chance
match is no more than 1% of cases.)
Missing characteristics of felons
and officers in the SHR database
One explanation for identical felon and
officer characteristics may be confusion The gender, race, and age of felons
about how to fill out the FBI form. The
killed by police are rarely missing in the
form for reporting justifiable homicide is SHR database (data for figure 8).
the same one used to report murders.
However, it is not uncommon for the
The form designates the person who
gender, race, and age of the officers to
commits the murder as the "offender"
be missing.
and the murdered person as the
"victim." Police agencies reporting a
justifiable homicide by police are
instructed to record the felon’s age,
race, and gender under "victim's age,"
"victim's race," and "victim's gender."
The officer's age, race, and gender are
to be recorded under "offender's age,"
"offender's race," and "offender's
30 Policing and Homicide, 1976-98
Cautionary note on this report's
statistics on justifiable homicides
by police
All statistics in this report on justifiable
homicides by police are known to be
missing homicides by police in Florida
from 1988 to 1991, 1997, and 1998; in
Kentucky in 1988; in Kansas from 1993
to 1998; in Illinois in 1995; Wisconsin
in 1998; and in the District of Columbia
in 1996 and 1998. Other justifiable
homicides by police are probably
missing as well. In addition, some
small but unknown number of homicides labeled "justifiable homicides
by police" are probably nonjustifiable
homicides.
Certain statistics (for example, the
number and rate of justifiable homicides
by police) are probably more affected by
these errors than other statistics in the
report (for example, the percentage of
persons killed who are male, and the
percentage of justifiable homicides that
involve a firearm).
Justifiable homicides by police
in cases involving more than
one officer
In 86% of justifiable homicides by
police, there was a single police officer
("1-officer cases"), in 10% there were 2
officers ("2-officer cases"), and in the
remaining 4% there were 3 or more. In
this report’s tabulations, when more
than one officer killed the felon, the
officer described first in the database
supplied the officer’s characteristics
(age, race, and gender). Using just the
characteristics of the first officer is
sensible if that officer resembles the
other officers in the incident. To check
the resemblance, first-officer and
second-officer characteristics were
compared, and results indicated that, in
the vast majority of cases, there was a
close match.
Source of national statistics on
police officers murdered by felons
Most of the data in this report on
murdered police officers were obtained
directly from the annual FBI publication
Law Enforcement Officers Killed or
Assaulted. However, the source of the
1980-98 data on interracial and intraracial murder of police officers was a
tabulation prepared by the FBI specifically for this report.
Source of size and characteristics
of U.S. police force
The source for the number of full-time
sworn officers in the Nation is the FBI's
annual publication Crime in the United
States. Regarding the racial make-up
of the Nation's police officers in the
1990's, the only existing data are for
1993 and 1997. The BJS publications
containing the 1993 data are:
• Local Police Departments, 1993,
April 1996, NCJ 148822.
• Sheriffs' Departments, 1993,
June 1996, NCJ 148823.
• Law Enforcement Management and
Administrative Statistics, 1993: Data for
Individual State and Local Agencies
with 100 or More Officers,
September 1995, NCJ 148825.
The titles for the BJS publications
containing the 1997 data are the same
except for the year designation.
• Law Enforcement Management and
Administrative Statistics, 1997: Data for
Individual State and Local Agencies
with 100 or More Officers,
April 1999, NCJ 171681.
• Local Police Departments, 1997,
February 2000, NCJ 173429.
According to these publications, the
racial make-up of the Nation's police
force changed only slightly from 1993 to
1997 (1% drop in "white" and 1% rise in
"other races"). In 1993, 88% of all
police officers were white, 11% were
black, and 1% were other races. In
1997, the comparable figures were 87%
white, 11% black, and 2% other races.
The percentages given in this report for
the racial classification of the police
force in 1998 and in the 1990’s are
based on the 1997 statistics. Note that
officers designated "Hispanic" in the
publications were classified as "white."
There are no official national statistical
data on the number of times police
were justified in using lethal force
(during violent and mass rioting, for
example), but instead used less-thanlethal force. (For example, rather than
using bullets, police can use a weapon
that fires small beanbags or hard plastic
rounds from a shotgun; there are also
foams that can be sprayed by police
that literally stop offenders in their
tracks).
Additional information about the police
use of force can be found in the
following:
Police use of non-lethal force
To learn more about the use of force
requires an understanding of the
reasons for and the results of policecitizen encounters. During 1996 (and
again in 1999*), the Bureau of Justice
Statistics (BJS) carried out a special
survey of 6,421 residents age 12 or
older entitled the Police-Public Contact
Survey.
The Police-Public Contact Survey has
made possible, for the first time,
estimates of the prevalence of all kinds
of contacts between the police and
members of the public, favorable as
well as unfavorable. Results indicate
that a small percentage of police-public
contacts results in the use of force.
In 1996, for example, about 45 million
Americans age 12 or older (about 1 in 5
residents of this age) were estimated to
have had at least one face-to-face
contact with a police officer. Of these,
about 500,000 (about 1 in 500 residents
age 12 or older) were estimated to have
experienced force or threat of force
by police during 1996.
*Findings from the 1999 Police-Public Contact
Survey were published in January 2001.
Alpert, Geoffrey. Police Pursuit Driving
and the Use of Excessive Force. NIJ
Final Report, Grant No. 95-IJ-CX-0066,
1996.
Binder, Arnold; Peter Scharf; and
Raymond Galvin. Use of Deadly Force
by Police Officers. NIJ Final Report,
Grant No. 79-NI-AX-0134, 1982.
Bureau of Justice Statistics. Police Use
of Force: Collection of National Data,
NCJ 165040, November 1997.
Fridell, Lorie A. and Antony M. Pate.
Death on Patrol: Felonious Homicides
of American Police Officers. NIJ Draft
Final Report, Grant No. 91-IJ-CX-K025,
1995.
Garner, Joel; John Buchanan; Tom
Schade; and John Hepburn. Understanding the Use of Force By and
Against the Police. NIJ Research in
Brief, 1996.
Geller, William A. and Hans Toch, eds.
And Justice for All: A National Agenda
for Understanding and Controlling
Police Abuse of Force. Washington,
D.C.: Police Executive Research
Forum, 1995.
• Sheriffs' Departments, 1997,
February 2000, NCJ 173428.
Policing and Homicide, 1976-98 31
Matulia, Kenneth J. A Balance of
Forces. Gaithersburg, MD: International Association of Chiefs of Police,
1982.
Pate, Antony M. and Lorie A. Fridell.
Police Use of Force: Official Reports,
Citizen Complaints, and Legal Consequences, Volumes I and II.
Washington, D.C.: The Police Foundation, 1993.
Pinizzotto, Anthony J.; Edward F. Davis;
and Charles E. Miller III. In the Line of
Fire: A Study of Selected Felonious
Assaults on Law Enforcement Officers.
Washington, D.C.: U.S. Department of
Justice, 1997.
Scrivner, Ellen M. The Role of Police
Psychology in Controlling Excessive
Force. NIJ Research Report,
NCJ-146206, 1994.
A new source of data on police
officers killed and assaulted
A growing number of law enforcement
agencies are adopting a new type of
record keeping system — called
National Incident Based Reporting
System or NIBRS — for compiling
crime statistics. While NIBRS data
cannot distinguish nonjustifiable
homicides by police from other nonjustifiable homicides, these data do provide
a source of various statistics on justifiable homicides by police; for example,
the number of justifiable homicides by
police occurring as a result of attacking
the officer, or fleeing from a crime, or
resisting arrest, or committing a crime.
NIBRS data also provide a source of
statistics on murders of, or assaults on,
law enforcement officers.
32 Policing and Homicide, 1976-98
NIBRS records also have information
about other offenses that were committed as part of the same incident (if any),
other arrestees (if any), and additional
victims (if any).
Bureau of Justice Statistics reports that
use NIBRS data include:
Effects of NIBRS on Crime Statistics
(BJS 7/2000, NCJ 178890)
Sexual Assault of Young Children as
Reported to Law Enforcement: Victim,
Incident, and Offender Characteristics
(BJS 7/2000, NCJ 182990)
Office of Juvenile Justice and Delinquency Prevention reports that use
NIBRS data include:
Characteristics of Crimes Against
Juveniles (OJJDP 6/2000, NCJ 179034)
Kidnaping of Juveniles: Patterns From
NIBRS (OJJDP 6/2000, NCJ 181161)
To obtain copies of these reports,
please contact the National Criminal
Justice Reference Service (NCJRS)
at 1-800-732-3277 or at
http://www.ncjrs.org/.
Data for figure 1. Felons killed
by police in justifiable homicides,
1976-98
Year
Annual average
Data for figure 2. Felons killed by police
in justifiable homicides: Rate per 1 million
U.S. population age 13 or older, 1976-98
Total number of
justifiable homicides
Total
number of
justifiable
homicides
U.S. resident
population
age 13 or older
on July 1
Rate of
justifiable
homicides
(per million)
373
Year
1976
1977
1978
1979
415
311
313
442
Annual average
373
1980
1981
1982
1983
1984
457
381
376
406
332
1976
1977
1978
1979
415
311
313
442
172,563,000
175,420,000
178,188,000
180,793,000
2.40
1.77
1.76
2.44
1985
1986
1987
1988
1989
321
298
296
339
362
1980
1981
1982
1983
1984
457
381
376
406
332
183,258,000
185,255,000
187,588,000
189,782,000
191,992,000
2.49
2.06
2.00
2.14
1.73
1990
1991
1992
1993
1994
379
359
414
453
459
1985
1986
1987
1988
1989
321
298
296
339
362
194,085,000
195,905,000
197,545,000
199,252,000
200,911,000
1.65
1.52
1.50
1.70
1.80
1995
1996
1997
1998
382
355
361
367
1990
1991
1992
1993
1994
379
359
414
453
459
201,938,000
203,849,000
206,047,000
208,335,000
210,468,000
1.88
1.76
2.01
2.17
2.18
1995
1996
1997
1998
382
355
361
367
212,588,000
214,769,000
217,391,000
219,801,000
1.80
1.65
1.66
1.67
Note: Data shown in table do not
include justifiable homicides by police
for the following years and States: 1988,
Florida, Kentucky; 1989, Florida; 1990,
Florida; 1991, Florida; 1993, Kansas;
1994, Kansas; 1995, Illinois, Kansas;
1996, District of Columbia; Kansas
1997, Florida, Kansas; 1998, District of
Columbia, Florida, Kansas, Wisconsin.
Source: FBI database, Supplementary
Homicide Reports.
1.90
Note: Data shown in table do not include justifiable homicides
by police for the following years and States: 1988, Florida,
Kentucky; 1989, Florida; 1990, Florida; 1991, Florida; 1993,
Kansas; 1994, Kansas; 1995, Illinois, Kansas; 1996, District
of Columbia, Kansas; 1997, Florida, Kansas; 1998, District
of Columbia, Florida, Kansas, Wisconsin.
Populations include States that did not report
justifiable homicides.
Source: FBI database, Supplementary Homicide Reports.
Policing and Homicide, 1976-98 33
Data for figure 3. Gender of felons killed by police in justifiable homicides:
Rate per 10 million population age 13 or older, 1976-98
Year
Total number
of justifiable
homicides
U.S. resident population
age 13 or older on July 1
Total
Male
Female
Male felons
Rate per
Number Percent 10 million
Female felons
Rate per
Number Percent 10 million
364
97.7%
39
9
2.3%
1
89,680,000
91,186,000
92,661,000
94,036,000
410
305
307
430
98.8%
98.1
98.1
97.3
49
36
36
50
5
6
6
12
1.2%
1.9
1.9
2.7
1
1
1
1
87,928,000
88,894,000
90,015,000
91,105,000
92,167,000
95,330,000
96,361,000
97,573,000
98,677,000
99,825,000
447
378
369
402
325
97.8%
99.2
98.1
99.0
97.9
51
43
41
44
35
10
3
7
4
7
2.2%
0.8
1.9
1.0
2.1
1
0
1
0
1
93,302,000
94,235,000
95,053,000
95,902,000
96,730,000
100,783,000
101,670,000
102,492,000
103,350,000
104,181,000
314
294
290
333
347
97.8%
98.7
98.0
98.2
95.9
34
31
31
35
36
7
4
6
6
15
2.2%
1.3
2.0
1.8
4.1
1
0
1
1
1
379
359
414
453
459
201,938,000 97,325,000 104,613,000
203,849,000 98,222,000 105,627,000
206,047,000 99,358,000 106,689,000
208,335,000 100,499,000 107,836,000
210,468,000 101,549,000 108,919,000
366
344
405
439
440
96.6%
95.8
97.8
96.9
95.9
38
35
41
44
43
13
15
9
14
19
3.4%
4.2
2.2
3.1
4.1
1
1
1
1
2
382
355
361
367
212,588,000
214,759,000
217,391,000
219,801,000
377
347
349
358
98.7%
97.7
96.7
97.5
37
33
33
34
5
8
12
9
1.3%
2.3
3.3
2.5
0
1
1
1
Annual average
373
1976
1977
1978
1979
415
311
313
442
172,563,000
175,420,000
178,188,000
180,793,000
82,883,000
84,234,000
85,527,000
86,757,000
1980
1981
1982
1983
1984
457
381
376
406
332
183,258,000
185,255,000
187,588,000
189,782,000
191,992,000
1985
1986
1987
1988
1989
321
298
296
339
362
194,085,000
195,905,000
197,545,000
199,252,000
200,911,000
1990
1991
1992
1993
1994
1995
1996
1997
1998
102,630,000
103,722,000
104,995,000
106,210,000
109,958,000
111,037,000
112,396,000
113,591,000
Note: “Total number” includes all instances of justifiable homicide by police whether
or not the demographic characteristics are known. The felon’s gender is known in 99.9% of the
justifiable homicides by police between 1976 and 1998.
Populations include States that did not report justifiable homicides.
Due to rounding error, population detail may not sum to total.
Source: FBI database, Supplementary Homicide Reports.
34 Policing and Homicide, 1976-98
Data for figure 4. Race of felons killed by police
in justifiable homicides: Percent white, black,
and other, 1976-98
Year
Total number
of justifiable
homicides
Percent of killed felons
White
Black
Other
Annual average
373
56%
42%
2%
1976
1977
1978
1979
415
311
313
442
46%
47
50
50
52%
51
49
48
2%
2
1
2
1980
1981
1982
1983
1984
457
381
376
406
332
51%
54
52
54
58
48%
45
46
44
41
1%
1
2
2
1
1985
1986
1987
1988
1989
321
298
296
339
362
61%
58
64
59
60
35%
40
34
39
38
4%
2
2
2
2
1990
1991
1992
1993
1994
379
359
414
453
459
62%
54
60
55
57
36%
43
38
42
40
2%
3
2
3
3
1995
1996
1997
1998
382
355
361
367
59%
61
63
62
38%
37
35
35
3%
2
2
3
Note: “Total number” includes all instances of justifiable
homicide by police whether or not the demographic characteristics are known. The felon’s race is known in 99.3% of the
justifiable homicides by police between 1976 and 1998.
Source: FBI database, Supplementary Homicide Reports.
Policing and Homicide, 1976-98 35
Data for figure 5. Race of felons killed by police in justifiable homicides:
Rate per 1 million population age 13 or older, 1976-98
Year
Total number
of justifiable
homicides
Felon’s race
White Black Other
Total
U.S. resident population
age 13 or older on July 1
White
Black
Annual
average
373
208
155
7
1976
1977
1978
1979
415
311
313
442
193
148
156
221
215
158
155
213
7
5
2
8
172,563,000
175,420,000
178,188,000
180,793,000
151,219,000
153,451,000
155,582,000
157,553,000
18,494,000
18,937,000
19,381,000
19,791,000
1980
1981
1982
1983
1984
457
381
376
406
332
229
205
192
216
191
217
172
172
177
136
3
3
7
7
4
183,258,000
185,255,000
187,588,000
189,782,000
191,992,000
159,147,000
160,557,000
162,022,000
163,610,000
165,143,000
1985
1986
1987
1988
1989
321
298
296
339
362
195
170
188
196
217
113
119
100
132
136
12
5
5
6
6
194,085,000
195,905,000
197,545,000
199,252,000
200,911,000
1990
1991
1992
1993
1994
379
359
414
453
459
232
190
245
246
261
135
154
155
191
185
8
12
9
13
12
1995
1996
1997
1998
382
355
361
367
226
218
226
225
143
130
127
127
10
7
6
12
1.90
1.24
7.02
1.23
2,850,000
3,032,000
3,225,000
3,449,000
2.40
1.77
1.76
2.44
1.28
0.96
1.00
1.40
11.63
8.34
8.00
10.76
2.46
1.65
0.62
2.32
20,148,000
20,498,000
20,961,000
21,325,000
21,728,000
3,963,000
4,200,000
4,605,000
4,847,000
5,121,000
2.49
2.06
2.00
2.14
1.73
1.44
1.28
1.19
1.32
1.16
10.77
8.39
8.21
8.30
6.26
0.76
0.71
1.52
1.44
0.78
166,604,000
167,785,000
168,824,000
169,909,000
170,984,000
22,056,000
22,400,000
22,711,000
23,031,000
23,326,000
5,425,000
5,720,000
6,010,000
6,312,000
6,601,000
1.65
1.52
1.50
1.70
1.80
1.17
1.01
1.11
1.15
1.27
5.12
5.31
4.40
5.73
5.83
2.21
0.87
0.83
0.95
0.91
201,938,000
203,849,000
206,047,000
208,335,000
210,468,000
171,178,000
172,450,000
173,906,000
175,451,000
176,901,000
23,299,000
23,657,000
24,081,000
24,506,000
24,899,000
7,461,000
7,742,000
8,060,000
8,378,000
8,668,000
1.88
1.76
2.01
2.17
2.18
1.36
1.10
1.41
1.40
1.48
5.79
6.51
6.44
7.79
7.43
1.07
1.55
1.12
1.55
1.38
212,588,000
214,759,000
217,391,000
219,801,000
178,363,000
179,835,000
181,480,000
183,098,000
25,292,000 8,933,000
25,679,000 9,245,000
26,159,000 9,752,000
26,605,000 10,098,000
1.80
1.65
1.66
1.67
1.27
1.21
1.25
1.23
5.65
5.06
4.85
4.77
1.12
0.76
0.62
1.19
Note: “Total number” includes all instances of justifiable homicide by police whether
or not the demographic characteristics are known. The felon’s race is known
in 99.3% of the justifiable homicides by police between 1976 and 1998.
Populations include States that did not report justifiable homicides.
Source: FBI database, Supplementary Homicide Reports.
36 Policing and Homicide, 1976-98
Other
Rate of justifiable homicide
(per million age 13 or older)
Total White Black Other
Data for figure 6. Race of felons arrested for violent crime:
Rate per 100,000 population age 13 or older, 1976-98
Year
U.S. resident population
age 13 or older on July 1
White
Black
Annual average
Estimated number of
arrests for violent crime
White
Black
Rate (per 100,000) of
arrest for violent crime
White
Black
257,020
220,159
188
1,197
1976
1977
1978
1979
151,219,000
153,451,000
155,582,000
157,553,000
18,494,000
18,937,000
19,381,000
19,791,000
207,648
227,278
300,752
251,094
195,636
199,077
276,525
206,387
137
148
193
159
1,058
1,051
1,427
1,043
1980
1981
1982
1983
1984
159,147,000
160,557,000
162,022,000
163,610,000
165,143,000
20,148,000
20,498,000
20,961,000
21,325,000
21,728,000
258,574
259,795
273,035
255,579
262,591
209,707
224,142
245,971
236,967
225,171
162
162
169
156
159
1,041
1,093
1,173
1,111
1,036
1985
1986
1987
1988
1989
166,604,000
167,785,000
168,824,000
169,909,000
170,984,000
22,056,000
22,400,000
22,711,000
23,031,000
23,326,000
256,471
289,206
279,711
323,684
348,181
234,195
257,404
258,664
292,691
327,083
154
172
166
191
204
1,062
1,149
1,139
1,271
1,402
1990
1991
1992
1993
1994
171,178,000
172,450,000
173,906,000
175,451,000
176,901,000
23,299,000
23,657,000
24,081,000
24,506,000
24,899,000
284,759
385,494
397,809
396,288
415,725
274,860
321,805
332,674
344,841
348,301
166
224
229
226
235
1,180
1,360
1,381
1,407
1,399
1995
1996
1997
1998
178,363,000
179,835,000
181,480,000
183,098,000
25,292,000
25,679,000
26,159,000
26,605,000
432,623
398,612
407,926
390,044
347,664
315,070
295,092
271,823
243
222
225
213
1,375
1,227
1,128
1,022
Source: FBI, Uniform Crime Reports.
Policing and Homicide, 1976-98 37
Data for figure 7. Age of felons killed by police in justifiable homicides:
Rate per 1 million population that age, 1976-98
Total number
of justifiable
homicides
Total rate
of justifiable
homicides
Annual average
373
1.90
1.58
3.96*
3.84
3.07
2.24
1.70
1.19
0.77
0.61
0.29
1976
1977
1978
1979
415
311
313
442
2.40
1.77
1.76
2.44
2.04
1.24
1.53
1.96
5.10
3.74
3.76
5.02
5.50
3.58
2.91
4.87
3.67
2.49
2.40
3.77
2.69
2.44
2.60
2.80
1.61
2.23
2.21
1.48
1.12
1.57
0.79
2.23
0.75
0.34
0.85
0.77
0.92
0.71
0.53
0.86
0.43
0.27
0.32
0.40
1980
1981
1982
1983
1984
457
381
376
406
332
2.49
2.06
2.00
2.14
1.73
1.79
1.63
1.33
1.17
1.25
5.51
3.64
3.80
3.82
3.61
5.04
4.83
4.70
4.03
3.24
4.45
3.04
3.36
3.89
2.65
3.41
2.71
2.25
2.15
1.96
1.53
1.25
1.51
3.80
1.81
1.00
1.55
1.18
0.36
1.49
0.86
0.78
0.52
1.52
0.91
0.86
0.34
0.43
0.44
0.44
0.25
0.38
0.40
0.42
0.23
1985
1986
1987
1988
1989
321
298
296
339
362
1.65
1.52
1.50
1.70
1.80
0.85
1.10
0.80
1.29
1.39
3.24
2.45
3.28
2.76
3.58
3.68
2.86
2.46
3.79
3.69
2.37
2.84
2.16
2.94
3.03
1.98
1.60
2.13
1.99
1.89
1.21
1.05
1.61
1.74
1.66
1.03
0.75
1.05
1.07
1.33
0.73
0.92
0.73
0.72
1.32
0.71
0.44
0.99
0.73
0.75
0.43
0.27
0.22
0.17
0.12
1990
1991
1992
1993
1994
379
359
414
453
459
1.88
1.76
2.01
2.17
2.18
1.35
2.17
2.12
2.53
2.19
3.66
3.65
4.83
4.95
5.23
4.05
3.71
4.26
3.92
4.06
2.97
2.93
2.92
3.28
3.43
2.25
1.61
2.09
2.23
2.69
1.80
1.55
1.70
2.08
1.78
1.59
0.78
1.30
1.07
1.50
0.79
0.52
0.50
0.94
0.68
0.19
0.48
0.29
0.75
0.91
0.24
0.17
0.21
0.42
0.35
1995
1996
1997
1998
382
355
361
367
1.80
1.65
1.66
1.67
1.87
1.75
1.42
1.58
4.59
3.80
3.37
3.62
2.95
3.21
3.40
3.50
3.38
3.04
2.85
2.82
2.02
1.73
2.39
1.86
1.43
1.35
1.22
1.51
1.03
1.14
1.19
1.22
0.59
0.43
0.79
0.83
0.45
0.62
0.85
0.24
0.21
0.27
0.25
0.29
Year
Rate of justifiable homicide per 1 million
13-19 20-24 25-29 30-34 35-39 40-44 45-49 50-54
Note: “Total number” includes all instances of justifiable homicide by police whether
or not the demographic characteristics are known. The felon’s age is known in 98.7% of the
justifiable homicides by police between 1976 and 1998. The 13-19 age category
includes one 11-year-old in 1981 and one 12-year-old in 1992.
Populations include States that did not report justifiable homicides.
*Population denominators for rates are available in Appendix table 1.
Source: FBI database, Supplementary Homicide Reports.
38 Policing and Homicide, 1976-98
55-59 60 or older
Data for figure 8. Felons killed by police in justifiable homicide:
Percent under and over age 25, by race and gender, 1976-98
Year
Total number
of justifiable
homicides
Percent of killed felons under age 25*
Male
Female
Other
Other
White Black race
White Black race
Percent of killed felons age 25 or older
Male
Female
Other
Other
White Black race
White Black race
Annual average
373
16%
16%
1%
0%
0%
0%
39%
25%
1%
1%
1%
0%
1976
1977
1978
1979
415
311
313
442
19%
16
19
18
20%
19
20
18
0%
0
0
1
0%
0
0
0
0%
1
0
0
0%
0
0
0
27%
32
30
32
32%
30
29
28
1%
1
0
1
1%
0
1
1
0%
1
1
1
0%
0
0
0
1980
1981
1982
1983
1984
457
381
376
406
332
20%
16
17
12
19
17%
17
14
15
14
0%
0
1
1
0
0%
0
0
0
0
0%
0
0
0
0
0%
0
0
0
0
31%
38
33
41
38
30%
27
32
29
27
0%
1
1
1
1
1%
0
1
0
1
1%
1
1
1
0
0%
0
0
0
0
1985
1986
1987
1988
1989
321
298
296
339
362
15%
17
17
11
15
13%
13
11
12
12
1%
1
0
1
1
0%
0
0
1
1
0%
0
0
0
0
0%
0
0
0
0
45%
40
47
46
43
22%
27
22
27
23
1%
1
1
1
1
2%
1
1
1
2
1%
0
1
0
2
0%
0
0
0
0
1990
1991
1992
1993
1994
379
359
414
453
459
14%
16
17
13
16
13%
15
17
20
15
1%
2
1
1
1
0%
0
1
0
1
0%
1
0
0
0
0%
0
0
0
0
47%
35
41
42
38
21%
26
21
21
24
1%
1
1
1
2
1%
2
1
1
2
2%
1
0
1
1
0%
1
0
0
0
1995
1996
1997
1998
382
355
361
367
17%
15
12
15
17%
16
14
14
1%
1
1
1
0%
0
0
0
0%
0
0
0
0%
0
0
0
42%
46
49
45
20%
20
20
21
2%
1
1
2
1%
1
2
1
0%
0
1
1
0%
0
0
0
Note: “Total number” includes all instances of justifiable homicide by police whether
or not the demographic characteristics are known. The felon’s age, gender, and race are all known
in 98.1% of the justifiable homicides by police between 1976 and 1998.
*Felons under age 25 refers only to persons ages 13-24.
Source: FBI database, Supplementary Homicide Reports.
Policing and Homicide, 1976-98 39
Data for figure 9. Race, gender, and age of felons killed by police in justifiable homicides:
Rate per 1 million U.S. population under age 25 and 25 or older, 1980-98
Rate of killed felons under age 25*
Male
Female
Other
Other
White Black race
White Black race
Rate of killed felons age 25 or older
Male
Female
Other
Other
White Black race
White Black race
Year
Total
rate
Annual average
1.86
2.93 16.50
3.01
0.06
0.11
0.11
2.36 12.29
1.96
0.06
0.33
0.03
1980
1981
1982
1983
1984
2.49
2.06
2.00
2.14
1.73
4.10
2.78
2.91
2.27
2.97
22.84
18.49
15.60
18.02
13.58
1.66
0.00
4.27
4.05
1.28
0.10
0.00
0.00
0.00
0.05
0.00
0.00
0.00
0.00
0.00
0.00
0.00
0.00
0.00
0.00
2.45
2.56
2.15
2.80
2.11
22.09
16.85
18.63
17.67
13.26
1.50
2.21
2.71
2.51
1.76
0.06
0.00
0.06
0.02
0.06
0.54
0.40
0.39
0.38
0.12
0.00
0.00
0.00
0.00
0.00
1985
1986
1987
1988
1989
1.65
1.52
1.50
1.70
1.80
2.28
2.43
2.54
1.96
2.86
12.44
11.04
9.97
12.21
13.58
2.42
2.29
1.10
2.11
2.02
0.00
0.05
0.05
0.17
0.11
0.00
0.00
0.30
0.00
0.00
0.00
0.00
0.00
0.00
0.00
2.32
1.89
2.13
2.42
2.42
10.10
11.44
8.90
12.28
11.34
5.47
1.54
1.92
1.35
1.70
0.07
0.03
0.03
0.03
0.08
0.24
0.12
0.23
0.11
0.77
0.00
0.00
0.00
0.00
0.00
1990
1991
1992
1993
1994
1.88
1.76
2.01
2.17
2.18
2.88
3.19
3.76
3.19
4.03
15.39
16.98
21.16
26.72
21.26
1.97
5.78
4.69
5.48
4.47
0.00
0.06
0.18
0.06
0.18
0.00
0.63
0.00
0.31
0.30
1.05
0.00
0.00
0.95
0.00
2.67
1.87
2.53
2.71
2.56
10.11
11.95
10.56
11.46
13.31
1.92
1.47
1.40
2.01
2.26
0.07
0.10
0.07
0.08
0.15
0.75
0.32
0.10
0.51
0.40
0.00
0.66
0.00
0.00
0.00
1995
1996
1997
1998
1.80
1.65
1.66
1.67
3.35
2.79
2.49
2.89
19.54
16.42
14.20
14.00
2.63
4.32
3.39
3.32
0.06
0.06
0.00
0.00
0.00
0.30
0.00
0.29
0.00
0.00
0.00
0.00
2.27
2.30
2.45
2.25
9.02
8.26
8.21
8.05
2.18
0.60
0.58
2.22
0.04
0.07
0.09
0.07
0.10
0.10
0.38
0.28
0.00
0.00
0.00
0.00
Note: “Total rate” column includes all instances of justifiable homicide by police whether or not the
demographic characteristics are known. The felon’s race, gender, and age are all known in 98.1%
of the justifiable homicides by police between 1980 and 1998.
Populations include States that did not report justifiable homicides.
*Felons under age 25 refers only to persons ages 13-24.
Population denominators are available in Appendix table 2.
Source: FBI database, Supplementary Homicide Reports.
40 Policing and Homicide, 1976-98
Data for figure 10. Race of police officers who killed
felons in justifiable homicides: Percent white,
black, and other, 1976-98
Year
Total number
of justifiable
homicides
by police
Percent of officers
White
Black
Other
Annual average
373
84%
15%
1%
1976
1977
1978
1979
415
311
313
442
82%
83
85
83
16%
17
15
16
2%
0
0
1
1980
1981
1982
1983
1984
457
381
376
406
332
86%
87
86
90
86
14%
13
14
9
12
0%
0
0
1
2
1985
1986
1987
1988
1989
321
298
296
339
362
85%
90
86
86
87
13%
10
12
13
13
2%
0
2
1
0
1990
1991
1992
1993
1994
379
359
414
453
459
83%
81
82
82
77
16%
18
16
17
22
1%
1
2
1
1
1995
1996
1997
1998
382
355
361
367
84%
87
81
82
15%
12
17
17
1%
1
2
1
Note: “Total number” includes all instances of justifiable
homicide by police whether or not the demographic characteristics are known. The officer’s race is known in 77.2% of the
justifiable homicides by police between 1976 and 1998.
Source: FBI database, Supplementary Homicide Reports.
Policing and Homicide, 1976-98 41
Data for figure 11. Race of felons and police officers in justifiable homicides:
Number and percent interracial and intraracial, 1976-98
Year
Total number
of justifiable
homicides
by police
Officer is white, felon is —
White
Black
Officer is black, felon is —
White
Black
Annual average
373
53%
30%
3%
12%
1976
1977
1978
1979
415
311
313
442
41%
43
46
46
41%
38
38
35
2%
3
2
3
14%
15
14
13
1980
1981
1982
1983
1984
457
381
376
406
332
50%
51
46
52
53
35%
34
39
36
32
1%
2
1
1
3
13%
12
13
8
9
1985
1986
1987
1988
1989
321
298
296
339
362
58%
56
60
57
60
25%
31
25
27
25
5%
2
5
3
2
8%
8
7
10
11
1990
1991
1992
1993
1994
379
359
414
453
459
56%
55
56
53
54
24%
23
24
26
22
5%
2
4
3
2
12%
16
12
14
20
1995
1996
1997
1998
382
355
361
367
57%
57
58
56
26%
28
22
24
2%
3
4
5
12%
8
13
12
Note: “Total number” includes all instances of justifiable homicide by police whether or not
the demographic characteristics are known. The officer’s race is known in 76.9% of the
justifiable homicides by police between 1976 and 1998. The felon’s race is known in 99.3%
of the justifiable homicides by police between 1976 and 1998.
Detail does not sum to 100% because table does not show all racial combinations.
Source: FBI database, Supplementary Homicide Reports.
42 Policing and Homicide, 1976-98
Data for figure 12. Number of
police officers murdered by
felons, 1976-98
Year
Annual average
Data for figure 13. Number of police
officers murdered by felons compared
to felons killed by police in justifiable
homicides, 1976-98
Total number of
officers murdered
79
Year
Annual average
1976
1977
1978
1979
111
93
93
106
1980
1981
1982
1983
1984
104
91
92
80
72
1985
1986
1987
1988
1989
78
66
74
78
66
1990
1991
1992
1993
1994
66
71
64
70
79
1995
1996
1997
1998
74
61
70
61
Source: FBI, Law Enforcement
Officers Killed and Assaulted.
Officers
murdered
Felons
killed
79
373
1976
1977
1978
1979
111
93
93
106
415
311
313
442
1980
1981
1982
1983
1984
104
91
92
80
72
457
381
376
406
332
1985
1986
1987
1988
1989
78
66
74
78
66
321
298
296
339
362
1990
1991
1992
1993
1994
66
71
64
70
79
379
359
414
453
459
1995
1996
1997
1998
74
61
70
61
382
355
361
367
Source: FBI, Law Enforcement Officers
Killed and Assaulted, and FBI database,
Supplementary Homicide Reports.
Policing and Homicide, 1976-98 43
Data for figure 14. Police officers murdered
by felons: Rate per 100,000 officers, 1976-98
Year
Annual average
Total number of
Total number
officers murdered of sworn police
79
Data for figure 15. Race of police officers
murdered by felons: Percent white, black,
and other, 1976-98
Rate per
100,000
Approximately
1 of every —
17.1
6,503
1976
1977
1978
1979
111
93
93
106
391,895
384,816
391,751
373,605
28.3
24.2
23.7
28.4
3,531
4,138
4,212
3,525
1980
1981
1982
1983
1984
104
91
92
80
72
393,363
398,064
403,407
449,370
467,117
26.4
22.9
22.8
17.8
15.4
3,782
4,374
4,385
5,617
6,488
1985
1986
1987
1988
1989
78
66
74
78
66
470,678
475,853
480,383
485,566
496,353
16.6
13.9
15.2
16.1
13.3
6,034
7,210
6,492
6,225
7,521
1990
1991
1992
1993
1994
66
71
64
70
79
523,262
535,629
544,309
553,773
561,543
12.6
13.3
11.4
12.6
13.5
7,928
7,544
8,505
7,911
7,108
1995
1996
1997
1998
74
61
70
61
586,756
595,170
618,127
641,208
12.6
10.2
11.3
9.5
7,929
9,757
8,830
10,512
Source: FBI, Law Enforcement Officers Killed and Assaulted.
Year
Percent of murdered officers
White
Black
Other
Annual average
86%
13%
1%
1976
1977
1978
1979
90%
90
91
88
8%
10
9
9
2%
0
0
3
1980
1981
1982
1983
1984
87%
85
84
83
85
13%
14
15
13
14
0%
1
1
4
1
1985
1986
1987
1988
1989
89%
89
90
91
89
10%
11
10
9
11
1%
0
0
0
0
1990
1991
1992
1993
1994
80%
87
82
86
84
18%
13
16
14
15
2%
0
2
0
1
1995
1996
1997
1998
84%
80
80
87
12%
15
17
11
4%
5
3
2
Source: FBI, Law Enforcement Officers
Killed and Assaulted.
44 Policing and Homicide, 1976-98
Data for figure 16. Felons who murdered police officers:
Percent with criminal history, 1976-98
Year
Any narcotic
Any criminal drug law
act
violation
Prior arrest for —
Any
violent
Murder
crime
charge
Weapons
violation
Assaulting
police or
resisting arrest
Prior
conviction
On parole or
probation at time
of killing
Annual average
67%
24%
32%
4%
28%
11%
48%
21%
1976
1977
1978
1979
60%
61
62
63
18%
15
9
13
25%
31
24
43
5%
3
5
8
16%
16
21
30
4%
3
9
6
44%
46
50
49
23%
4
23
16
1980
1981
1982
1983
1984
73%
73
73
72
83
26%
26
22
14
20
48%
47
29
11
24
6%
7
6
3
6
36%
46
36
22
24
9%
14
11
9
8
49%
54
50
40
70
25%
26
25
24
25
1985
1986
1987
1988
1989
75%
69
54
67
67
22%
27
24
20
17
19%
23
26
29
35
2%
5
1
4
7
22%
20
20
15
30
9%
5
5
5
14
51%
30
49
36
49
23%
22
22
24
12
1990
1991
1992
1993
1994
78%
60
59
66
58
33%
30
20
31
25
46%
28
38
24
43
6%
1
4
4
4
49%
18
32
33
39
14%
8
8
18
24
68%
46
46
37
39
31%
23
15
14
17
1995
1996
1997
1998
69%
58
76
71
38%
24
44
33
48%
38
32
24
1%
1
1
7
31%
34
37
21
22%
15
18
9
42%
51
72
44
18%
24
24
12
Source: FBI, Law Enforcement Officers Killed and Assaulted.
Policing and Homicide, 1976-98 45
Data for figure 17. Felons who murdered police officers:
Percent under and over age 25, by race and gender, 1980-98
Year
Percent under age 25*
Male
Female
Other
Other
White Black race
White Black race
White
Percent age 25 or older
Male
Female
Other
Other
Black race
White Black race
Annual average
20%
21%
1%
1%
1%
0%
31%
19%
2%
1%
1%
0%
1980
1981
1982
1983
1984
26%
12
21
22
20
19%
20
25
13
19
0%
1
0
1
3
3%
0
0
0
2
2%
1
1
0
0
0%
0
0
0
0
26%
25
35
42
29
22%
38
14
17
22
0%
1
1
4
3
1%
2
3
0
1
1%
0
0
1
0
0%
0
0
0
0
1985
1986
1987
1988
1989
18%
26
20
29
7
22%
10
13
19
21
3%
0
4
2
0
1%
0
4
0
1
1%
1
0
1
1
0%
0
0
0
0
25%
35
37
25
46
29%
24
17
21
21
0%
2
1
1
1
1%
1
2
1
0
0%
1
1
1
0
0%
0
0
0
1
1990
1991
1992
1993
1994
18%
21
25
21
25
18%
37
23
39
23
0%
0
1
0
0
1%
0
0
0
2
1%
0
0
0
1
0%
0
0
0
0
35%
35
27
20
26
24%
6
23
19
18
1%
1
0
0
3
0%
0
0
1
1
2%
0
1
0
1
0%
0
0
0
0
1995
1996
1997
1998
20%
14
10
26
27%
30
15
17
1%
5
7
3
3%
0
0
1
1%
0
0
0
0%
0
0
0
28%
28
42
33
11%
20
15
16
3%
1
7
3
3%
1
0
1
0%
0
0
0
0%
0
0
0
Note: Data on the race, gender, and age of felons who murder police officers are not available prior to 1980.
The felon’s race, gender, and age are all known for 94.4% of felons who murdered police between 1980 and 1998.
*Felons under age 25 refers only to persons ages 13-24.
Source: FBI, Law Enforcement Officers Killed and Assaulted.
46 Policing and Homicide, 1976-98
Data for figure 18. Race and gender of felons who murdered police officers:
Rate per 1 million U.S. population, 1980-98
Year
Rate per 1 million under age 25*
Male
Female
Other
Other
White Black race
White Black race
Rate per 1 million age 25 or older
Male
Female
Other
Other
White Black race
White Black race
Annual average
1.12
6.30
1.53
0.06
0.19
0.00
0.48
2.84
0.68
0.02
0.06
0.02
1980
1981
1982
1983
1984
2.03
0.75
1.19
1.11
0.93
9.19
7.63
8.83
4.14
5.31
0.00
1.52
0.00
1.35
3.83
0.24
0.00
0.00
0.00
0.10
0.86
0.28
0.29
0.00
0.00
0.00
0.00
0.00
0.00
0.00
0.78
0.57
0.72
0.76
0.46
6.19
8.09
2.57
2.81
3.05
0.00
0.74
0.68
2.51
1.76
0.02
0.05
0.06
0.00
0.02
0.27
0.00
0.00
0.13
0.00
0.00
0.00
0.00
0.00
0.00
1985
1986
1987
1988
1989
0.99
1.17
0.93
1.91
0.32
7.11
2.69
3.63
7.33
5.25
3.62
0.00
4.40
3.16
0.00
0.05
0.00
0.22
0.00
0.06
0.29
0.29
0.00
0.30
0.31
0.00
0.00
0.00
0.00
0.00
0.45
0.51
0.55
0.49
0.59
4.75
3.04
2.26
3.59
2.29
0.00
1.02
0.48
0.45
0.42
0.01
0.01
0.03
0.01
0.00
0.00
0.12
0.12
0.11
0.00
0.00
0.00
0.00
0.00
0.38
1990
1991
1992
1993
1994
0.83 4.71
1.12 11.01
1.18 5.91
0.95 9.52
1.51 7.29
0.00
0.00
0.94
0.00
0.00
0.06
0.00
0.00
0.00
0.12
0.31
0.00
0.00
0.00
0.30
0.00
0.00
0.00
0.00
0.00
0.45
0.50
0.35
0.24
0.41
2.63
0.77
2.39
1.85
2.30
0.38
0.37
0.00
0.00
0.97
0.00
0.00
0.00
0.01
0.01
0.21
0.00
0.10
0.00
0.10
0.00
0.00
0.00
0.00
0.00
1995
1996
1997
1998
1.01
0.56
1.66
1.20
0.88
3.45
4.24
1.66
0.18
0.00
0.00
0.06
0.30
0.00
0.00
0.00
0.00
0.00
0.00
0.00
0.36
0.30
0.43
0.31
1.19
1.74
1.25
1.23
0.93
0.30
1.44
0.56
0.04
0.01
0.00
0.01
0.00
0.00
0.00
0.00
0.00
0.00
0.00
0.00
7.21
6.57
3.25
3.21
Note: Data on the race, gender, and age of felons who murder police officers are not available prior to 1980.
The felon’s race, gender, and age are all known for 94.4% of felons who murdered police between 1980 and 1998.
*Felons under age 25 refers only to persons ages 13-24.
Population denominators are available in Appendix table 2.
Source: FBI, Law Enforcement Officers Killed and Assaulted.
Policing and Homicide, 1976-98 47
Data for table 3. Age of felons killed by police in justifiable homicides, 1976-98
Year
Total number
of justifiable
homicides
13-19
20-24
Percent of killed felons who were ages —
25-29 30-34 35-39 40-44 45-49 50-54
55-59
60 or older
Annual average
373
11%
21%
21%
17%
11%
7%
4%
3%
2%
3%
1976
1977
1978
1979
415
311
313
442
15%
12
14
13
25%
23
25
25
25%
21
17
21
13%
13
13
15
8%
10
11
9
4%
8
8
4
3%
6
3
6
2%
1
3
2
2%
3
2
2
3%
3
4
3
1980
1981
1982
1983
1984
457
381
376
406
332
11%
12
10
8
10
27%
21
22
20
22
22%
26
26
21
21
17%
15
17
19
16
11%
10
9
9
10
4%
4
5
13
8
2%
5
4
1
5
2%
2
2
4
3
2%
1
1
1
2
2%
4
4
4
3
1985
1986
1987
1988
1989
321
298
296
339
362
7%
10
7
10
9
22%
18
21
16
19
25%
22
19
26
23
15%
21
16
19
19
11%
11
14
11
10
5%
5
9
8
8
4%
3
4
4
5
3%
4
3
2
4
3%
2
4
2
2
5%
4
3
2
1
1990
1991
1992
1993
1994
379
359
414
453
459
9%
15
13
14
12
19%
20
22
20
21
22%
22
21
17
17
17%
18
16
16
17
12%
9
11
11
13
9%
8
8
9
8
6%
3
5
4
5
2%
2
1
3
2
1%
1
1
2
2
3%
2
2
4
3
1995
1996
1997
1998
382
355
361
367
13%
13
11
12
22%
19
17
18
15%
17
18
18
20%
19
17
16
12%
11
15
12
8%
8
7
9
5%
6
6
6
2%
2
3
4
1%
2
3
1
2%
3
3
4
Note: “Total number” includes all instances of justifiable homicide by police whether
or not the demographic characteristics are known. The felon’s age is known in 98.7%
of the justifiable homicides by police between 1976 and 1998.
The 13-19 age category includes one 11-year-old in 1981 and one 12-year-old in 1992.
Source: FBI database, Supplementary Homicide Reports.
48 Policing and Homicide, 1976-98
Data for table 6. Age of police officers who killed felons in justifiable homicides, 1976-98
Year
Total number
of justifiable
homicides
by police
Under 20 20-24
Percent of officers who were ages —
25-29 30-34 35-39 40-44 45-49 50-54
55-59
60-64
65-69
70 or older
Annual average
373
1%
9%
28%
28%
17%
10%
4%
2%
0%
0%
0%
0%
1976
1977
1978
1979
415
311
313
442
0%
0
1
0
10%
11
13
9
37%
39
35
30
30%
28
32
29
10%
10
12
16
5%
4
5
9
4%
3
1
4
2%
3
1
2
0%
1
0
0
1%
1
0
1
1%
0
0
0
0%
0
0
0
1980
1981
1982
1983
1984
457
381
376
406
332
0%
0
0
0
0
9%
13
7
11
10
31%
26
30
24
22
34%
31
32
28
31
17%
18
19
19
23
5%
8
6
12
10
2%
2
4
3
3
1%
1
1
2
1
1%
1
1
1
0
0%
0
0
0
0
0%
0
0
0
0
0%
0
0
0
0
1985
1986
1987
1988
1989
321
298
296
339
362
0%
0
1
0
0
7%
7
8
4
10
24%
28
29
25
27
31%
28
23
35
24
24%
21
22
18
22
8%
13
13
13
9
5%
2
4
3
6
1%
1
0
2
1
0%
0
0
0
1
0%
0
0
0
0
0%
0
0
0
0
0%
0
0
0
0
1990
1991
1992
1993
1994
379
359
414
453
459
1%
0
0
1
2
7%
12
12
8
8
26%
29
25
33
25
23%
25
25
24
28
21%
17
16
12
18
15%
11
11
12
12
5%
4
8
4
5
2%
1
2
4
2
0%
1
1
0
0
0%
0
0
1
0
0%
0
0
1
0
0%
0
0
0
0
1995
1996
1997
1998
382
355
361
367
4%
0
2
2
8%
5
6
7
28%
31
28
27
26%
23
27
27
14%
15
20
22
12%
14
10
8
5%
9
4
4
2%
2
3
2
0%
1
1
1
1%
0
0
0
0%
0
0
0
0%
0
0
0
Note: “Total number” includes all instances of justifiable homicide by police whether
or not the demographic characteristics are known. The officer’s age is known in 70.1%
of the justifiable homicides by police between 1976 and 1998.
Due to rounding error, detail may not sum to 100%.
Source: FBI database, Supplementary Homicide Reports.
Policing and Homicide, 1976-98 49
Appendix table 1. Population denominators for rates in figure 7.
Year
13-19
20-24
U.S. resident population on July 1 (in thousands)
25-29
30-34
35-39
40-44
45-49
50-54
55-59
60 or older
1976
1977
1978
1979
29,853
29,735
29,483
29,024
19,794
20,312
20,748
21,097
18,177
18,180
18,586
19,077
14,428
15,661
16,218
16,961
11,884
12,309
13,052
13,592
11,147
11,190
11,321
11,523
11,646
11,495
11,352
11,212
11,969
11,868
11,814
11,724
10,884
11,192
11,425
11,582
32,781
33,478
34,189
35,001
1980
1981
1982
1983
1984
28,438
27,550
27,085
26,562
26,336
21,402
21,733
21,560
21,713
21,310
19,657
20,067
20,649
21,100
21,309
17,756
18,737
18,754
19,045
19,602
14,082
14,406
15,567
16,255
16,813
11,734
12,043
12,558
13,168
13,837
11,042
10,985
10,992
11,184
11,417
11,686
11,546
11,447
11,152
11,013
11,619
11,600
11,519
11,474
11,448
35,842
36,588
37,457
38,129
38,907
1985
1986
1987
1988
1989
25,851
25,422
25,006
24,769
24,399
20,996
20,415
19,790
19,186
18,702
21,754
22,010
21,979
21,876
21,699
20,267
20,774
21,334
21,798
22,135
17,708
18,723
18,737
19,141
19,621
14,055
14,345
15,569
16,124
16,881
11,648
11,927
12,351
13,026
13,521
10,942
10,887
10,927
11,136
11,375
11,337
11,268
11,125
10,897
10,726
39,527
40,134
40,727
41,299
41,852
1990
1991
1992
1993
1994
24,385
24,003
24,071
24,547
25,088
19,136
19,175
19,067
18,785
18,351
21,234
20,737
20,191
19,646
19,206
21,906
22,152
22,242
22,240
22,164
19,975
20,514
21,073
21,571
21,938
17,789
18,756
18,796
19,190
19,687
13,819
14,095
15,355
15,927
16,674
11,368
11,648
12,054
12,727
13,191
10,474
10,422
10,485
10,680
10,933
41,852
42,347
42,713
43,022
43,236
1995
1996
1997
1998
25,626
26,231
26,723
27,172
17,882
17,369
17,483
17,674
19,005
19,030
18,812
18,588
21,867
21,363
20,732
20,186
22,248
22,501
22,629
22,626
20,219
20,756
21,376
21,894
17,449
18,416
18,465
18,859
13,629
13,909
15,157
15,725
11,085
11,352
11,755
12,407
43,578
43,832
44,259
44,670
Note: Populations include States that did not report justifiable homicides.
Population estimates are rounded and are from the U.S. Census Bureau.
50 Policing and Homicide, 1976-98
Appendix table 2. Population denominators for rates in figures 9 and 18.
U.S. resident population under age 25
on July 1 (in thousands)*
Male
Female
Other
Black
race
White
Black
Other
race
White
U.S. resident population age 25 or older
on July 1 (in thousands)
Male
Female
Other
Other
Black
race
White
Black
race
Year
White
1980
1981
1982
1983
1984
21,214
21,243
20,972
20,729
20,506
3,372
3,408
3,397
3,385
3,387
602
657
703
741
784
20,594
20,598
20,320
20,038
19,776
3,494
3,523
3,505
3,481
3,467
582
629
668
700
736
55,418
56,164
57,240
58,257
59,266
5,975
6,055
6,227
6,395
6,560
1,337
1,355
1,474
1,593
1,706
61,810
62,642
63,758
64,801
65,820
7,367
7,467
7,675
7,880
8,077
1,493
1,513
1,648
1,782
1,908
1985
1986
1987
1988
1989
20,163
19,724
19,260
18,897
18,543
3,375
3,351
3,310
3,275
3,239
828
872
910
948
991
19,407
18,933
18,440
18,036
17,641
3,443
3,404
3,354
3,312
3,268
775
815
851
886
927
60,320
61,355
62,357
63,288
64,175
6,735
6,907
7,079
7,245
7,408
1,828
1,954
2,085
2,218
2,358
66,882
67,916
68,882
69,792
70,663
8,287
8,494
8,693
8,889
9,084
2,041
2,181
2,324
2,466
2,616
1990
1991
1992
1993
1994
18,052
17,862
17,809
17,853
17,867
3,184
3,179
3,213
3,254
3,290
1,017
1,037
1,065
1,094
1,118
17,120
16,954
16,874
16,921
16,935
3,200
3,194
3,212
3,247
3,279
953
981
1,016
1,054
1,084
64,824
65,642
66,457
67,188
67,905
7,612
7,783
7,954
8,112
8,261
2,610
2,727
2,853
2,977
3,091
71,163
71,946
72,705
73,410
74,095
9,317
9,518
9,709
9,895
10,071
2,886
3,026
3,178
3,330
3,473
1995
1996
1997
1998
17,881
17,900
18,061
18,317
3,322
3,344
3,380
3,430
1,137
1,156
1,180
1,205
16,929
16,931
17,072
17,309
3,304
3,318
3,349
3,393
1,110
1,135
1,165
1,193
68,630
69,361
70,135
70,723
8,417
8,586
8,772
8,939
3,210
3,336
3,467
3,596
74,774
75,470
76,213
76,750
10,252
10,447
10,658
10,843
3,621
3,774
3,940
4,104
Note: Populations include States that did not report justifiable homicides.
Population estimates are rounded and are from the U.S. Census Bureau.
*Felons under age 25 refers only to persons ages 13-24.
Policing and Homicide, 1976-98 51