
Illinois Sentencing Policy Advisory Council - The High Cost of Recidivism, 2018
Download original document:
Document text
Document text
This text is machine-read, and may contain errors. Check the original document to verify accuracy.
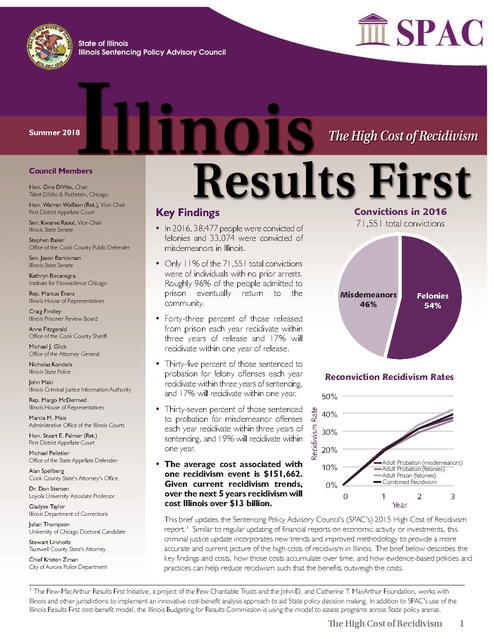
Summer 2018 Council Members Hon. Warren Wolfson (Ret.), Vice-Chair First District Appellate Court Sen. Kwame Raoul, Vice-Chair Illinois State Senate Stephen Baker Office of the Cook County Public Defender Sen. Jason Barickman Illinois State Senate Kathryn Bocanegra Institute for Nonviolence Chicago Rep. Marcus Evans Illinois House of Representatives Craig Findley Illinois Prisoner Review Board Anne Fitzgerald Office of the Cook County Sheriff Michael J. Glick Office of the Attorney General Nicholas Kondelis Illinois State Police John Maki Illinois Criminal Justice Information Authority Rep. Margo McDermed Illinois House of Representatives Marcia M. Meis Administrative Office of the Illinois Courts Hon. Stuart E. Palmer (Ret.) First District Appellate Court Michael Pelletier Office of the State Appellate Defender Alan Spellberg Cook County State’s Attorney’s Office Dr. Don Stemen Loyola University Associate Professor Gladyse Taylor Illinois Department of Corrections Julian Thompson University of Chicago Doctoral Candidate Stewart Umholtz Tazewell County State’s Attorney Chief Kristen Ziman City of Aurora Police Department Key Findings Convictions in 2016 71,551 total convictions • In 2016, 38,477 people were convicted of felonies and 33,074 were convicted of misdemeanors in Illinois. • Only 11% of the 71,551 total convictions were of individuals with no prior arrests. Roughly 96% of the people admitted to prison eventually return to the community. Misdemeanors 46% • Forty-three percent of those released from prison each year recidivate within three years of release and 17% will recidivate within one year of release. • Thirty-five percent of those sentenced to probation for felony offenses each year recidivate within three years of sentencing, and 17% will recidivate within one year. • Thirty-seven percent of those sentenced to probation for misdemeanor offenses each year recidivate within three years of sentencing, and 19% will recidivate within one year. • The average cost associated with one recidivism event is $151,662. Given current recidivism trends, over the next 5 years recidivism will cost Illinois over $13 billion. Felonies 54% Reconviction Recidivism Rates 50% Recidivism Rate Hon. Gino DiVito, Chair Tabet DiVito & Rothstein, Chicago 40% 30% 20% Adult Probation (misdemeanors) Adult Probation (felonies) Adult Prison (felonies) Combined Recidivism 10% 0% 0 1 Year 2 3 This brief updates the Sentencing Policy Advisory Council’s (SPAC’s) 2015 High Cost of Recidivism report.1 Similar to regular updating of financial reports on economic activity or investments, this criminal justice update incorporates new trends and improved methodology to provide a more accurate and current picture of the high costs of recidivism in Illinois. The brief below describes the key findings and costs, how those costs accumulate over time, and how evidence-based policies and practices can help reduce recidivism such that the benefits outweigh the costs. The Pew-MacArthur Results First Initiative, a project of the Pew Charitable Trusts and the John D. and Catherine T. MacArthur Foundation, works with Illinois and other jurisdictions to implement an innovative cost-benefit analysis approach to aid State policy decision making. In addition to SPAC’s use of the Illinois Results First cost-benefit model, the Illinois Budgeting for Results Commission is using the model to assess programs across State policy arenas. 1 e High Cost of Recidivism 1 Total Cost of a Recidivism Event: $151,662 Taxpaper Costs Victimization Costs $50,835 • Almost half, or $75,408, of the cost of recidivism is attributed to the tangible and intangible costs borne by victims. • Taxpayers of Illinois—pay one third, or $50,835, of the cost of recidivism. These costs include the resources required for law enforcement, court costs, and the costs of imposing sentences of community supervision or incarceration in county jails or state prisons. • The costs of recidivism are higher than previously estimated in 2015, largely because criminal justice costs have increased and also due to methodological improvements that capture more accurately the true costs of crime. $75,408 Indirect Costs $25,420 conducts cost-benefit analysis to calculate the benefits of evidence-based programs within State prisons.2 • Prior SPAC reports show benefits of alternatives to incarceration. This report discusses the key ingredients for achieving recidivism-reducing benefits: 1. Implementation is with fidelity; 2. Quality assurance is ongoing; 3. Data are collected and analyzed; and 4. Funding is prioritized to maximize benefits.3 • Recidivism rates, which are driven by arrests, are lower than previously estimated in 2015. • Cost-benefit analysis can be used to evaluate the effectiveness and value of different evidence-based programs that have been shown to reduce recidivism. The results may be prioritized so that decision makers can make apples-to-apples comparisons between program options. • The Illinois Budgeting for Results Commission Illinois Budgeting for Results Commission. (2017). 7th Annual Commission Report. Available at: https://www2.illinois.gov/sites/budget/Documents/Budgeting%20for%20Results/2017%20BFR%20Annual%20Commission%20Report.pdf. See page 6. For more information about BFR, see https://www2.illinois.gov/sites/budget/pages/results.aspx. 3 SPAC. (2015). Illinois Results First: Cost-Benefit Tool for Illinois Criminal Justice Policymakers. Available at: http://www.icjia.state.il.us/spac/pdf/Illinois_Results_First_Consumer_Reports_072016.pdf. 2 2 e High Cost of Recidivism Illinois Results First: The High Cost of Recidivism COST OF ONE RECIDIVISM EVENT: $151,662 COST OF RECIDIVISM OVER THE NEXT FIVE YEARS: $13 BILLION Recidivism over the next five years is projected to cost Illinois residents almost $13 billion if current trends continue. This estimate is based on the current recidivism patterns of the 59,000 individuals who are expected to be released from prison or sentenced to probation each year over this period. Every time an offender reoffends and is convicted for a new crime, the criminal justice system spends money for arresting and processing; for the prosecution, defense, and trial of cases; and for incarceration and supervision. Social costs, such as lost property, medical bills, wage loss, and the pain and suffering experienced by crime victims, account for more than $75,000 of this cost. Over five years, each individual who commits new crimes will produce victimization, system, and economic costs that average $151,662 per recidivism conviction. Assuming recidivism rates remain at current levels, five years’ worth of recidivism causes $13 billion in total costs.4 The Sentencing Policy Advisory Council (SPAC) is a statutorily created, independent commission of criminal justice stakeholders that reports to all three branches of government. SPAC does not make recommendations, oppose, or support specific policy proposals. SPAC’s mission is to provide system-wide fiscal impact analysis and provide research and analysis to support implementation of evidence-based practices. Cost-benefit analysis is one tool SPAC is using to weigh alternatives and evaluate outcomes as measured by lower recidivism rates; it is not a judgment of the system or of individual stakeholders—nor does this report recommend specific remedies. This report updates the previous SPAC cost-benefit analysis to determine the true costs of recidivism in Illinois. The Budgeting for Results Commission (BFR) is a statutorily created commission of legislators and appointees that advises the Governor in prioritizing outcomes and setting fiscal policy to achieve results.5 BFR, with staff and assistance of the Governor’s Office of Management and Budget, now uses the Illinois Results First cost-benefit analysis model as part of the statewide budgetary planning. Recidivism in Illinois Criminal history records show that those who recidivate commit a substantial portion of crime in Illinois. Only 11% of the 71,551 total convictions in 2016 were of individuals with no prior arrests. SPAC’s profiles of average offenders (updated in 2018) demonstrate that many people who are sentenced to prison have long histories of prior arrests and several convictions on their records.6 For purposes of this report and the Illinois Results First costbenefit model, recidivism is defined as a conviction following either a sentence to probation or release from prison. SPAC tracked recidivism rates, as well as the type and frequency of crime by each individual, covering a nine year period. Table A below is the recidivism rates for misdemeanor and felony probation and prison for a 2007 cohort. Currently, a large number of offenders are caught in the repetitive cycle of recidivism. Each new conviction, each recidivating event, represents additional victimizations and costs to the system which accumulate over time. Evidence-based interventions can effectively interrupt this cycle and help put offenders on the path to productive citizenship. In addition to new convictions, technical violations of mandatory supervised release (MSR) also contribute to the high cost of recidivism. Technical violations add costs to system actors, requiring law enforcement, jails, and prisons to arrest and detain those who violate the terms of their community supervision. For the 2007 cohort, approximately 25% of those individuals on MSR committed violations and returned to prison; 10% of those sentenced to probation were violated and sent to prison. These percentages are consistent with past Recidivism events that occur in future years—i.e., years two through five—are discounted at the end of each year using a conservative 5% social discount rate. The social discount rate reflects that a dollar five years from now is worth less than a dollar today since the future is uncertain. At a 5% discount rate, $1.00 received in five years is worth $0.78 today. 5 15 ILCS 20/50-25 (2018). 6 Offender profiles are available at http://ilspac.illinois.gov under the Publications tab. 4 e High Cost of Recidivism 3 Table A. Illinois Recidivism Rates Year from Release Adult Probation (misdemeanors) 1 2 3 4 5 6 7 8 9 19.0% 30.0% 36.7% 41.0% 44.1% 46.2% 48.2% 49.7% 50.9% Adult Probation (felonies) 16.8% 27.9% 35.1% 39.9% 43.2% 45.8% 47.7% 49.4% 50.6% Adult Prison (felonies) 17.4% 33.0% 43.2% 49.5% 53.7% 56.6% 58.7% 60.5% 62.0% Combined Recidivism (felonies and misdemeanors) 17.5% 30.6% 39.1% 44.5% 48.1% 50.8% 52.8% 54.5% 55.9% SPAC analysis of technical violations.7 The average cost of recidivism events is $151,662 per new conviction, which reflects the likelihood of technical violations, system resources consumed, and victimizations associated with each conviction. The calculation also includes the expected victimizations that occur but are not reported and those that are reported but do not result in a final conviction in order to give a more accurate illustration of the true costs of crime. Calculating the True Cost of Crime Cost-benefit analysis has been used in the private sector for decades to compare spending, benefits, and expected outcomes. This method of analysis is powerful for government because it provides an apples-to-apples comparison between programs, helping state and local governments prioritize spending on programs that produce measurable, positive outcomes. Cost-benefit analysis can be used to calculate the benefits of diversion programs, alternatives to incarceration, and the incarceration of those for whom prison is the appropriate sentence. To calculate the true cost of crime in Illinois, SPAC, in collaboration with the Budgeting for Results Commission, has implemented the Pew-MacArthur Results First Initiative’s cost-benefit analysis approach. The approach is adapted to include Illinois-specific costs, unique population and crime characteristics, and recidivism patterns. In addition to the system costs paid by state and local governments, the Results First model incorporates victimization costs established by national research, including jury awards for pain and suffering, to value the average cost of physical, property, and intangible effects of crime. The model uses these inputs to calculate the costs of crime for victims, government programs and services, and the broader economy. This calculation also accounts for the costs of crimes that are not reported or that do not end in conviction. By combining Illinois-specific inputs and the best national research, the model produces estimates of the net long-term social benefits of specific tax-dollar spending, allowing policymakers to look beyond one year’s revenues and expenditures when making funding decisions. Recidivism is Expensive To determine an average cost of one recidivism event, the Illinois Results First cost-benefit model calculated costs ten-thousand times, each time varying the inputs within a range of possible values. For example, the model varies victimization costs above and below the national averages. Calculating the costs so many times with different inputs allows the model to develop realistic best- and worst-case scenarios.8 The modeling produced an average cost as low as $117,000 and as high as $186,000. Because of the wide range of victimization and system costs, the average cost of a recidivism event should be generally applied. A policy affecting only felony drug offenses, for example, may not consistently avoid the average victim costs. A policy reducing a wide range of offenders’ recidivism patterns, however, should avoid these costs. Table B below shows the different average costs, including the ranges, for the adult criminal justice population. See SPAC. (2013). Drivers of the Sentenced Population: MSR Violators. Available at: http://www.icjia.state.il.us/spac/pdf/SPAC%20Report%20MSR%20violator%209-13.pdf; and SPAC. (2013). Drivers of the Sentenced Population: Probation Analysis. Available at: http://www.icjia.state.il.us/spac/pdf/SPAC%20Report%20probation%20analysis%209-13.pdf. 8 This is a common mathematical method known as Monte Carlo simulation. More information on methodology can be found in the Supplement to this report. 7 4 e High Cost of Recidivism Table B. Cohort-Specific Recidivism Costs Minimum Average Maximum Adult Probation (misdemeanors and felonies) $93,000 $122,946 $152,000 Adult Prison (felonies) $139,000 $179,731 $222,000 Combined Recidivism (felonies and misdemeanors) $117,000 $151,662 $186,000 Fifty percent of the $151,662 cost is borne by victims, estimated as $75,408 in tangible (e.g., stolen or damaged property, medical care, lost wages) and intangible (e.g., pain and suffering) costs. Taxpayer costs—through state and local government agents—are $50,835 for the average arrest, adjudication, conviction, and punishment for a conviction. Finally, the indirect losses from lower total economic activity are $25,420.9 The victimization costs reflect the crime patterns experienced in Illinois. SPAC calculated the baseline recidivism rates, shown above, for a cohort of offenders in Illinois who were either released from prison or sentenced to probation in 2007. This year was used in order to have nine years of continuous criminal history data for each individual. The model utilizes these specific Illinois trends in making its estimate. For further information on the methodology and cost-benefit analysis’ inputs, please refer to the SPAC and Budgeting for Results Technical Supplement, available online. Applied to these crime patterns are the average victimization costs from two seminal victimization studies.10 These costs, as shown in Table C on the following page, include tangible costs, which are the physical harms such as medical expenses, cash or property theft or damage, and lost earnings due to injury or related consequences. Intangible costs are the pain and suffering resulting from being a crime victim. Including these costs allows for a reasonable comparison between the public costs and benefits with the societal effects of changing crime in the community. Total Cost of a Recidivism Event: $151,662 Taxpaper Costs $50,835 Victimization Costs $75,408 Indirect Costs $25,420 In economic terms, these costs are the “deadweight costs of taxation” or “excess burden of taxation,” which are estimates of the reduced economic activity caused by taxes that are not offset by other benefits. Economists have identified that taxes reduce activity through fewer consumer purchases and business sales. SPAC includes these estimates of economic inefficiency to account for the true impact of government spending on criminal justice in Illinois. 10 McCollister, K.E., French, M.T., and Fang, H. (2010). The Cost of Crime to Society: New Crime-Specific Estimates for Policy and Program Evaluation. Drug and Alcohol Dependence, 108, 98-109. Cohen, M.A. and Piquero, A.R. (2009). New Evidence on the Monetary Value of Saving a High-Risk Youth. Journal of Quantitative Criminology, 25(1), 25-49. Note: these numbers are based on national calculations and are not specific to Illinois. Illinois does not have a cap on pain and suffering awards; therefore average victimization costs may be higher. SPAC is confident that these numbers are a reliable proxy for Illinois costs and will continue to refine the victim costs, as well as other inputs, to improve the cost estimates of convictions and of criminal justice programs in Illinois. 9 e High Cost of Recidivism 5 Table C. Tangible and Intangible Victim Costs Tangible Victim Costs Intangible Victim Costs Total Victimization Costs Aggravated Assault or Battery Felony Property $12,023 $2,027 $897 $18,567 $6,847 $30,590 Murder Felony Sex Crimes Robbery $567,639 $4,745 $5,950 $6,497,488 $169,294 $7,065,127 $174,039 What is the Cost of Recidivism over Five Years? Felony Drug and Other Misdemeanors $0 $0 $0 $0 $0 $2,027 $0 $0 Just one year of recidivism in Illinois costs the State $1.5 billion per cohort of offenders released from prison and sentenced to felony and misdemeanor probation. This calculation applies the $151,662 per conviction to the one-year recidivism rate (17.5%) of the 59,000 individuals either sentenced to probation or released from prison. Over five years, the costs accumulate to $13 billion as each year more individuals are placed on probation or released from prison and recidivism occurs. This is the high cost of recidivism.11 Table D. Five Years Recidivism Costs First Year Event Year 1 2 3 4 5 Total Second Year Third Year Fourth Year Fifth Year Total Number of Recidivism Recidivism Recidivism Recidivism Recidivism Recidivism Recidivism Recidivism Recidivism Recidivism Recidivism Recidivism Costs Costs Costs Costs Costs Costs Events Events Events Events Events Events (in millions) (millions) (millions) (millions) (millions) (millions) 10,400 $1,502 - - 7,785 $1,071 10,400 $1,363 3,209 $400 5,052 $544 5,052 2,139 28,586 $662 $254 $3,890 7,785 3,209 26,446 - - - - 7,785 $881 $925 10,400 $1,298 $314 5,052 $3,146 $519 - - - - - - 7,785 $839 10,400 $1,236 - - - - 10,400 23,237 $2,697 18,186 $2,075 10,400 - 10,400 $1,502 - 30,230 $2,885 - - $1,177 18,186 $2,434 38,283 $3,062 43,401 $3,103 $1,177 140,499 $12,985 Each year, SPAC estimates about 59,000 individuals are sentenced to probation or released from prison. Using expected recidivism rates from past trends, these individuals will face about 10,400 convictions within the first year and over 28,000 convictions over five years. The total recidivism costs are found by multiplying the number of recidivism events with the Illinois Results First average cost of a recidivism event of $151,662. The future recidivism costs are discounted using a 5% social discount rate to reflect the reduced value of future dollars.12 The cost of a conviction permits SPAC to model changes in recidivism rates over time. This approach allows the Results First model to compare the costs and benefits of different criminal justice policies and programs in Illinois. Sentencing Policy Advisory Council. (2015). Illinois Results First: The High Cost of Recidivism. Available at: http://www.icjia.state.il.us/spac/pdf/Illinois_Results_First_1015.pdf. Note that the updated results are higher per recidivism event than reported in 2015 ($118,746 per event). The new results account for more recent crime and cost data, as well as some methodological improvements of the model overall. 12 If a 2% discount rate were used, the total recidivism costs for five years would be $13.7 billion; if the discount rate were 10%, the total costs would be $12 billion. 11 6 e High Cost of Recidivism Reduce recidivism five percentage points To demonstrate the possible benefits of recidivism reductions, SPAC estimated the effects of reducing recidivism by one, five, and ten percentage points. The five percentage point reduction over five years appears as in Table E:13 Table E. Five Percentage Point Reduction in Recidivism Year from Release Combined Recidivism 5 percentage point reduction 1 17.5% 12.5% 2 30.6% 25.6% 3 39.1% 34.1% 4 44.5% 39.5% 5 48.1% 43.1% Reducing the combined recidivism rate one percentage point results in 594 fewer convictions, avoiding a total of $90.1 million in costs over nine years. Those avoided costs include government expenditures, reduced victimization costs, and improved economic efficiencies. As shown on the right side of the Table F below, a one percent reduction in recidivism creates $44.8 million in reduced victimization costs. Table F. Recidivism Rate Reductions Total Benefits 1% reduction 5% reduction 10% reduction Total Benefits by Beneficiary (millions) Reduce Dollar Benefits Government Convictions (millions) Expenditures Victims Indirect Economic Benefits 594 $90.1 $30.2 $44.8 $15.1 2,972 $450.7 $151.1 $224.1 $75.5 5,943 $901.3 $301.1 $448.1 $151.1 Because the percentage change is consistent each year, the model calculates the savings in the first year.14 In this case, there would be 2,972 fewer convictions and $451 million in costs avoided. This percentage point reduction method has been used by other states that are implementing the Results First model and is the method SPAC uses in the High Cost of Recidivism report. How to Reduce Recidivism Criminal justice and social science research has established that recidivism can be reduced and criminal conduct changed through effective, tried-and-true interventions. Effective, evidence-based policies and programs are those that have been shown to improve outcomes in rigorous evaluations across jurisdictions and in multiple studies. The Illinois Results First cost-benefit model includes a database of programs that address adult criminal justice, as well as other policy areas. Effective policies and programs have been shown to successfully reduce recidivism over time in a variety of states. Note: this report’s approach is different than a percent reduction of the recidivism rate (a percent-of-a-percent approach). In this report, the demonstration simply subtracts five percentage points rather than reducing the recidivism rate (i.e., under an alternative approach, 5% of 17.5% would be a 0.88% reduction to a rate of 16.6% in the first year). 14 The model’s savings are technically the net present value of the costs accrued over the lifetimes of the affected persons. Some of costs such as prison can occur over several years. The future costs are discounted by a discount rate of between 2% and 5%. 13 e High Cost of Recidivism 7 The core concepts of adult criminal justice programs, which are necessary to achieve the desired reduction in crime, are well established. Years of research on evidence-based practices indicates that Illinois could replicate successful program outcomes by: 1. Implementing proven programs with fidelity to the core concepts. If the core concepts of a program are not followed, the result will not be consistent with past outcomes. 2. Ensuring consistent quality assurance of the programs to protect fidelity to the core concepts. In programs that work, quality assurance is ongoing and consistent over time. 3. Collecting and analyzing data to conduct independent program evaluations. This critical component of evidence-based practices verifies the expected outcomes and ensures those outcomes are realized. Program evaluations are also the source for future evidence-based programs and can build a base of knowledge within Illinois. Unfortunately, program evaluations have not been done on a vast majority of programs that Illinois currently funds. 4. Prioritizing funding, with proper analysis of outcomes and resource use, based on success. Success can be defined as any program producing positive social benefits and returns on the investment of taxpayer dollars. Programs that do not produce benefits and a reasonable return on investment should not be funded with tax dollars. Currently, BFR uses Illinois Results First to focus their efforts to inventory criminal justice programs, determine if the programs are evidence based, and analyze the expected returns. Performance monitoring by BFR and the Governor’s Office of Management and Budget permit quality assurance and analysis on whether the programs are expected to achieve the recidivism-reducing benefits. High Cost of Recidivism Cost-benefit analysis is one tool policymakers can use to meet the challenge of reducing recidivism rates at sustainable costs. If Illinois implemented proven evidencebased programs with fidelity, the State could achieve 8 e High Cost of Recidivism lower rates of recidivism, which would result in fewer convictions, fewer crimes, and less victimization. Continuous evaluation and monitoring will be necessary to ensure that these programs are properly implemented and to ensure that actual savings match the expected returns. Data collected from the programs can be used by the cost-benefit model to analyze outcomes and quantify returns on investment. If recidivism reduction strategies are successful, the savings generated become available for other uses—including more investment in programs that work within the criminal justice system, social service interventions that reduce the risk of future criminal behavior, and reentry programs for offenders returning to the community—that reduce the number of victimizations going forward. If recidivism is not addressed using research and cost-benefit analysis, the people of Illinois will continue to pay the high cost of maintaining the status quo. ACKNOWLEDGEMENTS SPAC would like to acknowledge the invaluable contributions to implementing Illinois Results First, particularly the Budgeting for Results Commission, within the Illinois Governor’s Office of Management and Budget. The BFR Commission is using results of Illinois Results First and providing valuable insights into the cost components of this model. SPAC would also like to thank: Research & Analysis staff of the Illinois Criminal Justice Information Authority Research and Planning Unit of the Illinois Department of Corrections The Administrative Office of the Illinois Courts The Illinois State Police The Illinois Sheriff’s Association The Illinois State’s Attorney Appellate Prosecutor Dr. Dave Olson, Loyola University-Chicago The Pew-MacArthur Results First Initiative technical assistance team Printed by the Authority of the State of Illinois IOCI 18-0564 300 copies 5/18