
Jails in Indian Country 2015, Department of Justice, 2016
Download original document:
Document text
Document text
This text is machine-read, and may contain errors. Check the original document to verify accuracy.
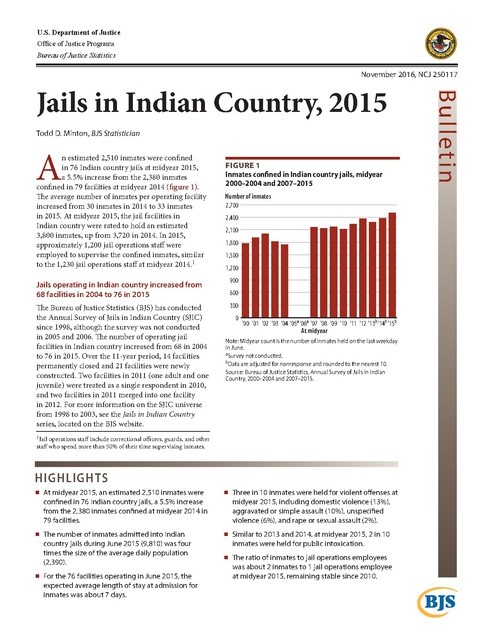
U.S. Department of Justice Office of Justice Programs Bureau of Justice Statistics November 2016, NCJ 250117 Todd D. Minton, BJS Statistician A n estimated 2,510 inmates were confined in 76 Indian country jails at midyear 2015, a 5.5% increase from the 2,380 inmates confined in 79 facilities at midyear 2014 (figure 1). The average number of inmates per operating facility increased from 30 inmates in 2014 to 33 inmates in 2015. At midyear 2015, the jail facilities in Indian country were rated to hold an estimated 3,800 inmates, up from 3,720 in 2014. In 2015, approximately 1,200 jail operations staff were employed to supervise the confined inmates, similar to the 1,230 jail operations staff at midyear 2014.1 Figure 1 Inmates confined in Indian country jails, midyear 2000–2004 and 2007–2015 Number of inmates 2,700 2,400 2,100 1,800 1,500 1,200 Jails operating in Indian country increased from 68 facilities in 2004 to 76 in 2015 900 The Bureau of Justice Statistics (BJS) has conducted the Annual Survey of Jails in Indian Country (SJIC) since 1998, although the survey was not conducted in 2005 and 2006. The number of operating jail facilities in Indian country increased from 68 in 2004 to 76 in 2015. Over the 11-year period, 14 facilities permanently closed and 21 facilities were newly constructed. Two facilities in 2011 (one adult and one juvenile) were treated as a single respondent in 2010, and two facilities in 2011 merged into one facility in 2012. For more information on the SJIC universe from 1998 to 2003, see the Jails in Indian Country series, located on the BJS website. 300 600 0 '00 '01 '02 '03 '04 '05a '06a '07 '08 '09 '10 '11 '12 '13b '14b '15b At midyear Note: Midyear count is the number of inmates held on the last weekday in June. aSurvey not conducted. bData are adjusted for nonresponse and rounded to the nearest 10. Source: Bureau of Justice Statistics, Annual Survey of Jails in Indian Country, 2000–2004 and 2007–2015. 1 Jail operations staff include correctional officers, guards, and other staff who spend more than 50% of their time supervising inmates. HIGHLIGHTS At midyear 2015, an estimated 2,510 inmates were confined in 76 Indian country jails, a 5.5% increase from the 2,380 inmates confined at midyear 2014 in 79 facilities. The number of inmates admitted into Indian country jails during June 2015 (9,810) was four times the size of the average daily population (2,390). For the 76 facilities operating in June 2015, the expected average length of stay at admission for inmates was about 7 days. Three in 10 inmates were held for violent offenses at midyear 2015, including domestic violence (13%), aggravated or simple assault (10%), unspecified violence (6%), and rape or sexual assault (2%). Similar to 2013 and 2014, at midyear 2015, 2 in 10 inmates were held for public intoxication. The ratio of inmates to jail operations employees was about 2 inmates to 1 jail operations employee at midyear 2015, remaining stable since 2010. Bul l etin Jails in Indian Country, 2015 BJS imputed inmate and facility population counts for facilities that did not respond to the survey, including seven facilities in 2004 (213 inmates, or 12% of all inmates confined at midyear), four facilities in 2007 (167 or 8%), two facilities in 2013 (37 or 2%), five facilities in 2014 (223 or 9%), and seven facilities in 2015 (384 or 15%). All operating facilities responded to surveys from 2008 to 2012. (See Methodology for information on jails in Indian country, including details on facility counts and survey participation.) Occupied bed space declined from 86% of rated capacity in 2000 to 66% in 2015 At midyear 2015, the jail facilities in Indian country were rated to hold an estimated 3,800 inmates, up slightly from 3,720 in 2014 (table 1). From June 2000 to June 2015, the overall rated capacity grew at twice the rate (up 83%) of the midyear inmate population (up 41%). As a result, occupied bed space declined from 86% of rated capacity at midyear 2000 to 66% at midyear 2015. When measured relative to the average daily population (ADP), the percentage of rated capacity occupied in Indian country jails was 58% in June 2014 and 63% in June 2015. This was down from 75% in June 2004, the first year ADP was collected (not shown). The largest jails accounted for 26% of all facilities and held nearly 60% of all inmates in Indian country jails Of the inmates confined in Indian country jails at midyear 2015, an estimated 93% (2,340) were held in 56 facilities rated to hold 25 or more inmates (table 2). At midyear 2015, 58% of the jail population was held in 20 facilities rated to hold 50 or more inmates. The 20 facilities with a rated capacity of 24 or fewer inmates accounted for about a quarter (26%) of all facilities and held less than 10% of all inmates in Indian country jails. Among all jails, the population ranged from no inmates in Fort Peck Transitional Living Unit to 228 inmates in the facility for Nisqually Adult Corrections, which held 9% of the total population in Indian country jails at midyear 2015. Overall, 12 facilities accounted for half of the inmate population in Indian country jails. Table 1 Number of inmates, rated capacity, and percent of capacity occupied in Indian country jails, June 2000 and 2010–2015 2000 2010 Number of inmates Midyearb 1,775 2,119 ADPc … 2,009 Rated capacityd 2,076 2,951 Percent of capacity occupiede Midyear 85.5% 71.8% ADP … 68.1 Number of operating facilities 68 75 Average number of inmates per operating facilityf 26 28 2011 2012 2,239 2,364 2,106 2,253 3,136 3,221 2013a 2014a 2015a 2,290 2,140 3,480 2,380 2,170 3,720 2,510 2,390 3,800 71.4% 73.4% 65.7% 64.0% 66.1% 67.2 69.9 61.5 58.3 62.9 80 79 79 79 76 28 30 29 30 33 Note: For comparison over time, data on inmate population and rated capacity were imputed for nonrespondents, including two facilities in 2013, five in 2014, and seven in 2015. See Methodology. …Not collected. aData are adjusted for nonresponse and rounded to the nearest 10. bThe number of inmates held on the last weekday in June. cAverage daily population (ADP) is the number of inmates confined each day in June, divided by 30. Data were estimated for two facilities in 2011 and one facility in 2013 that responded to the survey but did not report their ADP. dThe maximum number of beds or inmates assigned by a rating official. In some cases, facilities responding to the survey reported incomplete data. The rated capacity for two facilities in 2012 was based on their rated capacity in 2011. The rated capacity for midyear 2013 was imputed for three facilities: one was based on 2011 and two were based on 2012. The rated capacity for midyear 2014 was imputed for two facilities: one was based on 2013 and one was based on 2012. eCalculated by dividing the population count of a facility by its rated capacity and multiplying by 100. fBased on the number of inmates held on the last weekday in June. Source: Bureau of Justice Statistics, Annual Survey of Jails in Indian Country, 2000 and 2010–2015. Table 2 Indian country jails and percent of inmate population, by facility size, midyear 2015 Facility sizea Total 9 or fewer 10–24 25–49 50 or more Number Facilities Inmatesb 76 2,510 2 10 18 160 36 880 20 1,460 Percent Facilities Inmates 100% 100% 2.6% 0.4% 23.7 6.4 47.4 35.1 26.3 58.2 aBased on the rated capacity, which is the maximum number of beds or inmates assigned by a rating official. The rated capacity was imputed for seven facilities that did not respond to the survey. bThe number of inmates held on the last weekday in June. Data are adjusted for nonresponse and rounded to the nearest 10. Source: Bureau of Justice Statistics, Annual Survey of Jails in Indian Country, 2015. J A I L S I N I N D I A N CO U N T R Y, 2015 | N O V E M B E R 2016 2 The 20 jails with a rated capacity of 50 or more inmates reported a similar use of their bed space at midyear 2015 and on an average day in June 2015 (65% each) (figure 2). On their most crowded day in June 2015, the 20 largest jails were operating at 79% of their rated capacity. The bed space utilization rate of the 56 facilities that held 49 or fewer inmates varied at midyear 2015 (67% of rated capacity), on an average day in June 2015 (59%), and on their most crowded day in June 2015 (93%). Twenty-six facilities (34%) in 2015 were operating above rated capacity on the most crowded day in June, which was similar to 2014 (table 3). Thirteen facilities were operating above rated capacity on the last weekday in June 2015, and 11 were operating above rated capacity on an average day in June 2015. Figure 2 Percent of rated capacity occupied, by facility size, June 2015 Percent 100 Peak 93% 80 60 Midyear 67% ADP 59% 65% Overall, admissions declined and the average daily population increased, resulting in an increase in expected average length of stay (the time held in custody from admission to release) between June 2014 (about 6 days) and June 2015 (about 7 days). Facilities rated to hold 49 or fewer inmates accounted for the increase in the expected average length of stay. Facilities rated to hold 50 or more inmates reported a decline between midyear 2014 (about 11.5 days) and midyear 2015 (about 10 days). Table 3 Number of Indian country jails, by population measures and percent of rated capacity occupied, June 2015 65% Percent of capacity occupieda 24% or less 25–49% 50–74% 75–100% 101% or more 20 49 or fewer inmates During 2015, the 76 Indian country jails admitted an estimated 9,810 persons, down from 10,460 persons admitted to 79 facilities in June 2014 (table 4). Admissions to Indian country jails in June 2015 were four times the size of the average daily population (2,390), down from five times the size of the average daily population in 2014 (2,170). In June 2015, admissions to facilities rated to hold from 25 to 49 inmates (4,150) and 50 or more inmates (4,410) accounted for nearly 9 in 10 admissions, up from 2014 when facilities rated to hold 25 or more inmates accounted for about 75% of all admissions. 79% 40 0 The expected average length of stay in Indian country jails increased by a day 50 or more inmates Note: Rated capacity is the maximum number of beds or inmates assigned by a rating official. Midyear count is the number of inmates held on the last weekday in June. Average daily population (ADP) is the number of inmates confined in June, divided by 30. Peak population is the number of inmates held on the day in June in which the custody population of a facility was the largest. See Methodology for information on imputed inmate population and rated capacity. Source: Bureau of Justice Statistics, Annual Survey of Jails in Indian Country, 2015. Midyearb 12 18 15 18 13 ADPc 17 22 12 14 11 Peakd 6 12 18 14 26 Note: Rated capacity is the maximum number of beds or inmates assigned by a rating official. Data on inmate population and rated capacity were imputed for seven facilities that did not respond to the survey in 2015. aCalculated by dividing the population count of a facility by its rated capacity and multiplying by 100. bThe number of inmates held on the last weekday in June. cAverage daily population (ADP) is the sum of the number of inmates held on each day in June, divided by 30. dThe number of inmates held on the day in June in which the custody population of a facility was the largest. Source: Bureau of Justice Statistics, Annual Survey of Jails in Indian Country, 2015. Table 4 Admissions and expected average length of stay in Indian country jails, by facility size, June 2014 and 2015 Facility sizec Total 9 or fewer 10 to 24 25 to 49 50 or more Number of facilities 2014 2015 79 76 4 2 24 18 33 36 18 20 ADPa 2014 2,170 5 220 740 1,220 2015 2,390 4 140 790 1,460 Estimated monthly admissions 2014d 2015e 10,460 9,810 130 40 2,490 1,220 4,680 4,150 3,170 4,410 Expected average length of stayb 2014 2015 6.2 days 7.3 days 1.2 3.0 2.7 3.4 4.7 5.7 11.5 9.9 Note: Data are adjusted for nonresponse and rounded to the nearest 10, except for the average daily population (ADP) in facilities with a rated capacity of 9 or fewer. aADP is the sum of the number of inmates held on each day in June, divided by 30. bCalculated by dividing the ADP by the number of June admissions and multiplying by 30. See Methodology. cBased on the rated capacity, which is the maximum number of beds or inmates assigned by a rating official. dData were estimated for seven facilities in 2015 that did not respond to the survey (1,960 admissions combined). eData were imputed for five facilities in 2014 that did not respond to the survey (1,763 admissions combined). Source: Bureau of Justice Statistics, Annual Survey of Jails in Indian Country, 2014 and 2015. J A I L S I N I N D I A N CO U N T R Y, 2015 | N O V E M B E R 2016 3 Since 2010, about 3 in 10 inmates held in Indian country jails have been confined for a violent offense, a decline from 4 in 10 since peaking in 2007.2 At midyear 2015, domestic violence (13%) and aggravated or simple assault (10%) accounted for 23% of all inmates. Inmates held for other violence (6%) and rape or sexual assault (2%) accounted for an additional 8% of the jail population. An estimated 30% of inmates were held for a violent offense each year in the previous 5 years Since 2000, the distribution of Indian country jail inmates by sex and age has changed. Although males accounted for the largest proportion of the inmate population in Indian country jails, the percentage of female jail inmates increased from 20% of all inmates in 2000 to 25% in 2015 (table 5). The juvenile population, defined as those inmates age 17 or younger, declined from 16% in 2000 to less than 10% in 2013, 2014, and 2015. The distribution of inmates by conviction status and offense type also changed. After the percentage of convicted inmates peaked in 2009 at 69%, it declined steadily each year from 2010 (59%) to 2014 (51%). In 2015, the percentage of convicted inmates increased to 55%. Patterns of decline were also observed among inmates held for alcohol- and drug-related offenses. Inmates held for driving while intoxicated or driving while under the influence of drugs or alcohol declined from 16% of the total inmate population in 2000 to 7% at midyear 2015. The percentage of inmates held for a drug law violation declined from 8% in 2000 to 6% at midyear 2015. 2 For 2002, 2004, and 2007 to 2009 data, see Jails in Indian Country, 2012 (NCJ 242187, BJS web, June 2013). Table 5 Inmates confined in Indian country jails, by demographic characteristic, conviction status, and offense, midyear 2000 and 2010–2015 Characteristic Totala Sex Male Female Age group Adults Male Female Juveniles Male Female Conviction status Convicted Unconvicted Most serious offense Violent offense Domestic violence Aggravated/simple assault Rape/sexual assault Other violence Burglary Larceny-theftb Public intoxicationc DWI/DUId Drug offense Other unspecifiede 2000 1,775 2010 2,119 Number of inmates 2011 2012 2013 2,239 2,364 2,290 2014 2,380 2015 2,510 2000 100% 2010 100% Percent of inmates 2011 2012 2013 100% 100% 100% 1,420 350 1,640 480 1,740 500 1,840 530 1,730 560 1,790 590 1,870 640 80% 20 77% 23 78% 22 78% 22 1,500 1,210 280 280 210 70 1,870 1,480 390 250 160 90 2,000 1,580 420 240 160 80 2,120 1,660 450 250 170 80 2,080 1,600 480 210 130 80 2,190 1,670 530 190 130 60 2,300 1,730 570 210 140 70 84% 68 16 16 12 4 88% 70 18 12 8 4 89% 71 19 11 7 3 1,080 690 1,240 880 1,290 950 1,350 1,020 1,290 1,000 1,210 1,170 1,380 1,130 61% 39 59% 41 … … … … … … … … 280 140 … 660 280 230 40 110 … … … 220 100 1,150 650 270 250 40 90 … … … 240 120 1,230 710 320 200 40 160 … … … 230 120 1,300 720 350 230 50 110 40 30 380 200 100 820 650 280 220 40 110 40 20 470 220 130 850 760 330 240 40 150 50 30 440 180 140 920 … … … … … … … … 16% 8 … 31% 13 11 2 5 … … … 10 4 54 2014 100% 2015 100% 76% 24 75% 25 75% 25 90% 70 19 10 7 3 91% 70 21 9 6 3 92% 70 22 8 5 3 92% 69 23 8 6 3 58% 42 57% 43 56% 44 51% 49 55% 45 29% 12 11 2 4 … … … 11 5 55 30% 14 8 2 7 … … … 10 5 55 32% 15 10 2 5 2 1 17 9 4 36 27% 12 9 2 5 2 1 20 9 5 36 30% 13 10 2 6 2 1 17 7 6 37 Note: Based on the number of inmates held on the last weekday in June. Data are estimated for nonresponse and rounded to the nearest 10. As a result, reports prior to 2014 are not comparable. Detail may not sum to total due to rounding. See appendix tables 1 through 4 for a list of all facilities and inmate characteristics for 2015. See appendix table 5 for the reported characteristic counts. See Methodology for detail on estimating inmate characteristics. …Not collected. aThe total in custody data for 2013, 2014, and 2015 are adjusted for nonresponse and rounded to the nearest 10. bExcludes motor-vehicle theft. cIncludes drunk and disorderly. dIncludes driving while intoxicated and driving while under the influence of drugs or alcohol. eIn 2013, BJS started collecting data on burglary, larceny-theft, and public intoxication. As a result, other unspecified offenses in prior years are not comparable to 2013 through 2015. Source: Bureau of Justice Statistics, Annual Survey of Jails in Indian Country, 2000 and 2010–2015. J A I L S I N I N D I A N CO U N T R Y, 2015 | N O V E M B E R 2016 4 In 2013, BJS enhanced the SJIC offense category questionnaire item to include burglary, larceny-theft, and public intoxication, which allowed for better classification of previously unspecified offenses. About 20% of inmates at midyear 2015 were charged with public intoxication (17%), burglary (2%), and larcenytheft (1%), which was similar to 2013 and 2014. (29%) in Indian country jails were administrative employees; educational staff; technical or professional staff; clerical, maintenance, or food service staff; or staff performing other job functions. The number of correctional staff increased since 2010 Indian country jail authorities reported 10 deaths in custody since midyear 2010 (not shown). Two deaths, including one suicide, were reported during the 12-month period ending June 30, 2015. During the same period, 68 facilities reported a total of 53 attempted suicides. Among the 61 facilities reporting valid data on attempted suicide in both 2014 and 2015, 51 inmates in 2014 and 52 in 2015 attempted suicide. Overall, attempted suicides in Indian country jails declined significantly after peaking in 2002. (For more information, see Jails in Indian Country, 2012, NCJ 242187, BJS web, June 2013.) Indian country jails employed an estimated 1,690 persons at midyear 2015 (table 6). Each year since 2010, jail operations staff accounted for about 7 in 10 personnel. Jail operations staff consists of correctional officers and other staff who spend more than 50% of their time supervising inmates. The number of jail operations staff remained stable from midyear 2013 to midyear 2015, but increased 19% from midyear 2010 to midyear 2015. Overall, the ratio of inmates to jail operations employees was about 2 inmates to 1 jail operations employee at midyear 2015, remaining stable since 2010. An estimated 490 jail personnel Two reported deaths occurred in Indian country jails in the 12-month period ending June 30, 2015 Table 6 Persons employed in Indian country jails, by job function, midyear 2010 and 2013–2015 Job function Total Administrativec Jail operationsd Educational staff Technical/professional Clerical/maintenance/food service Other unspecified functions Number of inmates per jail operations staff 2010a 1,469 157 1,010 27 56 186 33 2.1 2013b 1,740 160 1,180 30 100 220 50 1.9 Number 2014b 1,710 140 1,230 30 80 210 20 1.9 2015b 1,690 150 1,200 30 70 210 40 2.1 Percent 2010 100% 10.7 68.8 1.8 3.8 12.7 2.2 2013 100% 9.2 67.8 1.7 5.7 12.6 2.9 2014 100% 8.2 71.9 1.8 4.7 12.3 1.2 2015 100% 8.9 71.0 1.8 4.1 12.4 2.4 aData are not rounded because response rate was 100%. bData are estimated and rounded to the nearest 10 because six facilities in 2013, eight in 2014, and nine in 2015 did not report information on staff. See appendix table 6 for reported staff counts. See Methodology for detail on estimation. cIncludes jail administrators, assistants, and other personnel who work in an administrative capacity more than 50% of the time. dIncludes correctional officers, guards, and other staff who spend more than 50% of their time supervising inmates. Source: Bureau of Justice Statistics, Annual Survey of Jails in Indian Country, 2010 and 2013–2015. J A I L S I N I N D I A N CO U N T R Y, 2015 | N O V E M B E R 2016 5 Methodology tribal court sentencing authority. As a result, offenders may serve potentially lengthier sentences (up to 3 years) in Indian country correctional facilities (P.L. 111-211, H.R. 725, 124 Stat. 2258). The Bureau of Justice Statistics’ (BJS) Annual Survey of Jails in Indian Country (SJIC) includes all Indian country correctional facilities operated by tribal authorities or the Bureau of Indian Affairs, U.S. Department of the Interior. BJS has conducted the SJIC annually since 1998, excluding 2005 and 2006. The 2015 survey collected data about the number of inmates and percentage of capacity occupied. Capacity occupied is based on the June 2015 average daily population (ADP), midyear population, and peak population in facilities in June 2015 (appendix table 1). ADP is the number of inmates confined each day in June, divided by 30, midyear count is the number of inmates held on the last weekday in June, and peak population is the number of inmates held on the day in June in which the custody population of a facility was the largest. Tribal law enforcement agencies act as first responders to both felony and misdemeanor crimes. For most of Indian country, the federal government provides felony law enforcement concerning crimes by or against American Indians and Alaska Natives. Certain areas of Indian country are under Public Law 83-280, as amended (commonly referred to as Public Law 280). Public Law 280 conferred jurisdiction over Indian country to certain states and suspended enforcement of the Major Crimes Act (18 U.S.C. § 1153) and the General Crimes Act (18 U.S.C. § 1152) in those areas. Indian tribes retain concurrent jurisdiction to enforce laws in Indian country where Public Law 280 applies. Through a cooperative agreement with BJS, Westat, Inc. conducted the SJIC that is designed to cover all adult and juvenile jail facilities and detention centers in Indian country. The reference date for the survey is June 30, 2015. For this report, Indian country includes reservations, pueblos, rancherias, and other appropriate areas (18 U.S.C. § 1151). Indian country is a statutory term that includes all lands within an Indian reservation, dependent Indian communities, and Indian trust allotments (18 U.S.C. § 1151). Courts interpret Section 1151 to include all lands held in trust for tribes or their members. (See United States v. Roberts, 185 F.3d 1125 (10th Cir. 1999)). Tribal authority to imprison American Indian offenders had been limited to 1 year per offense by statute (25 U.S.C. § 1302), a $5,000 fine, or both. On July 29, 2010, the Tribal Law and Order Act of 2010 was signed into law, expanding Annually, BJS updates its existing roster of jails in Indian country. BJS obtains data from administrators of Indian country jails by faxed questionnaires and through follow-up phone calls and facsimiles. The survey universe and response rates have changed over time. During the 11-year period, many facilities have closed or been constructed (table 7). In some cases, facilities do not respond to the survey or report incomplete data. For comparison over time, BJS imputed data on inmate populations for facilities that did not respond to the surveys, including seven in 2004, four in 2007, two in 2013, five in 2014, and seven in 2015. In 2015, imputations for the midyear jail populations, ADP, peak population, and admission during the month of June used the most recent available data. The imputed value for the peak population for five facilities during June 2015 was based on their midyear population or ADP in June 2015, whichever was greater. Table 7 Indian country jail survey universe and response rates, 2004 and 2007–2015 Original roster of facilitiesd Number of facilities Non-operational or out-of-scopee Pre-survey fielding Post-survey fielding Added facilitiesf Active survey universeg Number of respondents Number of nonrespondents Response rate 2004 2007 2008 2009a 2010 2011b 2012c 2013 2014 2015 70 86 86 86 86 86 89 89 90 90 2 0 : 68 61 7 90% 3 0 : 83 79 4 95% 4 0 0 82 82 0 100% 6 1 0 79 79 0 100% 7 4 0 75 75 0 100% 6 3 3 80 80 0 100% 7 3 0 79 79 0 100% 11 0 1 79 77 2 97% 7 4 0 79 74 5 94% 7 7 0 76 69 7 91% Note: The survey universe was revised for 2008, 2011, and 2012. The survey was not conducted in 2005 and 2006. Between 2004 and 2007, 7 facilities closed, 21 facilities in the 2007 survey were newly constructed or new to the collection, and 1 facility that was closed in 2004 reopened and was included in the survey. For the 1998–2003 survey universe, see the Jails in Indian Country series located on the BJS website. : Not calculated. aPrior to the 2010 data collection, one facility in the 2009 universe was determined to be closed, resulting in a revised (79 facilities) facility count for 2009. bTwo facilities in 2011 (one adult and one juvenile) were treated as one respondent in 2010. cTwo facilities merged into one facility, resulting in a final universe of 79 facilities. dIncludes the number of facilities expected to be surveyed. eIncludes the number of facilities determined to be closed or out-of-scope of the survey, either prior to the fielding of the survey or during data collection activity. fIncludes the number of facilities newly constructed, new to the data collection, or temporary closed facilities that were reopened. gIncludes the final number of facilities in the survey universe after removing non-operational and out-of-scope facilities. Source: Bureau of Justice Statistics, Annual Survey of Jails in Indian Country, 2004 and 2007–2015. J A I L S I N I N D I A N CO U N T R Y, 2015 | N O V E M B E R 2016 6 Expected length of stay for 2015 The stock-flow ratio method was used to measure the expected average length of stay for inmates held during June 2015. Stock—average daily population during June 2015 = 2,390 Flow—inmate admissions during June 2015 = 9,810 Stock-flow ratio in June 2015 = 0.244 (2,390/9,810 = 0.244) Expected length of stay in days (the average number of days held in custody from admission to release) = 7.3 days (0.244 × 30 days = 7.3). J A I L S I N I N D I A N CO U N T R Y, 2015 | N O V E M B E R 2016 7 Table 8 Estimation of inmate characteristics in table 5 2015 Estimated data for 2 facilities are based on their 2014 data. Estimated data for 4 facilities are based on their 2013 data. Estimated data for 1 facility are based on their 2012 data. 2014 Estimated data for 4 facilities are based on their 2013 data. Estimated data for 1 facility are based on their 2012 data. 2013 Estimated data for 3 facilities are based on their 2012 data. 2012 Estimated data for 1 facility are based on the ratio of the total number of inmates in their jail at midyear 2012 to the reported number of inmates by sex in 2012. 2011 No estimated data. 2010 No estimated data. 2000 No estimated data. Conviction status Estimated data for 2 facilities are based on their 2014 data. Estimated data for 4 facilities are based on their 2013 data. Estimated data for 1 facility are based on their 2012 data. Estimated data for 3 facilities are based on their 2013 data. Estimated data for 2 facilities are the ratio of the total number of inmates in their jail at midyear 2014 to the reported number of inmates by conviction status in 2013. Estimated data for 1 facility are based on their 2012 data. Estimated data for 3 facilities are based on their 2012 data. Estimated data for 1 facility are based on the ratio of the total number of inmates in their jail at midyear 2013 to the reported number of inmates by conviction status in 2013. Estimated data for 1 facility are based on the ratio of the total number of inmates in their jail at midyear 2012 to the reported number of inmates by conviction status in 2012. Estimated data for 1 facility are based on the ratio of the total number of inmates in their jail at midyear 2012 to the reported number of inmates by conviction status in 2013. Estimated data for 1 facility are based on their 2013 data. Estimated data for 1 facility are based on their 2011 data. Estimated data for 2 facilities are based on the ratio of the total number of inmates in their jail at midyear 2011 to the reported number of inmates by conviction status in 2011. Estimated data for 1 facility are based on the ratio of the total number of inmates in their jail at midyear 2011 to the reported number of inmates by conviction status in 2013. Estimated data for 1 facility are based on the ratio of the total number of inmates in their jail at midyear 2011 to the reported number of inmates by conviction status in 2010. Estimated data for 14 inmates are based on the ratio of the total number of inmates in their jail at midyear 2010 to the reported number of inmates by conviction status in 2010. No estimated data. Most serious offense Estimated data for 3 facilities are based on their 2013 data. Estimated data for 2 facilities are based on the ratio of the total number of inmates in their jail at midyear 2014 to the reported number of inmates by offense type in 2013. Estimated data for 1 facility are based on their 2012 data. Estimated data for 1 facility are based on the ratio of the total number of inmates in their jail at midyear 2014 to the reported number of inmates by offense type in 2011. Estimated data for 3 facilities are based on the ratio of the total number of inmates in their jail at midyear 2013 to the reported number of inmates by offense type in 2013. Estimated data for 1 facility are based on the ratio of the total number of inmates in their jail at midyear 2012 to the reported number of inmates by offense type in 2014. Estimated data for 1 facility are based on their 2012 data. Estimated data for 1 facility are based on their 2011 data. Estimated data for 2 facilities are based on their 2013 data. Estimated data for 2 facilities are based on their 2011 data. Estimated data for 1 facility are based on the ratio of the total number of inmates in their jail at midyear 2012 to the reported number of inmates by offense type in 2012. Estimated data for 1 facility are based on their historical reporting of offense data into the “other” category. Estimated data for 3 facilities are based on the ratio of the total number of inmates in their jail at midyear 2011 to the reported number of inmates by offense type in 2010. Estimated data for 1 facility are based on the ratio of the total number of inmates in their jail at midyear 2011 to the reported number of inmates by offense type in 2013. Estimated data for 3 facilities are based on the ratio of the total number of inmates in their jail at midyear 2010 to the reported number of inmates by offense type in 2010. Estimated data for 1 facility are based on the ratio of the total number of inmates in their jail at midyear 2000 to the reported number of inmates by offense type in 2002. Estimated data for 1 facility are based on the ratio of the total number of inmates in their jail at midyear 2000 to the reported number of inmates by offense type in 1999. Sex/age group Estimated data for 2 facilities are based on their 2014 data. Estimated data for 4 facilities are based on their 2013 data. Estimated data for 1 facility are based on their 2011 data. Estimated data for 1 facility are based on the ratio of the total number of inmates in their jail at midyear 2015 to the reported number of inmates by offense type in 2015. Source: Bureau of Justice Statistics, Annual Survey of Jails in Indian Country, 2000 and 2010–2015. J A I L S I N I N D I A N CO U N T R Y, 2015 | N O V E M B E R 2016 8 Table 9 Estimation of facility staff in table 6 2015 estimated data for 2 facilities are based on their 2014 data, data for 5 facilities are based on their 2012 data, and data for 1 facility are based on the ratio of the total number of staff at midyear 2015 to the reported job function in 2014. 2014 estimated data for 8 facilities are based on their 2012 data. 2013 estimated data for 6 facilities are based on their 2012 data. Source: Bureau of Justice Statistics, Annual Survey of Jails in Indian Country, 2013–2015. J A I L S I N I N D I A N CO U N T R Y, 2015 | N O V E M B E R 2016 9 Appendix Table 1 Inmates, rated capacity, and percent of capacity occupied in Indian country jails, by facility, June 2015 State and facility Total estimateda Total reported Alaska Metlakatla Police Department and Adult Detention Center Arizona Ak-Chin Tribal Police and Detention Center Colorado River Indian Tribes Adult Detention Center Fort McDowell Police Department and Holding Facility Fort Mohave Tribal Police Department and Holding Facility Gila River Department of Rehabilitation and Supervision - Adult Gila River Department of Rehabilitation and Supervision - Juvenile Hualapai Adult Detention Center Hualapai Juvenile Detention and Rehabilitation Center Navajo Department of Corrections - Chinle Navajo Department of Corrections - Kayenta Police Department and Holding Facility Navajo Department of Corrections - Tuba City Navajo Department of Corrections - Window Rock Pascua Yaqui Police Department and Holding Facility Salt River Pima-Maricopa Department of Corrections San Carlos Department of Corrections and Rehabilitation - Adult Detention San Carlos Department of Corrections and Rehabilitation - Juvenile Detention Supai Law Enforcement and Holding Facility Tohono O’odham Adult Detention Center Tohono O’odham Juvenile Detention Centerf Tuba City Juvenile Detention Center White Mountain Apache Detention Centerf Colorado Chief Ignacio Justice Center Adult Detention Chief Ignacio Justice Center Juvenile Detention Southern Ute Police Department and Adult Detention Center Idaho Shoshone Bannock Tribal Corrections Michigan Sault Ste. Marie Tribal Youth Facility Minnesota Red Lake Tribal Justice Center Adult Detention Red Lake Tribal Justice Juvenile Detention Mississippi Choctaw Justice Complex Adult Detentionf Choctaw Justice Complex Juvenile Detention Montana Blackfeet Adult Detention Center Flathead Adult Detention Center Fort Belknap Adult Detention Center Fort Peck Indian Youth Service Center Fort Peck Police Department and Adult Detention Center Fort Peck Transitional Living Unit Northern Cheyenne Adult Detention Center Northern Cheyenne Youth Service Center Rocky Boy Adult Detention Center Nebraska Omaha Tribal Police Department and Adult Detention Nevada Eastern Nevada Law Enforcement Adult Detention Facility Number of Inmates Peak Inmates population Rated in custody ADPb in Junec capacityd 2,510 2,390 3,230 3,800 2,124 2,022 2,614 3,344 Percent of capacityb Peak Population population at midyeara ADPa in Junea 66% 63% : : : : 1 0 2 10 10% 0% 20% 17 42 2 7 137 19 20 10 51 14 6 76 13 51 115 41 10 175 / 1 / 19 42 1 3 142 21 34 9 19 8 28 49 2 55 120 36 1 175 / 1 / 24 46 9 13 155 28 34 12 76 14 28 115 13 60 129 42 / 183 / 5 / 44 36 10 10 225 70 40 30 48 10 132 95 20 198 108 48 6 107 / 36 / 39% 117 20 70 61 27 50 33 106 140 5 80 65 26 106 85 167 164 / 3 / 43% 117 10 30 63 30 85 30 40 80 21 52 10 28 111 75 17 164 / 3 / 55% 128 90 130 69 40 85 40 158 140 21 121 65 30 119 88 / 171 / 14 / 30 7 15 28 11 16 37 14 22 54 22 57 56% 32 26 52% 50 28 69% 64 39 55 55 63 100 55% 55% 63% 6 7 10 25 24% 28% 40% 43 2 47 5 54 7 42 26 102% 8 112% 19 129% 27 / 10 / 9 / 11 / 25 / 40% / 36% / 44% 17 25 10 11 51 0 15 18 13 8 25 8 7 47 0 31 15 3 30 25 11 11 51 0 41 18 19 44 32 10 21 88 20 19 36 36 39% 78 100 52 58 0 79 50 36 18% 78 80 33 53 0 163 42 8 68% 78 110 52 58 0 216 50 53 35 41 51 36 97% 114% 142% 20 9 / 26 77% 35% / Continued on next page J A I L S I N I N D I A N CO U N T R Y, 2015 | N O V E M B E R 2016 10 APPENDIX TABLE 1 (continued) Inmates, rated capacity, and percent of capacity occupied in Indian country jails, by facility, June 2015 Inmates State and facility in custody New Mexico Acoma Tribal Police and Holding Facility 12 Jicarilla Department of Corrections - Adult and Juvenilef / Laguna Detention Facility 34 Navajo Department of Corrections - Crownpoint 34 Navajo Department of Corrections - Crownpoint Juvenile 2 Navajo Department of Corrections - Shiprock Police Department and Adult Detention 31 Ramah Navajo Police Department and Detention Center 2 Taos Tribal Police Department and Detention 3 Zuni Adult Detention Center 29 Zuni Juvenile Detention Center 1 North Dakota Fort Totten Law Enforcement and Adult Detention Center 28 Gerald Tex Fox Justice Center Adult Detention 21 Gerald Tex Fox Justice Center Juvenile Detention 11 Standing Rock Law Enforcement and Adult Detention Center 52 Turtle Mountain Law Enforcement Adult Detention 27 Oklahoma Sac and Fox Juvenile Detention Center 13 Oregon Warm Springs Police Department and Adult Detention Center 52 South Dakota Cheyenne River Sioux Adult Detention Center 49 Cheyenne River Sioux Juvenile Detention Center 2 Ki Yuksa O’Tipi Reintegration Centerf / Lower Brule Justice Center - Adult Detention 23 Medicine Root Detention Centerf / Oglala Sioux Tribal Offenders Facilityf / Rosebud Sioux Tribal Police Department and Adult Detention 81 Rosebud Sioux Wanbli Wiconi Tipi Juvenile Detention 15 Sisseton-Wahpeton Law Enforcement Adult Detention Center 17 Washington Chehalis Tribal Jail 23 Colville Tribal Correctional Facility 40 Makah Public Safety - Adult Detention 4 Nisqually Adult Corrections 228 Puyallup Tribal Law Enforcement and Adult Detention 7 Quinault Nation Police Department and Holding Facility 12 Wisconsin Menominee Tribal Detention Facility 36 Wyoming Wind River Adult Detention Center 44 Number of Inmates Peak population Rated ADPb in Junec capacityd Percent of capacityb Peak Population population at midyeara ADPa in Junea 4 / 30 30 1 19 2 3 36 1 / / 35 49 7 48 8 5 49 / 25 / 45 42 14 40 10 8 30 12 48% / 76 81 14 78 20 38 97 8 16% / 67 71 7 48 20 38 120 8 / / 78 117 50 120 80 63 163 / 28 19 11 51 26 32 29 14 66 35 30 36 39 48 30 93% 58 28 108 90 93% 53 28 106 87 107% 81 36 138 117 9 14 60 22% 15% 23% 49 60 51 102% 96% 118% 28 1 / 28 / / 83 15 12 49 8 / 40 / / 95 / 18 30 10 / 38 / / 160 36 29 163% 20 / 61 / / 51 42 59 93% 10 / 74 / / 52 42 41 163% 80 / 105 / / 59 / 62 29 45 5 218 5 17 38 52 9 228 12 21 42 60 16 288 28 14 55% 67 25 79 25 86 69% 75 31 76 18 121 90% 87 56 79 43 150 37 43 45 80% 82% 96% 44 57 26 169% 169% 219% Note: The total number of inmates for the peak population was not calculated because the most crowded day in June varied across the jails. : Not calculated. / Not reported. aDetail does not sum to total due to estimating data for survey and item nonresponse and rounding. bCalculated by dividing the population count of a facility by its rated capacity and multiplying by 100. cAverage daily population (ADP) is the number of inmates confined in June, divided by 30. dThe number of inmates held on the day in June in which the custody population of a facility was the largest. eThe maximum number of beds or inmates assigned by a rating official to a facility. Excludes temporary holding areas. fDid not respond to the survey. Source: Bureau of Justice Statistics, Annual Survey of Jails in Indian Country, 2015. J A I L S I N I N D I A N CO U N T R Y, 2015 | N O V E M B E R 2016 11 Appendix Table 2 Inmates in Indian country jails, by most serious offense, midyear 2015 State and facility Total estimateda Total reported Alaska Metlakatla Police Department and Adult Detention Center Arizona Ak-Chin Tribal Police and Detention Center Colorado River Indian Tribes Adult Detention Center Fort McDowell Police Department and Holding Facility Fort Mohave Tribal Police Department and Holding Facility Gila River Department of Rehabilitation and Supervision - Adult Gila River Department of Rehabilitation and Supervision - Juvenile Hualapai Adult Detention Center Hualapai Juvenile Detention and Rehabilitation Center Navajo Department of Corrections - Chinle Navajo Department of Corrections - Kayenta Police Department and Holding Facility Navajo Department of Corrections - Tuba City Navajo Department of Corrections - Window Rock Pascua Yaqui Police Department and Holding Facility Salt River Pima-Maricopa Department of Corrections San Carlos Department of Corrections and Rehabilitation - Adult Detention San Carlos Department of Corrections and Rehabilitation - Juvenile Detention Supai Law Enforcement and Holding Facility Tohono O’odham Adult Detention Center Tohono O’odham Juvenile Detention Centere Tuba City Juvenile Detention Center White Mountain Apache Detention Centere Colorado Chief Ignacio Justice Center Adult Detention Chief Ignacio Justice Center Juvenile Detention Southern Ute Police Department and Adult Detention Center Idaho Shoshone Bannock Tribal Corrections Michigan Sault Ste. Marie Tribal Youth Facility Minnesota Red Lake Tribal Justice Center Adult Detention Red Lake Tribal Justice Juvenile Detention Mississippi Choctaw Justice Complex Adult Detentione Choctaw Justice Complex Juvenile Detention Aggravated/ Rape/ Inmates Domestic simple sexual in custody violence assault assault 2,510 330 240 40 2,124 285 214 36 Other violent 150 143 Larceny- Public Drug Burglary theftb intoxicationc DWI/DUId offense 50 30 440 180 140 44 28 259 162 134 Not Other reported 920 0 810 395 1 0 0 0 0 0 0 1 0 0 0 0 17 42 2 7 137 19 20 10 51 14 6 76 13 51 115 41 10 175 / 1 / 3 11 0 0 0 0 11 3 13 0 3 17 9 7 7 3 1 31 / 1 / 2 5 0 0 45 5 4 2 3 2 0 2 3 5 15 1 2 27 / 0 / 0 4 0 1 0 1 0 0 0 0 0 0 0 0 4 0 1 6 / 0 / 3 6 0 0 8 0 1 0 7 0 0 2 0 3 32 3 0 24 / 0 / 0 0 0 0 5 0 0 0 0 0 0 0 0 0 3 2 0 8 / 0 / 0 1 0 0 0 0 0 0 0 0 0 0 0 0 4 0 0 0 / 0 / 0 2 1 0 8 0 0 1 11 3 3 41 0 3 8 6 4 20 / 0 / 0 3 0 2 0 0 3 0 1 2 0 0 0 4 8 1 0 8 / 0 / 1 2 1 0 10 2 1 0 1 0 0 1 1 3 3 1 2 6 / 0 / 8 8 0 4 61 11 0 4 15 7 0 13 0 26 31 24 0 45 / 0 / 0 0 0 0 0 0 0 0 0 0 0 0 0 0 0 0 0 0 / 0 / 30 7 15 1 0 0 3 3 1 1 0 0 6 0 0 0 0 0 0 1 0 7 0 0 4 0 3 0 2 4 8 1 7 0 0 0 55 13 4 0 0 0 0 1 12 9 16 0 6 0 0 3 0 1 0 0 0 1 1 0 43 2 1 0 1 1 3 0 0 0 2 0 0 0 0 0 8 0 5 0 23 1 0 0 / 10 / 0 / 0 / 0 / 1 / 1 / 0 / 0 / 0 / 0 / 8 / 0 Continued on next page J A I L S I N I N D I A N CO U N T R Y, 2015 | N O V E M B E R 2016 12 APPENDIX TABLE 2 (continued) Inmates in Indian country jails, by most serious offense, midyear 2015 State and facility Montana Blackfeet Adult Detention Center Flathead Adult Detention Center Fort Belknap Adult Detention Center Fort Peck Indian Youth Service Center Fort Peck Police Department and Adult Detention Center Fort Peck Transitional Living Unit Northern Cheyenne Adult Detention Center Northern Cheyenne Youth Service Center Rocky Boy Adult Detention Center Nebraska Omaha Tribal Police Department and Adult Detention Nevada Eastern Nevada Law Enforcement Adult Detention Facility New Mexico Acoma Tribal Police and Holding Facility Jicarilla Department of Corrections - Adult and Juvenilee Laguna Detention Facility Navajo Department of Corrections - Crownpoint Navajo Department of Corrections - Crownpoint Juvenile Navajo Department of Corrections - Shiprock Police Department and Adult Detention Ramah Navajo Police Department and Detention Center Taos Tribal Police Department and Detention Zuni Adult Detention Center Zuni Juvenile Detention Center North Dakota Fort Totten Law Enforcement and Adult Detention Center Gerald Tex Fox Justice Center Adult Detention Gerald Tex Fox Justice Center Juvenile Detention Standing Rock Law Enforcement and Adult Detention Center Turtle Mountain Law Enforcement Adult Detention Oklahoma Sac and Fox Juvenile Detention Center Oregon Warm Springs Police Department and Adult Detention Center South Dakota Cheyenne River Sioux Adult Detention Center Cheyenne River Sioux Juvenile Detention Center Ki Yuksa O’Tipi Reintegration Centere Lower Brule Justice Center - Adult Detention Aggravated/ Inmates in Domestic simple custody violence assault Rape/ sexual assault Other violent Larceny- Public Drug Burglary theftb intoxicationc DWI/DUId offense Not Other reported 17 25 10 11 51 0 15 18 13 5 0 3 1 10 0 1 3 0 1 0 4 3 5 0 0 2 0 0 0 0 0 1 0 0 1 0 0 0 1 0 10 0 1 1 0 1 0 0 1 1 0 2 1 0 0 0 0 1 2 0 0 0 0 0 1 0 4 2 0 3 0 3 3 0 0 0 5 0 1 1 3 1 0 1 0 5 0 0 2 2 6 24 1 1 10 0 7 7 5 0 0 0 0 0 0 0 0 0 35 1 3 0 4 0 0 6 6 2 13 0 20 2 2 0 2 0 1 2 0 1 10 0 12 / 34 34 2 31 2 3 29 1 3 / 6 20 0 5 0 0 2 0 2 / 0 0 0 2 0 0 3 0 0 / 1 0 0 0 0 0 0 0 0 / 7 0 2 0 0 0 7 0 0 / 3 0 0 0 0 0 1 1 0 / 0 0 0 0 0 0 0 0 5 / 1 3 0 21 2 0 2 0 1 / 7 2 0 2 0 2 6 0 0 / 1 1 0 0 0 0 5 0 1 / 8 8 0 1 0 1 3 0 0 / 0 0 0 0 0 0 0 0 28 21 11 52 27 5 3 0 1 7 0 4 0 1 1 0 0 0 0 0 0 0 0 0 8 0 0 0 0 0 0 0 0 0 0 0 2 3 18 1 7 2 0 5 1 4 6 0 8 3 12 4 8 10 6 0 0 0 9 0 13 1 0 0 0 4 1 0 0 1 6 0 52 3 1 0 0 0 0 13 7 3 25 0 49 2 / 23 1 0 / 3 0 0 / 3 0 0 / 0 0 0 / 1 0 0 / 0 0 0 / 0 3 0 / 2 2 0 / 0 0 1 / 2 43 1 / 12 0 0 / 0 Continued on next page J A I L S I N I N D I A N CO U N T R Y, 2015 | N O V E M B E R 2016 13 APPENDIX TABLE 2 (continued) Inmates in Indian country jails, by most serious offense, midyear 2015 State and facility South Dakota (continued) Medicine Root Detention Centere Oglala Sioux Tribal Offenders Facilitye Rosebud Sioux Tribal Police Department and Adult Detention Rosebud Sioux Wanbli Wiconi Tipi Juvenile Detention Sisseton-Wahpeton Law Enforcement Adult Detention Center Washington Chehalis Tribal Jail Colville Tribal Correctional Facility Makah Public Safety - Adult Detention Nisqually Adult Corrections Puyallup Tribal Law Enforcement and Adult Detention Quinault Nation Police Department and Holding Facility Wisconsin Menominee Tribal Detention Facility Wyoming Wind River Adult Detention Center Aggravated/ Inmates in Domestic simple custody violence assault Rape/ sexual assault Other violent Larceny- Public Drug Burglary theftb intoxicationc DWI/DUId offense Not Other reported / / 81 15 17 / / 17 1 0 / / 10 1 0 / / 0 1 1 / / 0 0 0 / / 2 0 0 / / 1 3 0 / / 18 4 4 / / 3 3 4 / / 4 2 1 / / 26 0 7 / / 0 0 0 23 40 4 228 7 12 1 10 1 30 0 1 6 11 0 2 1 4 2 4 0 0 0 1 0 3 0 0 0 0 1 3 0 0 0 0 2 2 0 9 0 0 0 1 0 0 0 1 0 3 0 19 0 0 6 2 0 4 1 5 5 1 3 164 5 0 0 0 0 0 0 0 36 1 2 0 0 1 0 1 0 1 30 0 44 2 4 0 0 0 0 13 8 3 14 0 /Not reported. aDetail does not sum to total due to estimating data for survey and item nonresponse and rounding. bExcludes motor-vehicle theft. cIncludes drunk and disorderly. dIncludes driving while intoxicated and driving while under the influence of drugs or alcohol. eDid not respond to the survey. Source: Bureau of Justice Statistics, Annual Survey of Jails in Indian Country, 2015. J A I L S I N I N D I A N CO U N T R Y, 2015 | N O V E M B E R 2016 14 Appendix Table 3 Inmates in Indian country jails, by conviction status, midyear 2015 State and facility Inmates in custody Total estimateda 2,510 Total reported 2,124 Alaska Metlakatla Police Department and Adult Detention Center 1 Arizona Ak-Chin Tribal Police and Detention Center 17 Colorado River Indian Tribes Adult Detention Center 42 Fort McDowell Police Department and Holding Facility 2 Fort Mohave Tribal Police Department and Holding Facility 7 Gila River Department of Rehabilitation and Supervision - Adult 137 Gila River Department of Rehabilitation and Supervision - Juvenile 19 Hualapai Adult Detention Center 20 Hualapai Juvenile Detention and Rehabilitation Center 10 Navajo Department of Corrections - Chinle 51 Navajo Department of Corrections - Kayenta Police Department and Holding Facility 14 Navajo Department of Corrections - Tuba City 6 Navajo Department of Corrections - Window Rock 76 Pascua Yaqui Police Department and Holding Facility 13 Salt River Pima-Maricopa Department of Corrections 51 San Carlos Department of Corrections and Rehabilitation - Adult Detention 115 San Carlos Department of Corrections and Rehabilitation - Juvenile Detention 41 Supai Law Enforcement and Holding Facility 10 Tohono O’odham Adult Detention Center 175 Tohono O’odham Juvenile Detention Centerc / Tuba City Juvenile Detention Center 1 White Mountain Apache Detention Centerc / Colorado Chief Ignacio Justice Center Adult Detention 30 Chief Ignacio Justice Center Juvenile Detention 7 Southern Ute Police Department and Adult Detention Center 15 Idaho Shoshone Bannock Tribal Corrections 55 Michigan Sault Ste. Marie Tribal Youth Facility 6 Minnesota Red Lake Tribal Justice Center Adult Detention 43 Red Lake Tribal Justice Juvenile Detention 2 Mississippi Choctaw Justice Complex Adult Detentionc / Choctaw Justice Complex Juvenile Detention 10 Montana Blackfeet Adult Detention Center 17 Flathead Adult Detention Center 25 Fort Belknap Adult Detention Center 10 Fort Peck Indian Youth Service Center 11 Fort Peck Police Department and Adult Detention Center 51 Fort Peck Transitional Living Unit 0 Northern Cheyenne Adult Detention Center 15 Northern Cheyenne Youth Service Center 18 Rocky Boy Adult Detention Center 13 Nebraska Omaha Tribal Police Department and Adult Detention 35 Nevada Eastern Nevada Law Enforcement Adult Detention Facility 20 New Mexico Acoma Tribal Police and Holding Facility 12 Jicarilla Department of Corrections - Adult and Juvenilec / Laguna Detention Facility 34 Convictedb 1,380 1,156 Unconvicted 1,130 968 Not reported 0 386 0 1 0 7 14 0 7 30 3 7 5 34 0 3 13 4 32 64 29 6 146 / 0 / 10 28 2 0 107 16 13 5 17 14 3 63 9 19 51 12 4 29 / 1 / 0 0 0 0 0 0 0 0 0 0 0 0 0 0 0 0 0 0 / 0 / 29 7 10 1 0 5 0 0 0 18 37 0 4 2 0 26 0 17 2 0 0 / 9 / 1 / 0 6 18 8 6 48 0 7 7 13 11 7 2 5 3 0 8 11 0 0 0 0 0 0 0 0 0 0 32 3 0 18 2 0 1 / 26 11 / 8 0 / 0 Continued on next page J A I L S I N I N D I A N CO U N T R Y, 2015 | N O V E M B E R 2016 15 APPENDIX TABLE 3 (continued) Inmates in Indian country jails, by conviction status, midyear 2015 State and facility Inmates in custody New Mexico (continued) Navajo Department of Corrections - Crownpoint 34 Navajo Department of Corrections - Crownpoint Juvenile 2 Navajo Department of Corrections - Shiprock Police Department and Adult Detention 31 Ramah Navajo Police Department and Detention Center 2 Taos Tribal Police Department and Detention 3 Zuni Adult Detention Center 29 Zuni Juvenile Detention Center 1 North Dakota Fort Totten Law Enforcement and Adult Detention Center 28 Gerald Tex Fox Justice Center Adult Detention 21 Gerald Tex Fox Justice Center Juvenile Detention 11 Standing Rock Law Enforcement and Adult Detention Center 52 Turtle Mountain Law Enforcement Adult Detention 27 Oklahoma Sac and Fox Juvenile Detention Center 13 Oregon Warm Springs Police Department and Adult Detention Center 52 South Dakota Cheyenne River Sioux Adult Detention Center 49 Cheyenne River Sioux Juvenile Detention Center 2 Ki Yuksa O’Tipi Reintegration Centerc / Lower Brule Justice Center - Adult Detention 23 Medicine Root Detention Centerc / Oglala Sioux Tribal Offenders Facilityc / Rosebud Sioux Tribal Police Department and Adult Detention 81 Rosebud Sioux Wanbli Wiconi Tipi Juvenile Detention 15 Sisseton-Wahpeton Law Enforcement Adult Detention Center 17 Washington Chehalis Tribal Jail 23 Colville Tribal Correctional Facility 40 Makah Public Safety - Adult Detention 4 Nisqually Adult Corrections 228 Puyallup Tribal Law Enforcement and Adult Detention 7 Quinault Nation Police Department and Holding Facility 12 Wisconsin Menominee Tribal Detention Facility 36 Wyoming Wind River Adult Detention Center 44 Convictedb Unconvicted Not reported 10 2 8 2 3 20 1 24 0 23 0 0 9 0 0 0 0 0 0 0 0 28 13 10 46 15 0 8 1 6 12 0 0 0 0 0 6 7 0 34 18 0 0 0 / 6 / / 38 0 13 49 2 / 17 / / 43 15 4 0 0 / 0 / / 0 0 0 21 27 2 92 3 4 2 13 2 136 4 8 0 0 0 0 0 0 23 13 0 32 12 0 /Not reported. aDetail does not sum to total due to estimating data for survey nonresponse and rounding. bIncludes probation and parole violators with no new sentence. cDid not respond to the survey. Source: Bureau of Justice Statistics, Annual Survey of Jails in Indian Country, 2015. J A I L S I N I N D I A N CO U N T R Y, 2015 | N O V E M B E R 2016 16 Appendix Table 4 Adults and juveniles in the custody of Indian country jails, by sex, midyear 2015 State and facility Total estimateda Total reported Alaska Metlakatla Police Department and Adult Detention Center Arizona Ak-Chin Tribal Police and Detention Center Colorado River Indian Tribes Adult Detention Center Fort McDowell Police Department and Holding Facility Fort Mohave Tribal Police Department and Holding Facility Gila River Department of Rehabilitation and Supervision - Adult Gila River Department of Rehabilitation and Supervision - Juvenile Hualapai Adult Detention Center Hualapai Juvenile Detention and Rehabilitation Center Navajo Department of Corrections - Chinle Navajo Department of Corrections - Kayenta Police Department and Holding Facility Navajo Department of Corrections - Tuba City Navajo Department of Corrections - Window Rock Pascua Yaqui Police Department and Holding Facility Salt River Pima-Maricopa Department of Corrections San Carlos Department of Corrections and Rehabilitation - Adult Detention San Carlos Department of Corrections and Rehabilitation - Juvenile Detention Supai Law Enforcement and Holding Facility Tohono O’odham Adult Detention Center Tohono O’odham Juvenile Detention Centerc Tuba City Juvenile Detention Center White Mountain Apache Detention Centerc Colorado Chief Ignacio Justice Center Adult Detention Chief Ignacio Justice Center Juvenile Detention Southern Ute Police Department and Adult Detention Center Idaho Shoshone Bannock Tribal Corrections Michigan Sault Ste. Marie Tribal Youth Facility Minnesota Red Lake Tribal Justice Center Adult Detention Red Lake Tribal Justice Juvenile Detention Mississippi Choctaw Justice Complex Adult Detentionc Choctaw Justice Complex Juvenile Detention Female 570 472 Total 210 181 Juvenileb Male 140 119 0 1 0 0 0 0 16 42 2 7 137 0 20 0 51 14 6 76 11 47 115 0 9 175 / 0 / 14 42 1 7 112 0 13 0 50 11 6 69 8 36 96 0 8 140 / 0 / 2 0 1 0 25 0 7 0 1 3 0 7 3 11 19 0 1 35 / 0 / 1 0 0 0 0 19 0 10 0 0 0 0 2 4 0 41 1 0 / 1 / 1 0 0 0 0 16 0 6 0 0 0 0 2 3 0 25 0 0 / 1 / 0 0 0 0 0 3 0 4 0 0 0 0 0 1 0 16 1 0 / 0 / 0 0 0 0 0 0 0 0 0 0 0 0 0 0 0 0 0 0 / 0 / 30 7 15 30 0 15 22 0 10 8 0 5 0 7 0 0 5 0 0 2 0 0 0 0 55 52 32 20 3 2 1 0 6 0 0 0 6 6 0 0 43 2 43 0 33 0 10 0 0 2 0 2 0 0 0 0 / 10 / 0 / 0 / 0 / 10 / 8 / 2 / 0 Total 2,300 1,943 Adult Male 1,730 1,471 1 1 17 42 2 7 137 19 20 10 51 14 6 76 13 51 115 41 10 175 / 1 / Inmates in custody 2,510 2,124 Female 70 62 Not reported 0 386 Continued on next page J A I L S I N I N D I A N CO U N T R Y, 2015 | N O V E M B E R 2016 17 APPENDIX TABLE 4 (continued) Adults and juveniles in the custody of Indian country jails, by sex, midyear 2015 State and facility Montana Blackfeet Adult Detention Center Flathead Adult Detention Center Fort Belknap Adult Detention Center Fort Peck Indian Youth Service Center Fort Peck Police Department and Adult Detention Center Fort Peck Transitional Living Unit Northern Cheyenne Adult Detention Center Northern Cheyenne Youth Service Center Rocky Boy Adult Detention Center Nebraska Omaha Tribal Police Department and Adult Detention Nevada Eastern Nevada Law Enforcement Adult Detention Facility New Mexico Acoma Tribal Police and Holding Facility Jicarilla Department of Corrections - Adult and Juvenilec Laguna Detention Facility Navajo Department of Corrections - Crownpoint Navajo Department of Corrections - Crownpoint Juvenile Navajo Department of Corrections - Shiprock Police Department and Adult Detention Ramah Navajo Police Department and Detention Center Taos Tribal Police Department and Detention Zuni Adult Detention Center Zuni Juvenile Detention Center North Dakota Fort Totten Law Enforcement and Adult Detention Center Gerald Tex Fox Justice Center Adult Detention Gerald Tex Fox Justice Center Juvenile Detention Standing Rock Law Enforcement and Adult Detention Center Turtle Mountain Law Enforcement Adult Detention Oklahoma Sac and Fox Juvenile Detention Center Oregon Warm Springs Police Department and Adult Detention Center South Dakota Cheyenne River Sioux Adult Detention Center Cheyenne River Sioux Juvenile Detention Center Ki Yuksa O’Tipi Reintegration Centerc Lower Brule Justice Center - Adult Detention Medicine Root Detention Centerc J A I L S I N I N D I A N CO U N T R Y, 2015 | N O V E M B E R 2016 Female Total Juvenileb Male 11 17 7 0 34 0 7 0 10 6 8 3 0 17 0 8 0 3 0 0 0 11 0 0 0 18 0 0 0 0 5 0 0 0 9 0 0 0 0 6 0 0 0 9 0 0 0 0 0 0 0 0 0 0 35 27 8 0 0 0 0 20 20 11 9 0 0 0 0 12 / 34 34 2 31 2 3 29 1 12 / 33 34 0 31 2 3 29 0 11 / 28 33 0 25 2 3 26 0 1 / 5 1 0 6 0 0 3 0 0 / 1 0 2 0 0 0 0 1 0 / 1 0 1 0 0 0 0 1 0 / 0 0 1 0 0 0 0 0 0 / 0 0 0 0 0 0 0 0 28 21 11 52 27 28 21 0 52 27 16 13 0 32 17 12 8 0 20 10 0 0 11 0 0 0 0 5 0 0 0 0 6 0 0 0 0 0 0 0 13 0 0 0 13 10 3 0 52 52 37 15 0 0 0 0 49 2 / 23 / 49 0 / 23 / 30 0 / 12 / 19 0 / 11 / 0 2 / 0 / 0 2 / 0 / 0 0 / 0 / 0 0 / 0 / Total Adult Male 17 25 10 11 51 0 15 18 13 17 25 10 0 51 0 15 0 13 35 Inmates in custody Female Not reported Continued on next page 18 APPENDIX TABLE 4 (continued) Adults and juveniles in the custody of Indian country jails, by sex, midyear 2015 State and facility Oglala Sioux Tribal Offenders Facilityc Rosebud Sioux Tribal Police Department and Adult Detention Rosebud Sioux Wanbli Wiconi Tipi Juvenile Detention Sisseton-Wahpeton Law Enforcement Adult Detention Center Washington Chehalis Tribal Jail Colville Tribal Correctional Facility Makah Public Safety - Adult Detention Nisqually Adult Corrections Puyallup Tribal Law Enforcement and Adult Detention Quinault Nation Police Department and Holding Facility Wisconsin Menominee Tribal Detention Facility Wyoming Wind River Adult Detention Center Female / 24 0 7 Total / 0 15 0 Juvenileb Male / 0 8 0 15 28 3 158 2 10 8 12 1 70 5 2 0 0 0 0 0 0 0 0 0 0 0 0 0 0 0 0 0 0 0 0 0 0 0 0 36 33 3 0 0 0 0 44 36 8 0 0 0 0 Total / 81 0 17 Adult Male / 57 0 10 23 40 4 228 7 12 23 40 4 228 7 12 36 44 Inmates in custody / 81 15 17 Female / 0 7 0 Not reported / 0 0 0 /Not reported. aDetail does not sum to total due to estimating data for survey and item nonresponse and rounding. bPersons age 17 or younger. cDid not respond to the survey. Source: Bureau of Justice Statistics, Annual Survey of Jails in Indian Country, 2015. J A I L S I N I N D I A N CO U N T R Y, 2015 | N O V E M B E R 2016 19 Appendix Table 5 Reported inmate characteristics for table 5: Inmates confined in Indian country jails, by demographic characteristics, conviction status, and offense, midyear 2000 and 2010–2015 Characteristic In custody Sex Male Female Not reported Age group Adults Male Female Juveniles Male Female Not reported Conviction status Convicted Unconvicted Not reported Most serious offense Violent offense Domestic violence Aggravated/simple assault Rape/sexual assault Other violence Burglary Larceny-theft Public intoxication DWI/DUI Drug offense Other unspecified Not reported 2000 1,775 2010 2,119 2011 2,239 2012 2,364 2013 2,287 2014 2,380 2015 2,124 1,421 354 0 1,639 480 0 1,743 496 0 1,831 526 7 1,699 551 37 1,631 528 221 1,590 534 0 1,498 1,214 284 277 207 70 0 1,866 1,479 387 253 160 93 0 2,002 1,583 419 237 160 77 0 2,109 1,660 449 248 171 77 7 2,060 1,581 479 190 118 72 37 2,000 1,527 473 159 104 55 221 1,943 1,471 472 181 119 62 0 1,072 689 14 1,240 879 0 1,247 928 64 1,279 993 92 1,243 964 80 998 1,025 357 1,156 968 386 … … … … … … … … 274 133 … 154 651 276 226 39 110 … … … 218 95 1,144 11 646 262 254 36 94 … … … 231 116 1,175 71 692 314 188 36 154 … … … 219 115 1,108 230 697 332 216 44 105 36 30 368 178 93 780 105 553 226 185 40 102 40 20 321 198 122 723 403 678 285 214 36 143 44 28 259 162 134 810 395 Note: Detail information is based on reported data and may not sum to total due to incomplete data. See table 5 for estimated inmate characteristics. …Not collected. Source: Bureau of Justice Statistics, Annual Survey of Jails in Indian Country, 2000 and 2010–2015. Appendix Table 6 Reported number of staff for table 6: Persons employed in Indian country jails, by job function, midyear 2010 and 2013–2015 Job function Total Administrative Jail operations Educational staff Technical/professional Clerical/maintenance/food service Other unspecified functions 2010 1,469 157 1,010 27 56 186 33 2013 1,642 150 1,106 28 93 212 53 2014 1,511 122 1,077 25 77 189 21 2015 1,539 154 1,069 29 60 189 38 Note: Data are based on all 75 facilities in 2010, 73 out of 79 facilities in 2013, 71 out of 79 facilities in 2014, and 68 out of 76 facilities in 2015. Source: Bureau of Justice Statistics, Annual Survey of Jails in Indian Country, 2010 and 2013–2015. J A I L S I N I N D I A N CO U N T R Y, 2015 | N O V E M B E R 2016 20 The Bureau of Justice Statistics of the U.S. Department of Justice is the principal federal agency responsible for measuring crime, criminal victimization, criminal offenders, victims of crime, correlates of crime, and the operation of criminal and civil justice systems at the federal, state, tribal, and local levels. BJS collects, analyzes, and disseminates reliable and valid statistics on crime and justice systems in the United States, supports improvements to state and local criminal justice information systems, and participates with national and international organizations to develop and recommend national standards for justice statistics. Jeri M. Mulrow is acting director. This report was written by Todd D. Minton. Danielle Kaeble and Laura Maruschak verified the report. Caitlin Scoville and Jill Thomas edited the report. Barbara Quinn and Tina Dorsey produced the report. November 2016, NCJ 250117 NCJ250117 Office of Justice Programs Innovation • Partnerships • Safer Neighborhoods www.ojp.usdoj.gov