
Justice Assistance Grant (JAG) Program Technical Report BJS 2014
Download original document:
Document text
Document text
This text is machine-read, and may contain errors. Check the original document to verify accuracy.
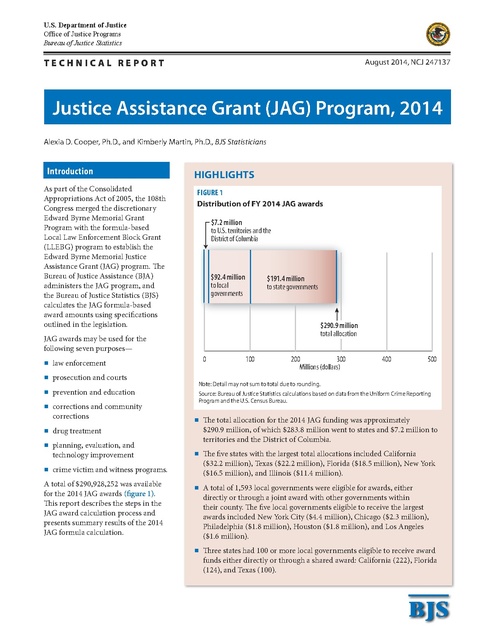
U.S. Department of Justice Office of Justice Programs Bureau of Justice Statistics TECHNICAL REPORT August 2014, NCJ 247137 Justice Assistance Grant (JAG) Program, 2014 Alexia D. Cooper, Ph.D., and Kimberly Martin, Ph.D., BJS Statisticians Introduction As part of the Consolidated Appropriations Act of 2005, the 108th Congress merged the discretionary Edward Byrne Memorial Grant Program with the formula-based Local Law Enforcement Block Grant (LLEBG) program to establish the Edward Byrne Memorial Justice Assistance Grant (JAG) program. The Bureau of Justice Assistance (BJA) administers the JAG program, and the Bureau of Justice Statistics (BJS) calculates the JAG formula-based award amounts using specifications outlined in the legislation. HIGHLIGHTS FIGURE 1 Distribution of FY 2014 JAG awards $7.2 million to U.S. territories and the District of Columbia $92.4 million to local governments $191.4 million to state governments $290.9 million total allocation JAG awards may be used for the following seven purposes— law enforcement prosecution and courts prevention and education corrections and community corrections drug treatment planning, evaluation, and technology improvement crime victim and witness programs. A total of $290,928,252 was available for the 2014 JAG awards (figure 1). This report describes the steps in the JAG award calculation process and presents summary results of the 2014 JAG formula calculation. 0 100 200 300 Millions (dollars) 400 500 Note: Detail may not sum to total due to rounding. Source: Bureau of Justice Statistics calculations based on data from the Uniform Crime Reporting Program and the U.S. Census Bureau. The total allocation for the 2014 JAG funding was approximately $290.9 million, of which $283.8 million went to states and $7.2 million to territories and the District of Columbia. The five states with the largest total allocations included California ($32.2 million), Texas ($22.2 million), Florida ($18.5 million), New York ($16.5 million), and Illinois ($11.4 million). A total of 1,593 local governments were eligible for awards, either directly or through a joint award with other governments within their county. The five local governments eligible to receive the largest awards included New York City ($4.4 million), Chicago ($2.3 million), Philadelphia ($1.8 million), Houston ($1.8 million), and Los Angeles ($1.6 million). Three states had 100 or more local governments eligible to receive award funds either directly or through a shared award: California (222), Florida (124), and Texas (100). BJS Overview of process Once the fiscal year JAG allocation has been determined, BJS begins its fourstep award calculation process: Computing an initial allocation for each state and territory, based on its share of the nation’s violent crime and population (weighted equally). Reviewing the initial allocation amount to determine if it is less than the minimum (de minimus) award amount defined in the JAG legislation (0.25% of the total). If this is the case, the state or territory is funded at the minimum level, and the funds required for this are deducted from the overall pool of funds. Each of the remaining states receives the minimum award plus an additional amount based on its share of violent crime and population. Dividing each state’s final amount at a rate of 60% for state governments and 40% for local governments. Determining local award allocations, which are based on a jurisdiction’s proportion of the state’s 3-year violent crime average. If a local jurisdiction’s calculated award is less than $10,000, the funds are returned to the state to distribute. If the calculated local award is $10,000 or more, then the local government is eligible to apply for an award. The JAG award calculation process, with examples, is explained in more detail below. The four-step award calculation process Step 1: Initial allocation to states and territories [Legislative mandate: 42 USC § 3755 (a)(1)] Based on the congressional appropriation for the 2014 JAG program, BJS calculates the initial allocation amounts for the 50 states and U.S. territories. Using the congressionally established formula, BJS allocates half of the available funds based on a state’s or territory’s share of the nation’s violent crime and half of the funds based on its share of the nation’s population. The most recent 3-year period of official violent crime data for states and territories from the FBI covered the period between 2010 and 2012. The population shares for the 50 states, the District of Columbia, and U.S. territories were determined based on the results of the 2013 midyear population estimates published by the U.S. Census Bureau. Examples— California accounts for 12.96% of the nation’s total violent crime and 11.97% of the nation’s total population. Therefore, California’s initial allocation equals 12.96% of $145,464,126 (half of $290,928,252) plus 11.97% of $145,464,126, totaling $36,277,474. Vermont accounts for 0.07% of the nation’s total violent crime and 0.20% of the nation’s total population. Vermont’s initial allocation is 0.07% of $145,464,126 plus 0.20% of $145,464,126, totaling $388,388. Congress has made one exception to this rule: American Samoa and the Northern Mariana Islands are required to split one minimum award, with American Samoa receiving 67% ($487,305) and the Northern Mariana Islands receiving 33% ($240,016). (See Methodology for more information on allocation procedures for the territories.) In 2014, four states (North Dakota, South Dakota, Vermont, and Wyoming) and four U.S. territories (American Samoa, Guam, Northern Mariana Islands, and the Virgin Islands) received only the minimum award as their total JAG allocation. The remainder of the states, the District of Columbia, and Puerto Rico were all awarded the minimum award plus an additional allocation. A total of $40,002,635 was allocated for minimum awards under the 2014 JAG program. Examples— Vermont’s initial allocation of $388,388 is less than the minimum value, so Vermont’s total JAG allocation is the minimum amount of $727,321. California’s initial allocation of $36,277,474 exceeds the minimum value, so California receives the minimum plus an award based on its share of total violent crime and population. Step 2: De minimus awards [Legislative mandate: 42 USC § 3755 (a)(2)] The JAG legislation requires that each state or territory be awarded a minimum allocation equal to 0.25% of the total JAG allocation ($727,321 in 2014), regardless of its population or crime average. If a state or territory’s initial allocation based on crime and population is less than the minimum amount, that state or territory receives the minimum award amount as its total JAG allocation. If a state or territory’s initial allocation exceeds the minimum amount, it receives the minimum award plus the amount based on its share of the violent crime and population. To compute the additional amounts, the crime and population data for states and territories receiving only the minimum award are removed from the pool, and the remaining JAG funds are reallocated to the rest of the states based on violent crime and population as in Step 1. Examples— Vermont receives only the J U S T I C E A S S I S TA N C E G R A N T ( J AG ) P R O G R A M , 2014 | AU G U S T 2014 minimum award, so its crime and population data are removed from the pool. 2 After removing the crime and population data for the states and U.S. territories receiving only the minimum award, California accounts for 13.03% of violent crime and 12.09% of the nation’s population. California’s new JAG allocation is equal to $16,345,555 (13.03% of half of $250.9 million) plus $15,172,921 (12.09% of half of $250.9 million), plus the minimum amount of $727,321. These three components equal $32,245,797. ($250.9 million equals the original $290.9 million total JAG 2014 award allocation minus the $40.0 million JAG 2014 minimum allocation.) Step 3: 60%/40% split to state and local governments [Legislative mandate: 42 USC § 3755 (b)] Except for the U.S. territories and the District of Columbia, 60% of the total allocation to a state is retained by the state government, and 40% is set aside to be allocated to local governments. Examples— California’s state government retains 60% of $32,245,797, or $19,347,478. The remaining 40%, or $12,898,319, is set aside for distribution to local governments in California. Vermont’s state government retains 60% of the minimum award of $727,321, or $436,392. The remaining 40%, or $290,928, is set aside for distribution to local governments in Vermont. Step 4: Determining local award allocations [Legislative mandate: 42 USC § 3755 (c)(d)(e)(f)(g)(h)] In order to determine local awards, BJS determines which jurisdictions should be included in the calculation of the 3-year violent crime averages on which local awards are based. These crime averages are computed using data reported to the FBI’s Uniform Crime Reporting (UCR) Program. To be eligible, a jurisdiction must have provided to the UCR a count of the number of Part I violent crimes known to law enforcement each year for a minimum of 3 years in the last 10 years. Jurisdictions that have not met the reporting requirements are excluded from the calculations and are not eligible to receive an award. The 10-year limit on the age of UCR data used for JAG local award calculations was applied for the first time during the 2009 Recovery Act.1 For the 2010 JAG, the 10-year window for eligible UCR data was waived because some agencies were having difficulty meeting the new requirements. Instead, all of the FBI’s UCR data dating back to 1991 were used to meet the 3-year reporting requirement. Agencies that used this waiver signed an agreement indicating they would begin to report timely data on Part I violent crimes to the FBI starting no later than the end of FY 2010 (September 30, 2010). All agencies that used the waiver in 2010 reported updated UCR data by the required deadline, making it unnecessary to authorize any further waivers of the 10-year rule. The 10year limit was applied for the first time in FY 2012 and has been in effect for each year since then. After determining which law enforcement agencies have the 3 years of reported violent crime data required to be included in the calculations, BJS computes the average number of violent crimes reported by all law enforcement agencies in each jurisdiction (e.g., local government) for the 3 most recent years in which they reported data. Since awards to local governments are based on their share of all violent crimes reported by the 1Before 2009, all years of the FBI’s UCR data could be used to meet the 3-year reporting requirement. Although the 10-year limit was stipulated in the 2005 legislation that created the JAG program, it was not implemented until 2009 per the “Transitional Rule.” See 42 USC § 3755 (d)(2)(B). law enforcement agencies in their state, BJS computes the sum of these averages within each state to determine the jurisdiction’s share of the total local award allocation. Examples— California has $12.9 million set aside for local awards. The 3-year violent crime averages reported by local jurisdictions in California equal 157,358 crimes. Dividing the $12.9 million set aside by the state crime total results in the number of dollars available for each crime: $12,898,319 divided by 157,358 crimes equals $81.97 per crime. Therefore, a local California jurisdiction needs a 3-year violent crime average of at least 122.00 violent crimes ($10,000 divided by $81.97) to be eligible for a direct award. Vermont has $290,928 set aside for local governments. The sum of 3-year average violent crimes reported is 639.7. The dollars per crime ratio in Vermont equals $290,928 divided by 639.7 crimes, or $454.81 per crime (after rounding). The threshold is 21.99 violent crimes ($10,000 divided by $454.81) to be eligible for a direct award. BJS then calculates the initial amount of each local award. Each local award amount is equal to the product of a local jurisdiction’s 3-year violent crime average and the “dollars per crime” ratio for the state in which it is located. By statute, the minimum award a local jurisdiction may receive is $10,000. Jurisdictions that are eligible for an initial award greater than or equal to $10,000 are eligible to apply to receive the funds for their own use. If the initial award is less than $10,000, the award funds are transferred to the state administering agency for distribution to the state police or any units of local government that were ineligible for a direct award greater than or equal to $10,000. (See “Pass-through requirement” [42 USC § 3755 (c)]). J U S T I C E A S S I S TA N C E G R A N T ( J AG ) P R O G R A M , 2014 | AU G U S T 2014 3 TABLE 1 State and local allocation amounts, FY 2014 Initial allocations State Total Alabama Alaska Arizona Arkansas California Colorado Connecticut Delaware Florida Georgia Hawaii Idaho Illinois Indiana Iowa Kansas Kentucky Louisiana Maine Maryland Massachusetts Michigan Minnesota Mississippi Missouri Montana Nebraska Nevada New Hampshire New Jersey New Mexico New York North Carolina North Dakota Ohio Oklahoma Oregon Pennsylvania Rhode Island South Carolina South Dakota Tennessee Texas Utah Vermont Virginia Washington West Virginia Wisconsin Wyoming State government $170,256,556 2,814,775 884,044 3,673,779 2,012,022 19,347,478 2,677,424 1,906,070 978,492 11,092,015 5,126,789 982,290 1,023,249 6,868,140 3,329,133 1,664,495 1,757,933 2,109,956 3,036,232 851,764 3,652,174 3,781,380 5,592,674 2,484,903 1,632,924 3,536,635 845,514 1,178,019 2,123,530 904,941 4,184,115 1,661,251 9,875,410 4,870,744 436,392 5,352,520 2,440,123 1,961,118 6,275,367 848,466 3,250,111 436,392 4,417,682 13,346,370 1,479,771 436,392 3,394,452 3,352,169 1,223,127 2,709,417 436,392 Local governments $113,504,370 1,876,516 589,362 2,449,186 1,341,348 12,898,319 1,784,950 1,270,714 652,328 7,394,676 3,417,860 654,860 682,166 4,578,760 2,219,422 1,109,663 1,171,955 1,406,638 2,024,155 567,843 2,434,783 2,520,920 3,728,450 1,656,602 1,088,616 2,357,757 563,676 785,346 1,415,687 603,294 2,789,410 1,107,501 6,583,607 3,247,163 290,928 3,568,346 1,626,749 1,307,412 4,183,578 565,644 2,166,741 290,928 2,945,122 8,897,580 986,514 290,928 2,262,968 2,234,779 815,418 1,806,278 290,928 Dollars per crime ~ $99.20 171.63 92.16 95.50 81.97 110.37 131.09 186.10 75.92 93.57 188.07 206.11 85.90 109.05 142.48 114.66 154.32 86.22 384.20 85.80 90.41 83.98 130.95 159.60 87.35 204.03 164.79 85.94 269.77 106.67 95.76 86.67 97.33 175.93 106.27 91.53 137.44 100.69 216.17 79.19 134.73 74.57 82.76 169.56 454.81 140.89 109.62 203.38 121.98 249.22 Threshold ~ 100.81 58.27 108.51 104.71 122.00 90.61 76.29 53.74 131.71 106.87 53.17 48.52 116.41 91.70 70.18 87.21 64.80 115.98 26.03 116.55 110.61 119.08 76.37 62.66 114.48 49.01 60.68 116.36 37.07 93.75 104.43 115.38 102.75 56.84 94.10 109.26 72.76 99.31 46.26 126.28 74.22 134.10 120.83 58.98 21.99 70.98 91.22 49.17 81.98 40.12 Eligible local awards Reallocated Number Amount to state 1,593 $92,387,002 $21,117,369 30 1,232,966 643,550 6 516,993 72,369 31 2,173,695 275,491 29 975,396 365,952 222 11,810,798 1,087,521 29 1,563,704 221,246 17 1,088,767 181,947 8 584,589 67,739 124 6,729,876 664,800 62 2,622,147 795,713 4 654,860 0 15 470,350 211,816 49 3,749,812 828,948 26 1,831,676 387,746 18 731,748 377,915 19 838,405 333,550 16 1,070,127 336,511 34 1,549,733 474,422 14 326,439 241,404 22 2,257,944 176,839 40 1,984,104 536,816 56 3,072,985 655,465 17 1,066,426 590,176 27 713,190 375,426 24 1,637,079 720,678 15 354,948 208,728 4 615,061 170,285 8 1,348,510 67,177 9 343,325 259,969 47 2,114,397 675,013 20 887,476 220,025 29 6,021,967 561,640 62 2,444,009 803,154 8 202,026 88,902 31 2,805,496 762,850 17 1,195,967 430,782 18 957,343 350,069 35 3,056,961 1,126,617 10 492,289 73,355 51 1,748,740 418,001 4 183,009 107,919 36 2,263,394 681,728 100 7,478,688 1,418,892 14 738,161 248,353 9 180,562 110,366 34 1,821,288 441,680 41 1,795,598 439,181 24 592,243 223,175 20 1,339,543 466,735 8 152,192 138,736 Total state Total government award allocation $191,373,924 $283,760,926 3,458,325 4,691,291 956,413 1,473,406 3,949,270 6,122,965 2,377,974 3,353,370 20,434,999 32,245,797 2,898,670 4,462,374 2,088,017 3,176,784 1,046,230 1,630,819 11,756,815 18,486,691 5,922,502 8,544,649 982,290 1,637,149 1,235,066 1,705,416 7,697,089 11,446,901 3,716,878 5,548,554 2,042,410 2,774,158 2,091,483 2,929,888 2,446,467 3,516,594 3,510,654 5,060,387 1,093,168 1,419,607 3,829,013 6,086,957 4,318,196 6,302,300 6,248,139 9,321,124 3,075,078 4,141,504 2,008,350 2,721,540 4,257,312 5,894,391 1,054,241 1,409,189 1,348,304 1,963,365 2,190,707 3,539,217 1,164,909 1,508,234 4,859,128 6,973,525 1,881,275 2,768,751 10,437,049 16,459,016 5,673,898 8,117,907 525,295 727,321 6,115,370 8,920,866 2,870,905 4,066,872 2,311,186 3,268,529 7,401,984 10,458,945 921,820 1,414,109 3,668,112 5,416,852 544,312 727,321 5,099,410 7,362,804 14,765,262 22,243,950 1,728,125 2,466,286 546,759 727,321 3,836,132 5,657,420 3,791,351 5,586,949 1,446,302 2,038,545 3,176,152 4,515,695 575,129 727,321 Note: Detail may not sum to total due to rounding. ~Not applicable. Source: Bureau of Justice Statistics, state calculations based on data from the Uniform Crime Reporting (UCR) Program, 2010–2012, and U.S. Census Bureau, 2013; and local calculations based on data from the UCR Program, 2003–2012. Examples— The city of Los Angeles, California, has a 3-year average of 20,025.33 violent crimes, or 12.7% of all violent crimes reported by potentially eligible jurisdictions in California. Los Angeles exceeds the state threshold of 122.00 violent crimes. It is eligible for 12.7% of the $12.9 million set aside for local governments in California, or about $1,641,440 (20,025.33 multiplied by $81.97). The city of Vergennes, Vermont, has a 3-year average of 4.00 violent crimes. This does not meet the state threshold of 21.99, so it is ineligible for a direct JAG award. Its crimes, less than 1% of all violent crimes in Vermont, account for about $1,819 of award funds. These funds are transferred to the state for redistribution. Results of the calculations for the 2014 Justice Assistance Grant Program For the 2014 JAG awards, approximately $283.8 million of the $290.9 million available was allocated to the 50 states, with the remainder allocated to the District of Columbia and U.S. territories (table 1). As required by the legislation, 40% of this amount ($113.5 million) was initially reserved for local governments. A total of 1,593 local governments had law enforcement agencies that provided a sufficient number of reported crimes to the FBI to receive a JAG award—either directly or through a joint award with other governments within their county—and were eligible for a collective total of $92.4 million. The balance of unawarded local allocations ($21.1 million) was returned to state governments for redistribution to state law enforcement agencies and local governments. Three states had 100 or more local governments eligible to receive award funds either directly or through a shared award: California (222), Florida (124), and Texas (100). The five local governments eligible to receive the largest awards included New York City ($4.4 million), Chicago ($2.3 million), Philadelphia ($1.8 million), Houston ($1.8 million), and Los Angeles ($1.6 million). In addition, the District of Columbia was eligible for $1.8 million and Puerto Rico was eligible for $3.2 million (table 2). Guam and the U.S. Virgin Islands were each eligible for the minimum award of $727,321. American Samoa ($487,305) and the Northern Mariana Islands ($240,016) split one minimum award. Additional JAG provisions Disparate jurisdictions and joint allocations [Legislative mandate: 42 USC § 3755 (d)(3)(4)] In some cases, as defined by the legislation, a disparity may exist between the funding eligibility of a county and associated municipalities. Three different types of disparities may exist. TABLE 2 Allocations to U.S. territories and the District of Columbia, FY 2014 Total American Samoa Northern Mariana Islands Guam Puerto Rico Virgin Islands District of Columbia Award amount $7,167,326 487,305 240,016 727,321 3,207,973 727,321 1,777,391 Note: Detail may not sum to total due to rounding. Source: Bureau of Justice Statistics, based on data from the Uniform Crime Reporting Program, 2010–2012, and the U.S. Census Bureau, 2013. A second type of disparity exists when both a county and a municipality within that county qualify for a direct award, yet the award amount for the municipality exceeds 150% of the county’s award amount. Example— Bibb County, Georgia, is eligible for a direct award of $20,460. The city of Macon in Bibb County is eligible for a direct award of $57,794. Macon’s award amount is more than 150% of Bibb County’s award amount. Consequently, the two governments’ awards ($78,254) are pooled together and shared as mutually agreed upon. The first type is a zero-county disparity. This situation exists when one or more municipalities within a county are eligible for a direct award and the county is not, yet the county is responsible for providing criminal justice services (such as prosecution and incarceration) for the municipality. In this case, the county is entitled to part of the municipality’s award because it shares in the cost of criminal justice operations, although it may not report crime data to the FBI. This is the most common type of disparity. The third type of disparity occurs when a county and multiple municipalities within that county are all eligible for direct awards, but the sum of the awards for the individual municipalities exceeds 400% of the county’s award amount. Example— Example— Decatur, Illinois, is eligible for an San Mateo County, California, award of $37,653. Macon County, Illinois (which includes the city of Decatur), is not eligible for a direct award, but it provides criminal justice services to Decatur. In this case, Macon County and Decatur are considered zero-county disparate. Decatur must share its award funds with Macon County as mutually agreed upon. J U S T I C E A S S I S TA N C E G R A N T ( J AG ) P R O G R A M , 2014 | AU G U S T 2014 is eligible for a direct award of $20,301. The cities of Daly ($17,760), Redwood ($15,273), San Mateo ($21,831), South San Francisco ($10,956), and East Palo Alto ($23,689) are also eligible for direct awards. The five cities’ awards sum to $89,509. This amount is more than 400% of San Mateo County’s direct award amount of $20,301. Consequently, the 5 funds from all of the jurisdictions ($109,810) are pooled together and shared among the six governments as mutually agreed upon. These three types of disparity are examined in order. If a municipality is found to be disparate in one of these three ways, its award is not included in calculations to test other disparity situations. For instance, if a municipality is found to be 150% disparate with the county, its award is set aside, and the rest of the municipalities within the same county are checked for 400% disparity. If no other disparity is found, the single municipality and county share the sum of their two awards. However, it is possible for a county to have both a 150% disparity and a 400% disparity simultaneously. For instance, counties can have one or more municipalities whose individual awards are more than 150% of the county’s award and other municipalities whose combined award is more than 400% of the county’s award. Centennial ($17,622), and Aurora ($158,522), are also eligible for awards. The award amount for the city of Aurora is more than 150% of the award amount for Arapahoe County. This jurisdiction is disparate with the county, and the two jurisdictions will share the combined total of $182,876. The remaining cites of Englewood and Centennial are individually less than 150% of the award amount for Arapahoe County, and the two awards combined are less than 400% of the County’s award. Accordingly, the awards for these two cities remain separate. Examples— For disparate situations, regardless of the type, the total of all award funds of the separate units of local governments (counties and municipalities) are pooled together and split among the units of local government as agreed upon by the affected jurisdictions. To qualify for payment, the disparate units of local government must submit a joint application for the aggregated funds. Maricopa County, Arizona, is Pass-through requirement eligible for an award of $85,768. The cities of Avondale ($20,828), Chandler ($61,439), Glendale ($98,977), Goodyear ($10,598), Mesa ($166,836), Peoria ($27,002), Phoenix ($784,816), Scottsdale ($33,238), Tempe ($75,078), Surprise (12,257), and Gilbert ($18,278) (all located in Maricopa County) are also eligible for awards. The awards for Mesa ($166,836) and Phoenix ($784,816) are both individually more than 150% of Maricopa County’s award, so they will be pooled together with the county’s award. The other nine cities’ awards sum to $357,695. This summed amount is more than 400% of Maricopa County’s direct award of $85,768. As a result, the funds for all twelve jurisdictions ($1,395,115) are pooled together and must be shared. Arapahoe County, Colorado, is eligible for an award of $24,354. The cities of Englewood ($10,080), [Legislative mandate: 42 USC § 3755] According to the JAG legislation, states may only retain award amounts that bear the same ratio of “(A) total expenditures on criminal justice by the state government in the most recently completed fiscal year to (B) the total expenditure on criminal justice by the state government and units of local government within the state in such year.” The determination of proportionate criminal justice spending by state and local governments is referred to as the variable pass-through (VPT) process under JAG. The VPT process identifies the amounts each state must pass down to local governments within the state. During 2013, the U.S. Census Bureau finished compiling current criminal justice expenditure information from FY 2010 to calculate updated VPT amounts. Several sources of data were used to calculate the percentages, including initial expenditure data from the 2010 Annual Survey of State and Local Government Finances conducted by the U.S. Census Bureau (http://www.census.gov//govs/local/ historical_data_2010.html) and federal justice grant data from the Federal Award Assistance Data System (http:// www.census.gov/govs/www/faads. html). Source data were assigned to state and local governments. Intergovernmental expenditures and grants were removed from the total justice expenditure for the appropriate type of government. The resulting expenditure data were then used to calculate the VPT percentages by comparing the total justice expenditures of all local governments in a state to the expenditures of the state government itself. A simple percentage resulted, which represented the combined local government expenditures within the state divided by the total state criminal justice expenditures. These updated VPT percentages were used for the 2014 JAG program and can be found on the BJA website at https://www.bja.gov/. Sex Offender Registration and Notification Act (SORNA) penalty and compliant bonus funds [Legislative mandate: 42 USC § 16925 (a)(c)] Penalty The Sex Offender Registration and Notification Act (SORNA), Title I of the Adam Walsh Child Protection and Safety Act of 2006 required that the 50 states, the District of Columbia, the five principal U.S. territories, and some federally recognized tribes substantially implement SORNA by July 27, 2009. Two full-year deadline extensions were provided, and a final statutory deadline of July 27, 2011, was established. SORNA mandated a 10% reduction in JAG funding for any jurisdictions that failed to substantially implement SORNA by the deadline. For those jurisdictions that fail to meet this deadline, the SORNA penalty is J U S T I C E A S S I S TA N C E G R A N T ( J AG ) P R O G R A M , 2014 | AU G U S T 2014 6 calculated by subtracting 10% from the state government’s allocation (60% of the total award), after deducting the mandatory VPT that states are required to send to local governments. The penalty applies to the portion of JAG funding that is returned to the state to be shared with local governments that were not eligible for a direct JAG award (less than $10,000 jurisdictions). The penalty does not apply to the VPT, which is the portion of JAG funds awarded directly to local law enforcement, as the state cannot retain any portion of that award. Penalizing local agencies would also seriously undermine the purpose of the statute, since doing so would be detrimental to local law enforcement efforts, including the investigation, prosecution, and apprehension of sex offenders. An example of how the SORNA penalty was assessed can be found in the BJA’s JAG Frequently Asked Questions on the BJA website at https://www.bja.gov/Funding/ JAGFAQ.pdf. In FY 2014, a total of 36 states and U.S. territories were not compliant with SORNA’s requirements. As a result, these jurisdictions suffered a combined $6,474,445 reduction to their FY 2014 Byrne JAG award. These jurisdictions were allowed to apply to reallocate the 10% penalty to promote SORNA implementation. Seven states were SORNA noncompliant and did not apply to reallocate the penalty. Per the SORNA legislation, the $1,137,459 withheld from these jurisdictions will be reallocated to jurisdictions that did substantially implement SORNA [(42 USC § 16925 (c)]. These funds will be reallocated to compliant states in the FY 2015 JAG award as described below. Bonus funds from FY 2013 Per 42 USC § 16925(c), any state or territory that has substantially implemented SORNA during the current fiscal year, as determined by the SMART Office, will be eligible to receive compliant bonus funds in addition to its JAG award for the following year. This bonus allocation is calculated based on SORNA penalty funds from nonimplementing states and territories during the current fiscal year. For example, any state that substantially implemented SORNA in FY 2013 would have bonus funds added to its FY 2014 state JAG award, comprised of SORNA penalty funds from nonimplementing states and territories in FY 2013. The amounts available for compliant bonus funds will vary from year to year, depending on the amount of SORNA penalty funds from the previous year. Bonus funds are allocated using the same general approach as the overall JAG award allocation calculations. First, an initial allocation is calculated for each eligible state and territory, based on its share of violent crime and population (weighted equally). Next, this initial allocation is reviewed to determine if it is less than the minimum award amount (defined as 0.25% of the total funds available). If this is the case, the state or territory is allocated 0.25% of the total funds available, and the funds required for this are deducted from the overall pool of funds. These states and territories are then removed from the calculations. Each of the remaining states receives the minimum award plus an additional amount based on its share of violent crime and population for the remaining states and territories. For FY 2014, a total of $1,107,438 was available from the FY 2013 SORNA reductions from the noncompliant states. These funds were distributed to the 19 states and territories that substantially implemented SORNA during the fiscal year. Of the 19 states eligible for bonus funds, Florida ($229,588) and Pennsylvania ($126,577) received the largest awards (table 3). Of the eligible U.S. territories, Guam received $2,769, the Northern Mariana Islands received $914, and the U.S. Virgin Islands received $2,769. (For additional information regarding the SORNA penalty and bonus funds, including implementation requirements and a list of states and territories that were impacted in TABLE 3 Sex Offender Registration and Notification Act bonus fund allocations, FY 2014 Total Alabama Delaware Florida Guam* Kansas Louisiana Maryland Michigan Mississippi Missouri Nevada Northern Mariana Islands* Ohio Pennsylvania South Carolina South Dakota Tennessee Virgin Islands* Wyoming Bonus award amount $1,107,438 52,188 14,119 229,588 2,769 30,980 58,659 71,268 111,839 28,520 68,069 37,904 914 108,330 126,577 61,632 9,660 84,365 2,769 7,288 Note: Detail may not sum to total due to rounding. *U.S. territory. Source: Bureau of Justice Statistics, based on data from Justice Assistance Grant awards, 2013. FY 2014, contact the Office of Sex Offender Sentencing, Monitoring, Apprehending, Registering, and Tracking (SMART) Policy Advisor assigned to assist the jurisdiction of interest: http://www.ojp.usdoj.gov/ smart/sorna.htm.) Prison Rape Elimination Act (PREA) certification reduction and bonus funds [Legislative mandate: 42 USC § 15607 (e)] Reduction The PREA statute provides that a state whose governor does not certify full compliance with the DOJ National Standards to Prevent, Detect, and Respond to Prison Rape, 42 U.S.C. 15607(e), is subject to the loss of 5% of any DOJ grant funds that it would otherwise receive for prison purposes, unless the governor submits to the Attorney General an assurance that J U S T I C E A S S I S TA N C E G R A N T ( J AG ) P R O G R A M , 2014 | AU G U S T 2014 7 such 5% will be used only to enable the state to adopt and achieve full compliance with the National PREA Standards in future years. For those without a certification of full compliance, the PREA reduction was calculated by subtracting 5% from the state government’s allocation (60% of the total award), after deducting the VPT that states are required to send to local governments. The reduction applies to the portion of JAG funding returned to the state to be shared with local governments that were not eligible for a direct JAG award (less than $10,000 jurisdictions). The reduction does not apply to the VPT, which is the portion of JAG funds awarded directly to local law enforcement, as the state cannot retain any portion of that award. An example of how the PREA reduction was assessed can be found in the BJA’s JAG Program Frequently Asked Questions regarding the PREA certification requirement and 5% reduction FAQ located on the BJA website at https://www.bja.gov/ Programs/JAG-PREA-FAQ.pdf. For FY 2014, a total of 54 states and U.S. territories were not compliant with PREA requirements (New Jersey and New Hampshire were fully certified). As a result, these jurisdictions suffered a combined $4,653,215 reduction to their FY 2014 Byrne JAG award. These jurisdictions were allowed to apply to reallocate the 5% reduction to achieve compliance with PREA standards and become certified. A total of seven states and U.S. territories were PREA noncompliant and did not apply to reallocate the reduction. Per the PREA legislation, the $753,573 withheld from these jurisdictions were reallocated to jurisdictions that either were certified or were working to achieve certification. These funds were allocated to compliant states and territories as described below. Bonus funds PREA bonus funds are allocated using the same general approach as the overall JAG award allocation calculations. First, an initial allocation is calculated for each eligible state and territory, based on its share of violent crime and population (weighted equally). Next, the initial allocation is reviewed to determine if it is less than the minimum award amount (0.25% of the total funds available). If this is the case, the state or territory is allocated 0.25% of the total funds available, and the funds required for this are deducted from the overall pool of funds. These states and territories are then removed from the calculations. Each of the remaining states receives the minimum award plus an additional amount based on its share of violent crime and population for the remaining states and territories. For the FY 2014 JAG awards, a total of $753,573 was available from PREA reductions from the seven noncompliant states and territories. These funds were distributed to the 44 states, 4 territories, and the District of Columbia that were PREA certified or were working to become certified. Of the 44 states eligible for bonus funds, California ($106,610) and New York ($54,143) received the largest awards (table 4). Of the eligible U.S. territories, Puerto Rico ($10,112) received the largest bonus award. (For additional information regarding the PREA reduction and bonus funds, including implementation requirements and a list of states and U.S. territories that were impacted in FY 2014, contact the PREA Management Office at PREACompliance@usdoj.gov.) Maximum allocation to local units of government [Legislative mandate: 42 USC § 3755 (e)(1)] According to the legislation, units of local government may not receive a JAG award that “exceeds such unit’s total expenditures on criminal justice services for the most recently completed fiscal year for which data are available.” Award amounts in excess of total expenditures “shall be allocated proportionately among units of local government whose allocations do not exceed their total expenditures on such services.” TABLE 4 Prison Rape Elimination Act bonus fund allocations, FY 2014 Total Alabama Alaska American Samoa* Arkansas California Colorado Connecticut Delaware District of Columbia* Georgia Guam* Hawaii Illinois Iowa Kansas Kentucky Louisiana Maine Maryland Massachusetts Michigan Minnesota Mississippi Missouri Montana Nebraska Nevada New Hampshire New Jersey New Mexico New York North Carolina North Dakota Ohio Oklahoma Oregon Pennsylvania Puerto Rico* Rhode Island South Carolina South Dakota Tennessee Vermont Virgin Islands* Virginia Washington West Virginia Wisconsin Wyoming Bonus award amount $753,573 15,055 4,367 1,262 10,615 106,610 14,276 10,008 4,890 5,389 27,847 1,884 4,900 37,506 8,670 9,197 11,127 16,297 4,172 19,707 20,410 30,452 13,197 8,496 19,058 4,145 5,982 11,243 4,469 22,606 8,677 54,143 26,419 1,884 29,069 12,985 10,307 34,196 10,112 4,161 17,489 3,782 23,970 1,884 1,884 18,209 18,005 6,234 14,444 1,884 Note: Detail may not sum to total due to rounding. *U.S. territory or the District of Columbia. Source: Bureau of Justice Statistics, based on data from Justice Assistance Grant awards, 2014. J U S T I C E A S S I S TA N C E G R A N T ( J AG ) P R O G R A M , 2014 | AU G U S T 2014 8 Methodology The population data used to calculate state and U.S. territory Justice Assistance Grant (JAG) allocations are from the 2013 census estimates provided to the Bureau of Justice Statistics (BJS) by the U.S. Census Bureau. The state-level violent crime data are estimates published by the FBI’s Uniform Crime Reporting (UCR) Program in the annual publication, Crime in the United States. For the 2014 JAG program, state-level crime data for the years 2010 through 2012 were used. The crime data used to calculate local JAG allocation amounts are also provided by the UCR program. Data for local jurisdictions are obtained in an electronic format directly from the FBI and processed by BJS to link each crime-reporting entity to a local government. For the 2014 JAG, local crime data from 2003 through 2012 were used. The sum of the UCR violent crimes for all local governments within a state for a given year will not equal the estimated crime total reported for that state published by the FBI. These state-level estimates are based on crimes reported by all state, local, and special district law enforcement agencies within a state, plus an imputation adjustment to account for nonreporting agencies and agencies reporting less than 12 months of data. These imputed values do not appear on the electronic data file provided to BJS and are not used in the local award calculations. awards. However, as of 2014, the local-level UCR data provided by the FBI did not include any crime data for local jurisdictions in Puerto Rico. Therefore, the local government JAG program allocation in Puerto Rico was $0. Allocations to U.S. territories The Edward Byrne Memorial Justice Assistance Grant (JAG ) Program was established to streamline justice funding and grant administration. Administered by the Bureau of Justice Assistance (BJA), the JAG program allows states, tribes, and local governments to support a broad range of activities to prevent and control crime based on local needs and conditions. JAG consolidates the previous Byrne Formula and Local Law Enforcement Block Grant (LLEBG) Programs. More information about the JAG program and application process can be found on the BJA website at http://www.bja.gov. Puerto Rico was the only U.S. territory to receive an initial allocation larger than the minimum amount, and it was also the only territory for which violent crime data were available. The JAG calculations for the other territories were based solely on population data. Because the other territories have relatively small populations (none exceeding 161,000), it is unlikely the inclusion of crime data would have changed their minimum status. The current JAG legislation specifies that 40% of the total allocation for Puerto Rico be set aside for local Sources of additional information For more information on the legal foundation of the allocation formula, see 42 USC § 3754 and 42 USC § 3755. J U S T I C E A S S I S TA N C E G R A N T ( J AG ) P R O G R A M , 2014 | AU G U S T 2014 9 The Bureau of Justice Statistics of the U.S. Department of Justice is the principal federal agency responsible for measuring crime, criminal victimization, criminal offenders, victims of crime, correlates of crime, and the operation of criminal and civil justice systems at the federal, state, tribal, and local levels. BJS collects, analyzes, and disseminates reliable and valid statistics on crime and justice systems in the United States, supports improvements to state and local criminal justice information systems, and participates with national and international organizations to develop and recommend national standards for justice statistics. William J. Sabol is acting director. This technical report was prepared by Alexia D. Cooper and Kimberly Martin. Christina Davis verified the report. Vanessa Curto and Jill Thomas edited the report. Tina Dorsey produced the report. August 2014, NCJ 247137 Office of Justice Programs Innovation • Partnerships • Safer Neighborhoods www.ojp.usdoj.gov