
The Justice Institute - Innocence Database Exoneration Report, 2016
Download original document:
Document text
Document text
This text is machine-read, and may contain errors. Check the original document to verify accuracy.
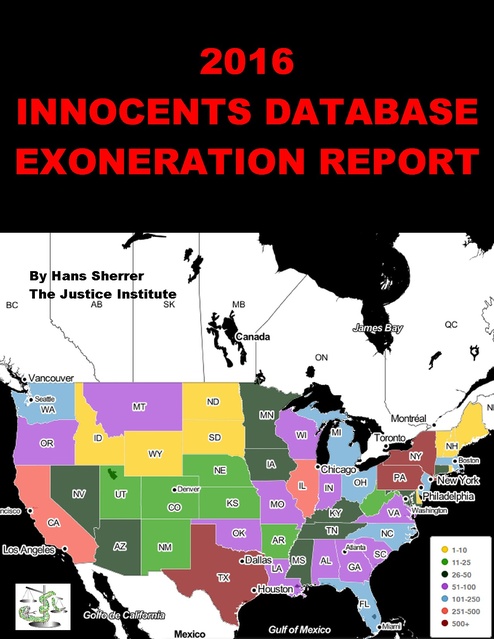
2016 INNOCENTS DATABASE EXONERATION REPORT By Hans Sherrer The Justice Institute 2016 Innocents Database Exoneration Report Copyright © 2017 by Hans Sherrer Permission is granted to publish content in this report with the sole proviso that credit for the source must be given. Permission is granted to print this report for non-commercial use. Published by: The Justice Institute PO Box 66291 Seattle, WA 98166 Website: http://justicedenied.org Email: contact@justicedenied.org March 20, 2017 Trade Paperback ISBN: 154480430X Trade Paperback ISBN-13: 978-1544804309 The map of the United States on the cover uses colors for each state to represent the total number of known exonerations for each state through 2016. The map was created with Carto.com. The Justice Institute’s logo that represents the snake of evil and injustice climbing up to tilt the scales of justice, is in the lower left-hand corner of the cover. Table of Contents Introduction.................................................................................................................................................................. 1 Observations ................................................................................................................................................................ 3 Longest Time From Conviction To Judicial Exoneration ........................................................................................... 5 Longest Time From Conviction To Executive Exoneration........................................................................................ 6 Longest Time From Commission Of Crime To Conviction........................................................................................ 7 Table 1 Known Exonerations By Year (U.S. & Int.) ............................................................................................ 9 Chart 1 Exonerations By Year............................................................................................................................... 9 Table 2 Number of Exonerated People By State................................................................................................. 10 Map 1 U.S. Map of Total Exonerations for each State....................................................................................... 11 Table 3 Number of Exonerated People By Jurisdiction (U.S.) ........................................................................... 11 Table 4 Number of Exonerated People By Sex/Type (U.S.)............................................................................... 11 Table 5 Number of Exonerated People By Type of Crime (U.S.)....................................................................... 12 Chart 2 Percentage of Exonerations by type of Crime (U.S.) ............................................................................. 12 Table 6 Number of Exonerated People by Race/Ethnicity (U.S.) ....................................................................... 12 Table 7 Number of Exonerated People By Primary Types of Exculpatory Evidence (U.S.).............................. 13 Table 8 Number of Exonerated People By Conviction Method (U.S.)............................................................... 13 Table 9 Number of Exonerated People Convicted After More Than One Trial (U.S.)....................................... 13 Table 10 Number of State Prisoners Exonerated After Federal Habeas Granted (U.S.)..................................... 13 Table 11 Number of Exonerated People Convicted By Primary Types of Prosecution Evidence (U.S)............... 14 Table 12 Number of Exonerated People By Method of Exoneration (U.S.)....................................................... 14 Table 13 Number of Exonerated Persons Involved In A Case With A Co-Defendant (U.S.) ............................ 14 Table 14 Number of Exonerations Involving DNA Evidence By Year .............................................................. 15 Chart 3 Exonerations Relying On DNA Evidence in the U.S. and Internationally............................................ 15 Chart 4 Percentage of Exonerations based on DNA evidence – 1989-2006 (U.S.) ........................................... 16 Table 15 Number of Exonerated People Aided By Conviction Integrity Unit (U.S.) ........................................... 16 Table 16 Number of Exonerated People By Years In Custody (U.S.) ................................................................ 16 Table 17 Average Years Exonerated Person Was In Custody Before Release (All types of cases) ................... 17 Table 18 Avg Years Exonerated Person Was In Custody Before Release (Homicide or Sexual Assault only) ....... 17 Table 19 Avg Years Exonerated Person Was In Custody Before Release (Non-Homicide or Sexual Assault only) .. 17 Chart 5 Average Years in Custody Before Exoneration (U.S.)............................................................................... 17 Table 20 Number of Exonerated People By County (12 or more) (U.S.) ........................................................... 18 Table 21 Number of Exonerated People By Country – International Cases Only .............................................. 19 Table 22 Number of Exonerated People By Type of Crime (International) ....................................................... 21 Table 23 Number of Exonerated People By Method of Exoneration (International) .......................................... 21 Table 24 Number of Exonerated Persons Involved In A Case With A Co-Defendant (International) ............... 21 Map 2 World Map of Total Exonerations for each Country............................................................................... 22 Federal Court Is The Death Zone For Innocent State Prisoners ................................................................................ 23 A question, correction, or suggestion regarding the Innocents Database can be emailed to: innocents@justicedenied.org Introduction T his is the second yearly report of information recorded in the Innocents Database through the last calendar year – 2016.1 The Innocents Database is an ongoing independent non-profit project begun in February 1997 that records every documentable exoneration in the United States and every other country.2 The Innocents Database is online at www.justicedenied.org/exonerations.htm, and it can be accessed from Justice Denied’s website at www.justicedenied.org. This Report is compiled from information available in the database online.3 The database includes 8,131 cases concluded through December 31, 2016: 5,224 U.S. cases and 2,907 international cases. Since the Innocents Database was founded there has been a continuing increase in the reporting of cases in accessible digital form. That has resulted in more cases being included for recent years. However, that doesn’t mean more people are exonerated today than ten, twenty, or even forty years ago. It does means it is easier to find a larger number of recent exoneration cases. For example, Table 1 lists 484 U.S. cases and 462 international cases for 2016, and 84 U.S. cases and 97 international cases for 2005. There may have been a comparable number of exonerations in 2005 as 2016 – but finding and identifying contemporary cases is less challenging than 2005 cases, much less cases in 1995 or 1975. Nevertheless, the 5,224 U.S. cases listed in the database through 2016 – 4,313 cases from 1989 to 2016 and 911 cases prior to 1989 – provide data that can be useful to make general observations and identify possible trends. 1989 is used as a quasi demarcation because the first DNA exoneration in the U.S. was in 1989. Internationally the first exoneration was in Canada in 1992. The Report includes 24 tables of data. Most of the 24 tables include information about U.S. cases for both the years 1989 to 2016, and pre-1989, and several include information about international cases. Those tables are: • • • • • • • • • • • • • • • • • • Table 1. Known Exonerations By Year (U.S. & Int.) Table 2. Number of Exonerated People By State Table 3. Number of Exonerated People By Jurisdiction (U.S.) Table 4. Number of Exonerated People By Sex/Type (U.S.) Table 5. Number of Exonerated People By Type of Crime (U.S.) Table 6. Number of Exonerated People by Race/Ethnicity (U.S.) Table 7. Number of Exonerated People By Primary Types of Exculpatory Evidence (U.S.) Table 8. Number of Exonerated People By Conviction Method (U.S.) Table 9. Number of Exonerated People Convicted After More Than One Trial (U.S.) Table 10. Number of State Prisoners Exonerated After Federal Habeas Granted (U.S.) Table 11. Number of Exonerated People Convicted By Primary Types of Prosecution Evidence (U.S.) Table 12. Number of Exonerated People By Method of Exoneration (U.S.) Table 13. Number of Exonerated Persons Involved In A Case With A Co-Defendant (U.S.) Table 14. Number of Exonerations Involving DNA Evidence By Year (U.S. & Int.) Table 15. Number of Exonerated People Aided By Conviction Integrity Unit (U.S.) Table 16. Number of Exonerated People By Years In Custody (U.S.) Table 17. Average Years Exonerated Person Was In Custody Before Release (U.S. & Int.) Table 18. Average Years Exonerated Person Was In Custody Before Release (Homicide or Sexual Assault 1 This report includes cases that were concluded through December 31, 2016, and which were added to the database up to March 7, 2017. For an explanation of cases considered an exoneration for inclusion in the Innocents Database, see, Hans Sherrer, “An Exoneration Can Be Judicial Or By Executive Or Legislative Clemency,” Justice Denied, Issue 59 (Spring 2015), available online at, http://justicedenied.org/wordpress/archives/2811. Summarized, an exoneration is when a convicted living or deceased person’s presumption of innocence is restored by judicial, executive, or legislative action, or their conviction is recognized as a miscarriage of justice by either legislative or executive action based on evidence of their innocence. 2 The Innocents Database was created and is maintained by Hans Sherrer, president of the Justice Institute, and publisher and editor of Justice Denied: the magazine for the wrongly convicted. 3 The Innocents Database contains millions of bits of data. The database can be sorted and searched on over 100 fields online at, http://forejustice.org/exonerations.htm . 1 • • • • • • only) (U.S. & Int.) Table 19. Average Years Exonerated Person Was In Custody Before Release (Non-Homicide or Sexual Assault only) (U.S. & Int.) Table 20. Number of Exonerated People By County (12 or more) (U.S.) Table 21. Number of Exonerated People By Country – International Cases Table 22. Number of Exonerated People By Type of Crime (International) Table 23. Number of Exonerated People By Method of Exoneration (International) Table 24. Number of Exonerated Persons Involved In A Case With A Co-Defendant (International) 2 Observations T he following are observations regarding known exonerations in the United States in 2016. The data underlying these observations is in the tables in this report and the Innocents Database. In 2016, there was an exoneration in all but nine states: Alabama; Alaska; Hawaii; Kentucky; New Hampshire; New Mexico; Rhode Island; South Dakota; and Vermont. In 2016, eight states had 10 or more exonerations: Pennsylvania (150); Texas (134); New York (33); Illinois (19); Oregon (16); California (12); Virginia (12); and, Ohio (10). Five counties had ten or more exonerations in 2016: Philadelphia County, Pennsylvania (146); Harris County, Texas (80); Cook County, Illinois (13); Cuyahoga County, Ohio (10); and, Deschutes County, Oregon (10).4 Four cities had ten or more exonerations in 2016: Philadelphia (146); Houston (22); New York City (17); Chicago (13). In 2016, 92% of exonerations were of men, and 8% were of women. That was consistent with the historical average of 91% men and 9% women. In 2016, 74% of exonerations involved a case in which no crime was committed. In 2016, 26% of exonerations were by way of an acquittal, by either a court reviewing the person’s conviction or after a retrial. The remaining exonerations were by way of the dismissal of charges. That is consistent with the historical average of 22% of exonerations in the U.S. by way of an acquittal. In 2016, 8% of exonerated people had one or more co-defendants also wrongly convicted. That was less than half the historical average of 18% of exonerations involving two or more co-defendants. In 2016, 53% of exonerations were of a drug related conviction; 18% were of a non-violent related conviction; 14% were of a homicide related conviction; and 7% were of sexual assault/abuse related conviction. In 2016, no one was posthumously exonerated. In 2016, 77% of exonerated persons spent less than a year in custody, or were sentenced to probation or a fine; 23% spent a year or more in custody; 11% spent 10 years or more in custody; 7% spent 20 years or more in custody; and one person spent more than 30 years in custody. That was Keith Allen Harward, convicted of the 1982 murder of the husband of a rape victim in Virginia, and who was released after more than 33 years in custody. In 2016, 64% of exonerated people were convicted by a guilty or no-contest plea, 29% by a jury, and 7% after a bench (judge only) trial. In 2016, 96% of exonerations were of a person convicted in state court, and 4% in federal court. In 2016, 2.5% of exonerations involved a false confession by the exonerated person or a co-defendant. That is less than half the average for the ten years from 2007 to 2016 when more than 5% of exonerations involved a false confession, and less than one-third the historical average of 8%. The average of 17 years spent in custody by people exonerated in 2016 of a homicide or sexual assault related crime was seven times the average of 2½ years spent in custody by an exonerated person who was convicted of any other type of crime. Other than the six women exonerated in 2016 of a homicide related crime, the women who were incarcerated for all other types of crimes spent an average of less than nine months in custody. In 2016, 3.5% of U.S. exonerations were primarily based on new DNA evidence. Although they get a lot of press coverage, DNA exonerations are uncommon. They accounted for less than 3% of exonerations from 2013 to 2016, and since the first DNA exoneration in 1989, 8.3% of exonerations in the U.S. – 1 out of 12 – were primarily based on DNA evidence. 4 The only known exonerations in Deschutes County were the ten in 2016, so it isn’t listed in Table 20 that only includes counties with 12 or more total exonerations. 3 Conviction integrity units in ten jurisdictions aided in the exoneration of 118 people in 2016. There were 79 in Harris County (Houston) Texas; eight in Cook County, Illinois; seven each in Bexar County, Texas and Cuyahoga County, Ohio; and 17 in six other counties. The 173 exonerations aided by the Harris County CIU from 2014 to 2016 are due to laboratory testing for the first time of evidence in drug cases that turned out not to be an illegal substance, or retroactive application of rulings in two cases in which the Texas Court of Criminal Appeals ruled the Texas statute relied on for the convictions was unconstitutional.5 In contrast with the Harris County CIU acting as a pass-through for testing conducted by a crime lab and new court rulings, the 21 exonerations by the Kings County, New York CRU are attributable to serious reinvestigation of those cases by CRU personnel after District Attorney Kenneth Thompson took office in January 2014.6 In 2016, six state prisoners were exonerated after their federal habeas corpus petition was granted. That is comparable with the average of about four per year since enactment of the Anti-terrorism and Effective Death Penalty Act of 1996.7 The difficulty of a state prisoner to prevail in federal court is emphasized by the small number of exonerations contrasted with the thousands of state prisoner habeas petitions filed annually in U.S. District Courts.8 That puts to rest the folklore a state prisoner can expect to get a fairer shake in federal court than their state’s courts. See page 23 of this report for the mini-report, Federal Court Is The Death Zone For Innocent State Prisoners. In the U.S. there are over a million felony convictions yearly in state courts, and more than 125,000 convictions in federal courts, so even given only a 2% wrongful conviction rate – and there are estimates the actual rate is 10% or more – there would be more than 22,000 wrongful convictions per year.9 So the 484 cases in the database for 2016 are little more than 2% of that number. What is unknown – and for the foreseeable future it will remain unknown – is exactly how many innocent people have had their wrongful conviction(s) overturned. Also unknown is the infinitely larger number of innocent people – possibly totaling over a million – who have not, and never will have their wrongful conviction(s) overturned: those people will forever be officially branded as a criminal for a crime committed by another person, or that may not have even occurred. Thus, the known exonerations are a miniscule representation of the actual number of wrongly convicted persons. The inadequacy of current data regarding wrongful convictions is illustrated by the fact that even though far more Caucasians are convicted than any other “racial” group, 50% of the exonerations in 2016 were identified as being Blacks. From 2012 to 2016 46% of known exonerations were of a Black man or woman. he following are observations regarding known exonerations in countries other than the United States in 2016. The data underlying these observations is in the tables in this report and the Innocents Database. In 2016, there was an identifiable exoneration in 41 countries. That is comparable to the 39 countries with a known exoneration in 2015. In 2016, eight countries had 10 or more exonerations: Turkey (275); India (32); United Kingdom (England) (25); Malawi (19); Australia (14); and, China (11). In 2016, 91% of exonerations were of men, and 9% were of women. That was consistent with the historical average of 88% men and 12% women. In 2016, 22% of exonerations involved a case in which no crime was committed. T 5 The two statutes involved online solicitation of a minor, and photographing people in public without consent. DA Thompson died of cancer at the age of 50 on October 9, 2016. It is unknown at this time if his predecessor will support the CRU as a mechanism to ferret out unreliable convictions, or revert to the approach of Thompson’s predecessor Charles Hynes., that the CRU was effectively only a public relations prop. 7 Also known as AEDPA, Pub. L. No. 104-132, 110 Stat. 1214. Signed into law by President Clinton on April 24, 1996. 8 See, Judicial Facts and Figures 2015, Table 4.6. “U.S. District Courts – Prisoner Petition Filed, by Nature of Suit,” USCourts.gov. Available online at, http://www.uscourts.gov/file/19692/download. (Last visited March 15, 2017) 2015 is the most recent year that the statistics are available. 9 850,365 defendants were convicted in federal court during the six years 2010 to 2015 – an average of 141,727 per year. See, U.S. Attorneys’ Statistical Reports available online at, http://www.justice.gov/usao/resources/annual-statistical-reports (Last visited March 15, 2017). There were 1,132,290 felony convictions in state courts in 2006, the latest year for which the data is available from the Bureau of Justice Statistics. See, Sean Rosenmerkel, Matthew Durose and Donald Farole, Jr., Ph.D.; “Felony Sentences in State Courts, 2006 – Statistical Tables,” Bureau of Justice Statistics, December 2009, NCJ 226846. Available online at, http://www.bjs.gov/content/pub/pdf/fssc06st.pdf (Last viewed March 15, 2017). 6 4 In 2016, 96% of exonerations were by way of an acquittal, by either a court reviewing the person’s conviction or after a retrial. The remaining exonerations were by way of the dismissal of charges. That was higher than the historical average of 78% of exonerations outside the U.S. by way of an acquittal. In 2016, 17% of exonerated people had co-defendants also wrongly convicted. That was about half the historical average of 33% of exonerations involving two or more co-defendants. In 2016, 9% of exonerations were of a homicide related conviction, 4% were of sexual assault/abuse related conviction, 5% were of a fraud related conviction, 63% were of a violence related conviction other than homicide, rape, assault, robbery, etc., and 13% were of a non-violent related conviction. Less than 1% of exonerations were of a drug related conviction, contrasted with 53% in the U.S. in 2016. In 2016, there were two posthumous exonerations internationally. In 2016, seven people were exonerated after more than 20 years of imprisonment. The longest was the more than 23 years of imprisonment by Chen Man, who was convicted of a murder and arson in China he didn’t commit. Four of the other seven people who served more than 20 years were also convicted in China, and the other two were convicted in Japan. The average of 9 years spent in custody by people exonerated in 2016 of a homicide or sexual assault related crime was six times the average of 1½ years spent in custody by an exonerated person who was convicted of any other type of crime. In 2016, Kengo Iwamoto in Japan was the only person whose exoneration was primarily based on new DNA evidence. There have been a total of 39 DNA exonerations outside the U.S. since Canadian David Milgaard was cleared of murder and rape in 1992. Twelve of those exonerations were in Canada, 10 in the United Kingdom (England), three in Indonesia, three in New Zealand, three in Japan, and eight in seven other countries. he following are three notable U.S. 2016 exoneration cases: the longest time from conviction to a judicial exoneration; the longest time from conviction to an executive (pardon) exoneration; and the longest time from an exonerated person’s conviction and the commission of the crime. T Longest Time From Conviction To Judicial Exoneration 52 years Paul Gatling Convicted in 1964. Exonerated in 2016 Kings County, New York P aul Gatling was convicted in 1964 of the shooting murder of Lawrence Rothbort on the night of October 15, 1963 during an attempted robbery in his Brooklyn, New York home. Rothbort’s wife Marlene told police a man entered their apartment and demanded money, and shot her husband when he refused to give him any money. She gave the police a description of the assailant. Gatling, a decorated Korean War veteran, was questioned after the police were told he had been seen in the area of the apartment building. There was no physical or forensic evidence linking Gatling to the shooting. He was charged with first-degree murder based on his identification by the victim’s wife, after she had first failed to identify him in a four person line-up. The 29-year-old Gatling proclaimed his innocence and pled not guilty during his arraignment. However, during his trial the visibly pregnant Marlene pointed to him as the man who shot her husband. Facing a possible death sentence if he was convicted by the jury, Gatling’s trial abruptly ended when he accepted the prosecution’s offer to plead guilty to second-degree murder in exchange for a prison sentence. Gatling had buyer’s remorse about his guilty plea, but his motion to withdraw it was denied. In October 1964 he was sentenced to 30 years to life in prison. Legal Aid Society lawyer Malvina Nathanson took an interest in Gatling’s case because of his insistence he was innocent. Her investigation led her to believe he was in fact innocent. In 1973 she submitted a clemency 5 application on Gatling’s behalf to New York Governor Nelson Rockefeller. In one of his last acts before leaving office on December 18, 1973, Rockefeller commuted Gatling’s sentence. Gatling was released in January 1974 after more than ten years in custody. In January 2014 new Kings County District Attorney Kenneth Thompson took office. Gatling read that Thompson was planning to reinvigorate the DA Office’s Conviction Review Unit that had been created in 2011 by Thompson’s predecessor, DA Charles J. Hynes. However, under Hynes it had not contributed to the overturning of a single conviction. Gatling contacted Nathanson. Although they had not been in contact for decades, she had kept her file about Gatling’s case. She sent it to him, and he provided it to Eric Sonnenschein, one of ten assistant district attorneys that Thompson had assigned to the CRU. The CRU initiated an investigation of Gatling’s case. The investigation discovered that Gatling was not provided with a lawyer prior to being interrogated about the crime, and that prior to Gatling’s guilty plea his lawyer had not been provided with favorable evidence known to the DA, as was required by the U.S. Supreme Court in Brady v. Maryland (1963). The non-disclosed evidence included: immediately after the crime Marlene Rothbort described the assailant as younger than Gatling; the Rothbort’s neighbors told the police the couple often had violent arguments — sometimes during the night; that Marlene told detectives she was having an affair with a musician, Leon Tolbert, who was living as a boarder in the Rothbort’s home; and, that when Tolbert was interviewed he told the police he had recently heard Marlene threaten to kill her husband if he ever hit her again. The CRU’s report determined that Gatling’s conviction was a miscarriage of justice, and recommended that the DA’s Office support the withdrawal of Gatling’s guilty plea and the setting aside of his conviction. DA Thompson agreed with the recommendation. The DA’s Office filed a motion for withdrawal of Gatling’s guilty plea and to set-aside his conviction. On May 2, 2016 Brooklyn Supreme Court Justice Dineen Riviezzo granted the DA’s motion, and also granted the DA’s motion to dismiss the charge against the 81-year-old Gatling. Thompson told reporters: “Paul Gatling repeatedly proclaimed his innocence even as he faced the death penalty back in the 60s. He was pressured to plead guilty and, sadly, did not receive a fair trial.”10 After the hearing that cleared him almost 52 years after his conviction, Gatling told reporters that Marlene Rothborts’ testimony doomed him: “The cops told me they would make sure I was convicted and the lawyers said they were going to execute me. I was a young black man. With the white, pregnant wife in front of an all-white jury pointing me out, it was over.”11 Longest Time From Conviction To Executive Exoneration 24 years Earnest Leap Convicted in 1992. Exonerated in 2016 Jackson County, Missouri I n 1989 Earnest Leap was 31 and living in Jackson County, Missouri. He had primary custody of his two sons, five-year-old Brodie and his toddler brother Josh, that he had with his ex-wife Karen. Leap and Karen were divorced in September 1989. She was displeased he was granted primary custody of their sons, which meant they spent more time with Leap than with her. Although there had never been any allegation by anyone that Leap had abused Brodie, on December 1, 1989 Karen quizzed Brodie, “Have you been 10 “Man, 81, who served 10 years for 1960s New York murder he did not commit is finally cleared of his crime,” By Mia De Graff, Daily Mail, May 2, 2016. Online at, http://www.dailymail.co.uk/news/article-3570129/Man-81-served-10-years-1960s-New-York-murder-didnot-commit-finally-cleared-crime.html . 11 “Man Convicted of Brooklyn Murder Exonerated After 52 Years,” by Dan Slepian and Corky Siemaszko, NBCNews.com, May 2, 2016. Online at, http://www.nbcnews.com/news/us-news/man-convicted-brooklyn-murder-exonerated-after-52-years-n566076 . 6 touched down there?”12 Brodie said “No.” She kept asking him again and again, and he finally told her “Yes.” Based on Brodie’s statement Karen went to the police and asserted that Leap had fondled his son’s genitals. Leap was charged with criminal sexual assault. After insisting on his innocence for three years, to avoid Brodie having to testify at a trial, he took his lawyer’s advice to agree to an Alford plea in exchange for probation. Under the deal Leap’s conviction would be expunged after three years of good behavior. At the time Missouri did not have a sex offender registration law. In 1994 a federal law was enacted creating a public sex offender registry in each state. So a year before he expected to have his conviction erased, Leap was required to register – and be publicly identified – as a child sex offender. Eighteen years after accusing his dad of sexually touching him, Brodie recanted his claim in 2007. He asserted in an Affidavit that his mother pressured him into falsely accusing his father because she was angry he had been granted primary custody of him and his younger brother. In 2015, the 57-year-old Leap retired as a driver for United Parcel Service. Brodie, who was a Navy veteran, moved in with his dad to help with his mission of being granted a pardon and clearing his name. In an October 2015 interview with The Kansas City Star, Brodie said about his false accusation, “I live with the guilt of that lie every day of my life.” Brodie’s brother Josh said about his dad, “The only stable component of my childhood was the immutable presence of my father.”13 Missouri State Representative Jim Neely saw the story in The Kansas City Star, and became an advocate for Leap. In May 2016 Neely delivered a letter to Missouri Governor Jay Nixon in support of a pardon for Leap, which was signed by more than a third of Missouri House representatives. On August 19, 2016 Governor Nixon signed Leap’s pardon. Nixon stated: “The executive power to grant clemency is one I take with a great deal of consideration and seriousness. … the information that has come to light more recently and the fact that he has been a law-abiding and productive member of society were compelling enough for me to grant a pardon.”14 Longest Time From Commission Of Crime To Conviction 55 years Jack McCullough Crime occurred in 1957. Convicted in 2012. Exonerated in 2016 DeKalb County, Illinois J ack McCullough was 72 when he was convicted on September 12, 2012 of the cold-case abduction of 7year-old Maria Ridulph in Sycamore, Illinois on the evening of December 3, 1957 and her murder. Ridulph’s body was found five months later in 1958. At the time of Ridulph’s murder McCullough was 18 and living in Sycamore. McCullough was questioned by police, and he told them that on the evening of Ridulph’s disappearance he was in Rockford, Illinois. Rockford is 42 miles from Sycamore. Fifty-four years later, in 2011, McCullough was living in Washington state when he was charged with Ridulph’s murder. He was extradited to Illinois. McCullough’s prosecution was based on circumstantial evidence that included alleged admissions he had made that suggested he was involved – but he did not confess and adamantly denied he abducted and killed Ridulph. McCullough waived his right to a jury trial. After McCullough’s conviction by Kane County Associate Judge 12 “‘Lie’ begets lifetime of regret for Clay County father, son,” By Eric Adler, The Kansas City Star, October 24, 2015. Online at, http://www.kansascity.com/news/local/article41364675.html . 13 Id. 14 “Decades after ‘lie’ puts dad on sex offender registry, he’s pardoned,” By Eric Adler, The Kansas City Star, August 19, 2016. Online at, http://www.kansascity.com/news/local/article96788667.html . 7 James Hallock following a bench trial, he was sentenced to life in prison. DeKalb County State’s Attorney Richard Schmack took office in 2013. McCullough was in the process of appealing his conviction. McCullough initially opposed McCullough’s direct appeal. However, Schmack began having doubts when he reviewed the case, including police reports from 1957 and ’58 that Judge Hallock had excluded from consideration as evidence during McCullough’s trial. Schmack reopened McCullough’s case, and the investigation discovered the new evidence of phone records that corroborated McCullough’s alibi that at the exact time Maria Ridulph was abducted in Sycamore, he was 42 miles away in Rockford. Based on the reinvestigation, Schmack publicly proclaimed that McCullough was factually innocent and had been wrongly convicted. On April 15, 2015 DeKalb County Judge William Brady granted a motion by the DeKalb County State’s Attorney’s Office to vacate McCullough’s conviction. The motion was based on evidence of McCullough’s actual innocence not considered by Judge Hallock in finding him guilty. Judge Brady ordered McCullough’s release on bond, and two hours later he was released from the DeKalb County Jail. On April 22, 2016 Judge Brady granted a motion by the State's Attorney’s Office to dismiss the murder charge against McCullough. 8 Table 1 Known Exonerations By Year (U.S. & Int.) USA Posthumous International Posthumous 2016 Year 484 0 462 2 2015 721 4 211 2 2014 351 4 208 1 2013 206 4 189 0 2012 149 0 142 2 2011 131 2 161 1 2010 333 0 96 0 2009 158 3 155 3 2008 135 0 163 0 2007 142 28 172 8 2006 175 80 114 3 2005 84 0 97 1 2004 93 0 139 0 2003 127 2 74 3 2002 92 1 50 2 2001 106 1 50 0 2000 257 2 33 0 1999 62 0 27 0 1998 49 0 34 4 1997 57 0 15 1996 60 1 8 0 0 1995 85 0 19 0 1994 44 0 10 0 1993 46 0 10 0 1992 43 0 18 0 1991 50 0 12 0 1990 39 0 5 0 1989 34 1 13 0 1989-2016 total 4313 133 2687 32 <1989 total 911 27 220 34 Total 5224 160 2907 66 Chart 1 Exonerations By Year 9 Table 2 Number of Exonerated People By State State/Territory 2016 2015 2014 2013 2012 2011 2010 2009 2008 2007 Alabama Alaska Arizona Arkansas California Colorado Connecticut Delaware Dist. of Columbia Florida Georgia Guam Hawaii Idaho Illinois Indiana Iowa Kansas Kentucky Louisiana Maine Maryland Massachusetts Michigan Minnesota Mississippi Missouri Montana Nebraska Nevada New Hampshire New Jersey New Mexico New York North Carolina North Dakota Ohio Oklahoma Oregon Pennsylvania Puerto Rico Rhode Island South Carolina South Dakota Tennessee Texas Utah Vermont Virgin Islands Virginia Washington West Virginia Wisconsin Wyoming U.S. Military Totals 0 0 1 2 12 3 1 1 1 4 4 0 0 3 19 4 4 5 0 3 1 2 4 4 3 1 2 3 1 5 0 6 0 33 9 1 10 5 16 150 3 0 1 0 4 134 1 0 0 12 2 1 2 1 0 484 5 6 1 3 8 2 6 5 2 12 4 2 0 0 23 6 8 3 1 3 1 1 4 2 4 1 2 2 2 3 2 6 1 39 21 0 6 2 2 403 0 0 1 1 6 74 1 1 0 11 9 0 9 0 4 721 1 1 1 1 13 4 0 0 3 4 0 0 2 0 17 0 4 2 2 3 1 3 2 18 1 0 2 1 1 1 1 5 4 34 5 0 10 3 4 112 0 1 2 0 3 61 3 0 0 3 3 2 5 1 1 351 3 0 1 1 9 0 10 0 1 3 6 1 1 0 16 1 2 1 0 1 0 2 4 7 2 0 5 0 0 0 1 2 1 21 2 0 2 1 1 54 0 0 3 0 2 12 0 2 0 5 12 0 4 2 2 206 2 1 4 0 13 1 1 0 5 3 1 0 0 1 14 4 2 0 1 2 0 1 6 7 0 0 1 0 0 0 0 1 0 29 6 0 2 3 3 2 1 1 1 0 2 16 1 0 0 3 4 0 1 1 2 149 2 0 0 1 12 2 0 0 1 1 1 0 1 0 12 0 2 1 1 4 1 1 3 1 2 3 2 0 0 1 1 0 0 15 3 1 7 2 2 6 0 2 1 0 2 18 1 0 0 4 2 0 1 1 0 131 0 0 3 2 7 2 1 0 0 5 1 0 0 0 5 1 0 0 1 4 0 2 6 27 3 6 5 0 1 0 0 173 0 15 5 0 8 18 4 2 0 1 1 0 1 12 0 0 0 1 5 1 4 0 0 333 1 0 1 0 14 0 3 0 3 3 4 1 0 0 10 2 1 1 1 0 1 0 1 19 0 3 3 1 5 1 2 1 1 14 2 0 4 4 2 2 1 0 2 0 2 20 1 0 0 5 4 2 8 0 2 158 0 0 1 1 9 0 1 0 0 4 3 0 0 0 12 5 0 0 4 1 0 2 4 9 1 4 3 1 1 0 0 0 1 14 3 0 17 1 0 0 1 0 1 1 1 15 0 0 2 3 2 4 2 0 0 134 0 0 0 0 10 0 1 0 0 12 3 0 0 0 6 0 1 1 1 10 2 0 2 0 2 2 3 1 0 0 1 1 2 1 13 3 2 9 2 2 2 0 0 0 1 5 9 2 0 0 2 1 0 9 0 28 142 10 yr total 14 8 13 11 107 14 24 6 16 51 27 4 4 4 134 23 24 14 12 23 5 16 34 96 18 21 26 8 11 12 8 196 9 227 59 4 75 48 36 733 6 5 13 3 28 371 10 3 2 49 44 10 45 6 39 2809 19892016 40 9 31 15 406 17 38 6 24 115 46 4 7 6 234 38 34 17 20 61 6 34 83 140 26 26 56 91 16 25 8 212 13 367 76 6 116 66 47 829 6 9 19 7 38 490 19 4 2 77 93 19 69 6 44 4313 Pre1989 18 3 1 8 82 2 8 0 13 41 21 0 0 3 41 8 2 3 6 24 4 14 75 64 6 7 12 0 2 6 0 37 7 185 26 0 27 7 6 22 0 0 38 0 3 27 2 2 0 14 10 3 7 0 10 911 Total 58 12 32 23 488 19 46 6 37 160 67 4 7 9 275 46 36 20 26 85 10 48 158 204 32 33 68 91 18 31 8 249 20 552 102 6 143 73 53 851 6 9 57 7 41 517 21 6 2 91 103 22 76 6 54 5224 Map 1 U.S. Map of Total Exonerations for each State (See Table 1’s Total column for data.) Maps created with Carto.com. Table 3 Number of Exonerated People By Jurisdiction (U.S.) 100 10 yr total 2106 19892016 3953 Pre1989 782 42 220 360 129 489 135 142 2809 4313 911 5224 19892016 3933 Pre1989 822 Jurisdiction 2016 2015 2014 2013 2012 2011 2010 2009 2008 2007 State case 465 690 323 187 130 117 312 140 107 Federal case 19 31 28 19 19 14 21 18 28 Total 484 721 351 206 149 131 333 158 Total 4735 Table 4 Number of Exonerated People By Sex/Type (U.S.) 2016 2015 2014 2013 2012 2011 2010 2009 2008 2007 Male 444 682 312 186 129 118 308 138 120 131 10 yr total 2568 Female 40 38 38 20 19 12 24 20 15 11 237 374 69 443 Business 0 1 1 0 1 1 1 0 0 0 5 6 4 10 Unknown 0 0 0 0 0 0 0 0 0 0 0 0 16 16 484 721 351 206 149 131 333 158 135 142 2809 4313 911 5224 Type Total 11 Total 4755 Table 5 Number of Exonerated People By Type of Crime (U.S.) Type 27 10 yr total 470 19892016 936 Pre1989 428 5 44 90 5 95 20 19 174 382 41 423 10 12 7 111 214 3 217 12 14 15 112 197 114 311 2016 2015 2014 2013 2012 2011 2010 2009 2008 2007 Homicide 59 78 58 49 39 35 37 56 32 Homicide/Sex Sexual Assault/Rape/ Indecent Assault Child Sex Assault/ Abuse Robbery/Theft/ Burglary/Extortion Assault 7 3 2 2 7 6 5 4 3 8 12 16 21 20 16 20 22 24 12 9 6 9 11 11 6 13 11 10 8 12 11 Total 1364 9 21 11 2 6 5 5 5 4 7 75 119 9 128 Drug Fraud/Forgery/ Embezzlement/Bribery Child Abuse/Assault 257 468 170 72 19 13 200 21 17 13 1250 1553 17 1570 10 17 9 16 9 5 9 9 11 5 100 145 40 185 3 1 4 1 0 0 1 1 0 0 11 18 0 18 Violent Other 14 21 17 12 8 2 12 6 12 30 134 172 48 220 Non-violent Other 87 75 44 15 24 26 22 12 10 14 329 487 206 693 Total 484 721 351 206 149 131 333 158 135 142 2809 4313 911 5224 Chart 2 Percentage of Exonerations by type of Crime (U.S.) Percentage of Exonerations by type of Crime (U.S.) Homicide Homicide/Sex Sexual Assault Child Sex Assault Robbery/Theft 2012-2016 Assault 1989-2016 Pre-1989 Drug Fraud/Forgery Child Abuse Violent Other Non-violent Other 0.0% 10.0% 20.0% 30.0% 40.0% 50.0% 60.0% Table 6 Number of Exonerated People by Race/Ethnicity (U.S.) Type 39 10 yr total 583 19892016 1145 Pre1989 448 42 62 663 1111 185 1296 8 6 14 135 262 24 286 1 0 0 12 18 6 24 0 0 0 11 16 2 18 2016 2015 2014 2013 2012 2011 2010 2009 2008 2007 White 75 94 79 56 50 45 45 52 48 Black 101 108 84 54 53 51 54 54 Hispanic 21 26 19 9 17 8 7 Asian 2 4 2 1 0 1 1 Native American 1 8 0 1 0 0 1 Total 1593 Middle eastern roots 1 0 1 0 0 0 0 0 0 0 2 2 0 2 Black/Asian 0 0 0 0 0 0 0 0 0 0 0 1 0 1 Other 1 2 4 0 0 1 1 1 0 0 10 15 0 15 Unidentified 282 479 162 85 29 25 224 42 39 27 1394 1743 246 1989 Total 484 721 351 206 149 131 333 158 135 142 2809 4313 911 5224 12 Table 7 Number of Exonerated People By Primary Types of Exculpatory Evidence* (U.S.) Type 2016 2015 2014 2013 2012 2011 2010 2009 2008 No crime occurred 360 590 219 103 45 33 219 43 42 38 10 yr Total 1692 19892016 2123 Pre1989 256 Insufficient evidence New forensic evidence (DNA & other) Prosecution concealment of evidence Prosecution fabricated evidence 95 119 36 20 23 21 27 23 31 20 415 498 185 683 113 87 70 20 32 29 29 30 26 16 452 630 27 657 193 425 124 76 13 16 197 35 7 33 1119 1417 53 1470 166 407 115 59 1 8 190 New witness evidence 21 16 10 8 6 3 7 4 2 2 954 1185 12 1197 4 3 5 83 135 60 195 Recantation by accuser 37 14 15 3 6 16 10 New DNA evidence** 17 12 8 11 18 22 18 8 4 7 120 170 40 210 22 17 19 164 360 0 360 Confession by perpetrator 9 5 6 4 CCTV, Electronic, or 8 13 5 4 Photographic evidence * More than one can apply to a particular case ** Does not include cases where DNA was contributory evidence 5 3 2 4 6 3 47 115 94 209 3 3 0 0 1 1 38 48 0 48 2007 Total 2379 Table 8 Number of Exonerated People By Conviction Method (U.S.) Type 2011 2010 10 yr total 19892016 Pre1989 Total 87 98 1070 1701 534 2235 11 16 209 245 92 337 20 4 1294 1407 23 1430 2 1 27 42 2 44 37 15 23 209 918 260 1178 158 135 142 2809 4313 911 5224 2015 2014 2013 Jury trial 143 166 108 103 89 82 96 98 Judge (Bench trial) 33 63 30 11 11 12 10 12 Guilty Plea 302 488 175 72 25 13 185 10 Alford Plea 6 4 4 0 3 1 5 1 Unidentified 0 0 34 20 21 23 37 484 721 351 206 149 131 333 Total 2012 2007 2016 2009 2008 Table 9 Number of Exonerated People Convicted After More Than One Trial (U.S.) Type 5 10 yr total 69 19892016 154 Pre1989 80 1 1 14 26 17 43 0 0 4 6 1 7 0 0 0 0 2 3 5 6 4 6 87 188 101 289 2016 2015 2014 2013 2012 2011 2010 2009 2008 2007 2 trials 12 21 7 7 3 2 3 6 3 3 trials 1 1 2 3 3 1 1 0 4 trials 2 0 1 1 0 0 0 0 5 trials 0 0 0 0 0 0 0 Total 15 22 10 11 6 3 4 Total 234 Table 10 Number of State Prisoners Exonerated After Federal Habeas Granted (U.S.) Year Number 2016 2015 2014 2013 2012 2011 2010 2009 2008 2007 6 7 3 4 2 2 4 6 4 7 13 10 yr total 47 19892016 90 Pre1989 36 Total 126 Table 11 Number of Exonerated People Convicted By Primary Types of Prosecution Evidence* (U.S) Eyewitness error 28 39 41 32 25 28 32 25 51 38 10 yr total 311 Victim ID error 38 33 24 21 22 18 21 13 18 19 189 365 62 427 Informant evidence 18 14 10 4 2 11 6 12 3 7 69 164 51 215 232 Type 2016 2015 2014 2013 2012 2011 2010 2009 2008 2007 19892016 656 Pre1989 222 Total 878 Expert witness 23 14 5 4 12 8 10 10 11 6 80 216 16 Judge’s Errors 67 95 37 22 24 12 18 22 21 15 266 413 144 557 Police Misconduct/Perjury 194 427 132 72 20 22 201 17 9 9 909 1411 66 1477 Prosecutor Misconduct 37 31 24 20 14 12 12 14 8 33 168 353 73 426 False Confession Co-defendant falsely confessed (Defendant didn't confess) Concealed evidence 13 27 22 9 11 11 18 13 26 8 145 292 73 365 0 1 0 0 0 1 0 0 0 0 2 55 9 64 186 422 124 77 14 4 182 16 6 35 880 1394 63 1457 Circumstantial evidence 40 39 36 11 7 8 9 9 3 5 127 218 149 367 Drug analysis (erroneous) 83 52 47 0 1 0 0 1 0 0 101 185 0 185 * More than one can apply to a particular case Table 12 Number of Exonerated People By Method of Exoneration (U.S.) Type Acquitted by Court 2016 2015 2014 2013 2012 2011 2010 2009 2008 2007 113 140 92 36 28 27 28 25 10 46 10 yr total 545 19892016 633 Pre1989 217 Total 850 Acquitted after Retrial 14 19 9 11 8 4 9 5 5 9 93 199 73 272 Charges dismissed 355 558 248 156 112 2 294 118 117 83 2139 3283 485 3768 Pardoned Total 2 4 2 3 1 2 2 10 3 4 33 198 136 334 484 721 351 206 149 131 333 158 135 142 2810 4313 911 5224 Table 13 Number of Exonerated Persons Involved In A Case With A Co-Defendant (U.S.) Type 2016 2015 2014 2 Co-defendants 3 Co-defendants 22 13 7 12 4 Co-defendants 6 5 Co-defendants 0 6 Co-defendants 16 10 yr total 136 19892016 318 Pre1989 95 4 50 90 35 125 0 1 27 63 21 84 0 0 20 39 22 61 5 1 0 6 6 12 18 0 0 0 0 0 0 0 0 6 12 14 14 28 12 15 27 0 0 0 0 0 10 20 0 0 0 0 10 0 10 0 2013 2012 2011 2010 2009 2008 2007 29 8 11 3 7 6 12 8 25 14 4 6 4 4 8 3 8 3 0 8 4 1 0 2 3 6 0 0 0 0 0 0 0 0 0 7 Co-defendants 1 0 9 Co-defendants 0 9 3 3 0 0 0 0 0 0 3 0 10 Co-defendants 0 10 0 0 Total 413 12 Co-defendants 0 0 0 0 0 18 18 14 Co-defendants 0 0 0 0 0 0 0 0 0 0 0 0 14 14 0 0 0 0 0 0 0 16 Co-defendants 0 0 0 0 0 16 16 17 Co-defendants 0 0 0 0 0 0 0 0 0 0 0 0 17 17 24 Co-defendants 0 0 0 0 0 0 0 0 0 0 0 0 48 48 0 0 0 0 0 28 28 28 0 28 24 23 14 36 19 49 295 580 337 917 28 Co-defendants 0 0 0 0 Total 36 55 38 37 14 Table 14 Number of Exonerations Involving DNA Evidence By Year Year U.S. U.S. Primary Evidence Contributory Evidence* International US Total All DNA Evidence* 2016 17 2 19 1 2015 12 6 18 1 2014 8 13 21 2 2013 11 3 14 1 2012 18 3 21 2 2011 22 4 26 3 2010 18 3 21 1 2009 22 5 27 5 2008 17 3 20 4 2007 19 0 19 0 2006 19 2 21 0 2005 17 4 21 1 2004 13 1 14 5 2003 21 3 24 1 2002 23 0 23 1 2001 20 0 20 2 2000 15 1 16 2 1999 13 0 13 1 1998 4 0 4 3 1997 8 1 9 1 1996 14 3 17 0 1995 7 1 8 1 1994 8 3 11 0 1993 4 1 5 0 1992 5 1 6 1 1991 3 0 3 0 1990 1 0 1 0 1989 1 0 1 0 Total 360 63 423 39 * All international cases involved DNA as primary evidence. ** Contributory DNA evidence was insufficient to be relied on to exonerate the person, however, when combined with other exculpatory evidence it contributed to the person’s exoneration. Chart 3 Exonerations Relying On DNA Evidence in the U.S. and Internationally 25 20 15 U.S. Primary Evidence U.S. Contributory Evidence 10 Int. DNA Evidence 5 15 2016 2014 2012 2010 2008 2006 2004 2002 2000 1998 1996 1994 1992 1990 Year 0 Chart 4 Percentage of Exonerations based on DNA evidence – 1989-2006 (U.S.) Pct. of Exonerations based on DNA evidence - 1989-2016 (U.S.) 30.0% 25.0% 20.0% 15.0% 10.0% 5.0% 19 90 19 92 19 94 19 96 19 98 20 00 20 02 20 04 20 06 20 08 20 10 20 12 20 14 20 16 0.0% Table 15 Number of Exonerated People Aided By Conviction Integrity Unit (U.S.) Jurisdiction Harris County, TX 2016 2015 2014 2013 2012 2011 2010 2009 2008 Total 79 48 46 0 0 0 2 1 0 176 Dallas County, TX 0 0 3 0 6 4 1 6 9 29 Kings County, NY 4 7 10 0 0 0 0 0 0 21 Cook County, IL 8 3 3 4 2 0 0 0 0 20 Bexar County, TX 7 2 0 0 0 0 0 0 0 9 Cuyahoga County, OH 7 0 0 0 0 0 0 0 0 7 Multnomah County, OR 5 0 0 0 0 0 0 0 0 5 New York County, NY 0 0 0 1 3 0 0 0 0 4 Baltimore, MD 1 0 3 0 0 0 0 0 0 4 Tarrant County, TX 4 0 Lake County, Illinois 0 2 0 0 0 0 0 0 0 2 Philadelphia County, PA 2 0 0 0 0 0 0 0 0 4 4 Santa Clara County, CA 0 0 0 0 1 0 0 0 0 1 Orleans Parish, Louisiana 0 1 0 0 0 0 0 0 0 1 Ventura County, CA 0 1 0 0 0 0 0 0 0 1 Bronx County, NY 1 0 0 0 0 0 0 0 0 1 Broward County, TX 0 0 0 0 0 0 0 0 0 1 118 64 65 5 12 4 3 7 9 287 Total Table 16 Number of Exonerated People By Years In Custody (U.S.) Years 2016 2015 2014 Probation/Fine 314 521 Less than 1 yr 58 68 56 10 yr total 1587 19892016 2059 9 218 287 72 359 2013 2012 2011 2010 2009 2008 2007 210 98 42 37 221 53 36 41 13 8 7 7 3 4 Pre1989 297 Total 2356 1 to 9 yrs 58 76 43 44 55 42 66 43 53 43 523 1131 446 1577 10 to 19 yrs 19 24 34 32 30 27 24 38 23 24 275 562 70 632 20 to 29 yrs 34 26 14 16 12 18 12 19 18 10 179 241 21 262 30 to 39 yrs 1 6 9 3 2 0 3 2 1 0 27 32 5 37 40 and greater 0 0 0 0 0 0 0 0 0 0 0 1 0 1 484 721 351 206 149 131 333 158 135 142 2810 4313 911 5224 Total 16 Table 17 Average Years Exonerated Person Was In Custody Before Release (All types of cases) 2016 2015 2014 2013 2012 2011 2010 2009 2008 2007 10 yr average 19892015 Pre1989 Total Avg. Men 8.7 7.8 10.5 11.3 10.2 11.1 9.1 12.8 10.1 9.4 9.8 9.2 5.2 8.3 Women 2.5 4.4 4.4 3.0 5.3 5.3 5.7 5.0 5.9 2.2 4.2 4.7 3.0 4.5 Combined 8.1 7.5 9.6 10.6 9.7 10.8 8.9 11.9 9.8 8.7 9.3 8.8 5.1 8.0 Years United States International Men 6.3 5.7 3.7 5.2 6.4 4.6 6.4 4.8 3.2 3.6 4.9 5.5 4.7 5.4 Women 5.5 2.6 1.0 1.5 3.9 7.8 2.3 1.1 1.0 6.1 3.2 3.6 3.5 3.5 Combined 6.2 5.1 3.4 4.9 6.2 4.8 5.9 4.5 3.0 3.8 4.8 5.3 3.1 5.0 Table 18 Average Years Exonerated Person Was In Custody Before Release (Homicide or Sexual Assault only) Years 10 yr average 19892016 Pre1989 Total Avg. 15.5 12.9 6.3 11.2 8.6 7.6 3.8 7.0 15.0 12.6 6.2 11.0 6.9 7.4 6.5 7.3 6.4 4.9 5.3 4.6 5.2 5.6 6.7 7.2 6.3 7.1 2016 2015 2014 2013 2012 2011 2010 2009 2008 2007 17.7 15.6 17.7 16.2 14.1 15.9 13.9 15.4 15.3 11.9 Women 7.3 14.7 11.5 5.4 9.9 9.3 12.5 5.7 9.0 2.3 Combined 17.1 15.6 17.1 15.3 13.7 15.7 13.8 14.4 15.0 11.1 Men 9.2 7.9 4.6 9.2 7.4 6.3 10.7 7.0 3.8 5.5 Women 7.9 4.5 4.1 2.1 5.6 7.8 1.4 Combined 9.1 7.4 4.6 8.3 7.3 6.5 United States Men International 2.4 8.9 2.1 6.8 3.7 Table 19 Average Years Exonerated Person Was In Custody Before Release (Non-Homicide or Sexual Assault only) 2016 2015 2014 2013 2012 2011 2010 2009 2008 2007 10 yr average 19892016 Pre1989 Total Avg. Men 2.7 2.4 3.6 3.4 4.7 5.5 4.9 6.1 4.5 6.2 3.9 4.0 2.5 3.8 Women 0.7 0.8 1.3 0.7 2.0 2.6 2.2 4.0 3.6 2.0 1.6 2.8 2.0 2.7 Combined 2.5 2.2 3.2 3.1 4.3 5.3 4.7 5.8 4.5 5.7 3.6 3.9 2.6 3.6 Years United States International Men 1.4 2.0 1.8 2.4 5.7 2.6 2.6 2.4 2.4 1.9 2.7 2.9 3.0 2.9 Women 1.8 0.8 1.0 0.2 2.7 0.0 2.0 0.6 0.8 5.3 1.4 1.5 2.5 1.6 Combined 1.5 1.8 1.6 2.3 5.5 2.6 2.6 2.2 2.3 2.1 2.6 2.8 1.7 2.6 Chart 5 Average Years in Custody Before Exoneration (U.S.) 18.0 16.0 Avg Yrs Imprisoned Before Release (Homicide/Sexual Assault cases only) U.S. 14.0 12.0 10.0 8.0 Avg Yrs Imprisoned Before Release (NonHomicide/Sexual Assault cases only) U.S. 6.0 4.0 2.0 20 07 20 08 20 09 20 10 20 11 20 12 20 13 20 14 20 15 20 16 Ye ar s 0.0 17 Table 20 Number of Exonerated People By County (12 or more) (U.S.) County/Parish/Borough State Major City 2016 2015 2014 2013 2012 2011 2010 2009 2008 2007 10 yr 1989total 2015 709 770 Pre1989 10 Total Philadelphia PA Philadelphia 146 397 110 53 0 2 1 0 0 0 Los Angeles CA Los Angeles 1 1 4 4 8 6 2 8 3 5 42 248 47 780 295 Harris TX Houston 80 53 47 3 4 1 4 3 1 1 197 212 3 215 Cook IL Chicago 13 5 13 11 10 11 4 7 6 4 84 156 25 181 Camden NJ Camden 0 1 0 0 0 0 172 0 0 0 173 174 3 177 New York (Manhattan) NY New York City 3 11 5 5 7 5 0 3 6 1 46 68 56 124 Kings (Brooklyn) NY New York City 8 15 1 5 2 1 3 1 1 4 55 90 24 114 Wayne MI Detroit 3 0 5 4 1 0 6 2 3 0 24 44 32 76 Bronx NY New York City 2 0 4 6 2 3 3 1 0 2 23 47 14 61 Suffolk MA Boston 1 0 1 0 0 0 0 0 2 0 4 25 26 51 Queens NY New York City 2 2 1 1 2 4 2 1 0 2 17 35 13 48 Tulsa OK Tulsa 2 0 2 0 1 7 17 2 0 0 31 39 0 39 38 Swisher TX Tulia 0 1 0 0 0 2 0 0 0 0 3 38 0 Cuyahoga OH Cleveland 10 1 5 0 1 5 2 1 1 1 27 32 5 37 Essex MA Salem 0 1 0 0 0 0 1 0 0 0 2 9 27 36 District of Columbia DC District of Columbia 1 2 3 1 5 1 0 3 0 0 16 24 11 35 Suffolk NY Southhampton 2 2 0 1 7 1 0 1 2 0 16 22 11 33 King WA Seattle 1 1 0 1 0 0 1 2 0 0 6 20 7 27 Orleans LA New Orleans 2 1 1 1 2 1 0 0 0 0 8 24 2 26 Kern CA Bakersfield 1 0 0 0 0 0 0 0 0 0 1 1 24 25 Charleston SC Charleston 0 0 0 0 0 1 0 0 1 0 2 25 0 25 Milwaukee WI Milwaukee 1 2 0 0 0 0 2 6 0 3 14 24 0 24 San Diego CA San Diego 0 0 3 0 1 3 0 1 1 0 10 22 1 23 Monroe NY Rochester 2 2 1 1 1 0 2 0 0 0 8 12 11 23 Miami-Dade FL Miami 1 2 0 0 0 0 1 0 0 3 7 13 10 23 Richmond VA Richmond 7 8 0 0 0 1 0 2 0 0 18 22 1 23 Broward FL Fort Lauderdale 1 3 0 0 1 0 1 1 0 2 9 17 5 22 Erie NY Buffalo 1 2 1 0 0 0 2 1 1 2 11 13 8 21 Montgomery TX Conroe 8 5 1 1 0 2 0 0 0 0 18 21 0 21 Middlesex MA Lowell 2 1 0 2 0 0 0 0 1 0 5 13 7 20 East Baton Rouge LA Baton Rouge 0 0 0 1 0 0 0 0 0 0 0 1 18 19 Richland OH Mansfield 0 1 1 0 0 0 0 0 14 2 18 18 0 18 Oakland MI Oak Park 0 0 3 0 1 0 4 1 1 0 12 14 4 18 Berrien IN Benton Harbor 0 0 0 2 0 0 1 14 0 0 15 17 0 17 Santa Clara CA Cupertino 0 1 0 0 1 0 1 1 1 2 7 16 0 16 Clark NV Las Vegas 3 0 1 0 0 1 0 1 0 1 7 13 3 16 Maricopa AZ Phoenix 1 1 0 0 2 0 2 0 1 0 7 15 1 16 Jefferson AL Birmingham 0 2 0 0 1 2 0 0 0 0 5 16 0 16 Oklahoma OK Oklahoma City 2 1 0 1 0 1 0 2 0 2 9 13 3 16 San Francisco CA San Francisco 0 2 0 0 0 1 2 0 0 0 5 8 8 16 Allegheny PA Pittsburgh 1 0 0 0 1 1 0 0 0 0 3 14 1 15 York NC Rock Hill 0 14 0 0 0 0 0 0 0 0 14 14 0 14 Franklin OH Columbus 0 0 0 0 0 0 0 1 1 0 2 9 5 14 Bexar TX San Antonio 8 3 0 0 1 1 0 0 0 0 13 13 1 14 Orange CA Santa Ana 1 0 2 0 1 0 2 0 0 0 6 13 0 13 New Haven CT New Haven 0 3 0 4 0 0 1 2 0 0 10 12 1 13 Hillsborough FL Tampa 0 1 0 1 0 0 0 0 0 2 4 11 2 13 Multnomah OR Portland 5 0 2 0 0 0 0 0 0 1 8 12 1 13 Hampden MA Springfield 0 0 0 2 3 1 1 0 0 0 7 10 3 13 Chelan WA Wenatchee 0 0 0 0 0 0 0 0 0 0 0 12 0 12 Macomb MI Michigan 0 0 0 1 0 0 4 0 0 0 6 11 1 12 Travis TX Austin 0 1 1 0 1 0 0 2 1 0 5 12 0 12 Tarrant TX Fort Worth 6 0 0 0 1 0 0 1 0 0 8 12 0 12 18 Table 21 Number of Exonerated People By Country – International Cases Only Country Afghanistan Angola Australia Bahamas Bahrain Bangladesh Barbados Belarus Belgium Belize Bermuda Bhutan Botswana Brazil Brunei Darussalam Bulgaria Cambodia Canada Cayman Islands Chile China Colombia Costa Rica Croatia Cuba Cyprus Czech Republic Denmark Egypt Fiji Finland France Germany Ghana Greece Guatemala Hong Kong Hungary India Indonesia Iran Ireland Isle of Man Israel Italy Jamaica Japan Jersey Kenya Kosovo Kuwait Latvia Libya Lithuania Malawi Malaysia Maldives Malta 2016 2015 2014 2013 2012 2011 2010 2009 2008 2007 0 0 14 1 0 0 2 0 0 0 1 2 0 0 0 0 0 6 0 0 11 0 0 1 0 0 0 0 7 0 4 0 0 1 1 0 5 0 32 0 0 2 0 1 3 0 3 0 0 0 1 0 0 0 19 4 0 7 0 0 10 5 0 3 0 0 0 2 2 0 0 0 11 0 0 0 0 0 0 0 0 0 0 0 16 2 0 0 0 0 0 0 2 0 0 0 8 0 9 0 0 0 0 0 0 0 0 18 12 1 0 0 0 0 0 0 0 0 1 0 6 0 0 0 0 3 0 1 0 0 0 0 11 0 0 1 0 0 0 4 0 0 0 0 22 0 1 0 0 0 7 0 0 0 0 0 6 0 1 0 0 0 0 0 0 0 0 1 0 0 0 8 0 0 6 1 6 0 0 0 0 0 12 1 1 1 0 4 0 0 2 0 40 0 0 5 0 1 8 0 2 0 1 0 0 0 0 0 0 2 0 0 0 0 0 0 4 0 0 2 0 0 0 0 0 0 0 0 0 0 3 0 0 0 0 6 0 18 0 3 3 1 16 16 0 1 0 6 0 0 0 0 0 0 7 0 0 0 0 0 0 5 0 0 2 0 0 2 0 0 0 0 0 2 0 2 2 0 0 0 2 0 52 0 0 0 0 0 3 3 1 0 3 0 0 0 0 0 0 0 0 0 0 0 0 0 4 3 0 0 0 0 0 0 0 4 0 0 5 1 1 0 1 12 0 7 1 6 0 0 0 0 0 1 1 2 0 4 0 0 0 0 0 0 0 0 0 0 0 0 0 7 1 0 3 0 0 0 1 0 0 0 2 0 0 0 0 0 0 0 1 0 4 0 0 1 0 1 2 0 2 0 0 0 0 0 0 0 0 2 0 0 0 0 1 0 6 1 0 0 0 0 0 0 0 0 0 1 0 0 6 1 2 0 0 2 0 4 1 0 1 0 1 1 7 0 1 4 1 0 0 0 0 0 3 0 2 0 1 0 0 9 0 0 0 1 0 0 0 0 0 0 0 5 0 0 0 0 0 0 0 0 3 3 1 1 0 0 0 3 1 0 2 0 0 0 0 0 0 7 0 0 0 0 0 0 8 0 0 0 0 0 0 0 3 0 0 0 0 0 0 2 2 1 0 5 0 2 0 0 0 0 0 1 0 1 0 4 0 0 1 6 0 2 2 0 0 0 0 0 0 0 1 2 1 0 2 1 1 0 0 0 0 0 0 4 0 0 0 0 0 0 6 0 18 0 0 0 0 0 0 0 0 0 0 0 0 0 2 1 0 2 2 0 0 0 0 0 0 0 19 10 yr total 1 18 116 9 11 4 2 3 7 7 5 2 2 1 1 1 1 59 6 0 26 3 7 3 1 3 4 0 22 17 6 13 5 10 14 0 36 1 179 4 4 13 1 20 35 14 13 1 24 1 1 1 8 1 21 29 2 7 19892016 1 18 154 9 12 4 2 3 7 9 6 2 2 1 1 1 1 98 6 3 31 3 8 7 1 3 4 1 23 17 6 20 16 11 15 0 36 3 186 7 4 26 1 28 37 19 16 1 26 1 2 1 8 1 22 34 2 7 Pre1989 0 0 16 0 0 0 1 0 0 0 0 0 0 0 0 0 0 6 0 0 0 0 0 0 0 0 0 0 0 0 0 7 27 0 0 3 0 0 6 0 0 3 0 1 1 5 10 0 0 0 0 0 0 0 0 0 0 Total 1 18 170 9 12 4 3 3 7 9 6 2 2 1 1 1 1 104 6 3 31 3 8 7 1 3 4 1 23 17 6 27 43 11 15 3 36 3 192 7 4 29 1 29 38 24 26 1 26 1 2 1 8 1 22 34 2 7 Country 2016 2015 2014 2013 2012 2011 2010 2009 2008 2007 Mauritius Mexico Mongolia Morocco Namibia Nauru Netherlands Netherlands (Dutch) Antilles New Caledonia New Zealand Nicaragua Nigeria North Korea Northern Mariana Islands Norway Pakistan Peru Philippines Poland Portugal Qatar Russian Federation Rwanda Saint Kitts and Nevis Saint Lucia Saudi Arabia Senegal Serbia Seychelles Sierra Leone Singapore Somalia South Africa South Korea Spain Sri Lanka Sudan Swaziland Sweden Switzerland Taiwan Tanzania Thailand Tonga Trinidad and Tobago Tunisia Turkey Turks and Caicos Islands Uganda Ukraine United Arab Emirates United Kingdom (Great Britain) U.N. Court in the Hague Vanuatu Vietnam Virgin Islands (British) Zambia Zimbabwe Total 1 0 0 0 0 0 0 0 0 7 0 0 0 0 0 2 2 1 0 1 0 0 0 0 0 0 0 0 0 0 0 0 1 4 0 0 0 0 5 1 1 1 0 0 0 0 275 0 1 0 1 25 1 1 0 0 0 3 462 0 1 3 0 0 0 0 0 0 13 0 3 0 1 0 9 0 1 0 0 0 0 0 1 0 0 0 1 0 0 0 0 3 0 0 0 1 0 0 0 0 2 0 0 0 0 2 0 0 0 0 44 0 0 1 0 0 1 211 0 0 0 1 2 0 0 0 0 11 0 0 0 1 0 0 0 0 0 0 2 0 0 0 0 0 0 0 0 0 1 0 2 0 1 0 1 0 1 0 0 13 0 0 1 0 1 0 1 0 0 65 0 0 1 2 0 4 208 0 1 0 0 1 0 0 2 0 4 0 3 0 1 0 0 0 0 0 0 0 1 0 1 0 0 0 1 0 1 2 2 0 1 0 0 0 1 2 0 0 1 0 0 1 1 63 0 0 0 7 26 0 0 1 0 2 0 189 0 1 0 0 1 0 0 0 0 0 0 1 0 0 0 2 1 0 0 0 0 0 0 0 0 0 0 0 0 0 3 0 1 0 0 0 0 0 4 0 0 1 0 0 0 0 0 5 1 0 1 20 0 0 0 0 4 0 142 0 0 0 0 0 0 0 0 0 2 0 2 0 0 0 0 0 0 0 0 0 0 0 0 0 0 0 0 0 1 0 0 0 0 5 0 0 0 1 0 2 0 0 0 0 0 0 0 4 0 5 53 0 0 0 1 0 1 161 0 0 0 0 0 0 2 0 0 4 0 0 0 0 0 0 1 7 0 0 0 0 0 1 0 0 0 2 0 0 0 0 0 0 0 0 0 0 1 1 0 0 0 0 1 0 0 0 1 0 0 32 0 0 0 0 1 4 96 0 0 0 0 0 0 1 0 1 4 0 0 2 0 11 1 0 1 0 0 0 0 0 4 0 0 9 1 0 0 1 0 0 0 0 0 0 0 0 2 0 1 0 1 5 0 0 0 0 0 3 46 0 0 0 0 0 1 155 0 0 0 1 0 0 0 0 0 11 0 0 0 0 13 0 0 0 0 0 0 0 1 4 0 0 0 0 0 0 2 0 6 3 4 1 0 0 2 0 0 1 0 0 0 0 0 0 0 0 0 42 1 0 1 0 0 1 163 0 0 0 0 0 0 0 0 0 5 1 0 0 0 18 0 0 0 0 0 0 0 0 1 1 0 0 0 0 0 0 0 2 8 0 0 4 0 0 0 0 12 2 0 1 0 0 0 1 0 0 66 0 0 0 1 0 2 172 20 10 yr total 1 3 3 2 4 0 3 2 1 61 1 9 2 3 42 14 4 10 0 1 2 1 1 12 1 0 9 5 0 2 9 2 15 16 10 1 6 1 16 4 3 32 2 1 9 1 341 5 9 0 17 419 2 1 4 4 7 17 1959 19892016 1 9 3 2 5 0 6 2 1 72 1 16 2 3 70 23 4 10 1 1 2 2 1 12 1 7 9 5 0 2 10 2 30 17 16 1 6 1 19 5 3 33 6 1 10 1 344 5 12 1 18 855 2 2 11 4 7 18 2687 Pre1989 0 0 0 0 0 1 1 0 0 2 0 1 0 0 0 0 0 1 0 0 0 15 0 0 0 0 0 0 1 0 1 0 2 0 0 1 0 0 0 0 0 0 0 0 0 0 0 0 0 0 0 107 0 0 1 0 0 0 220 Total 1 9 3 2 5 1 7 2 1 74 1 17 2 3 70 23 4 11 1 1 2 17 1 12 1 7 9 5 1 2 11 2 32 17 16 2 6 1 19 5 3 33 6 1 10 1 344 5 12 1 18 962 2 2 12 4 7 18 2907 Table 22 Number of Exonerated People By Type of Crime (International) Type 35 10 yr total 376 19892016 617 Pre1989 53 1 2 20 26 1 27 18 19 28 133 220 3 223 5 3 4 3 49 74 1 75 8 5 8 10 21 97 168 45 213 2016 2015 2014 2013 2012 2011 2010 2009 2008 2007 Homicide 43 61 50 28 38 29 19 32 41 Homicide/Sex Sexual Assault/Rape/ Indecent Assault Child Sex Assault/ Abuse Robbery/Theft/ Burglary/Extortion Assault 1 1 3 3 1 1 7 0 9 8 11 9 7 10 14 7 10 9 3 0 5 7 12 9 10 7 19 Total 670 13 8 6 3 4 3 24 25 8 113 140 13 153 Drug Fraud/Forgery/ Embezzlement/Bribery Child Abuse/Assault 2 12 4 8 2 4 7 9 10 19 77 106 4 110 25 23 4 12 2 10 9 10 7 13 115 143 7 150 0 0 2 0 0 0 0 0 0 0 2 6 0 6 Violent Other 290 10 17 11 47 7 11 17 30 9 449 514 54 568 Non-violent Other 59 61 91 99 35 83 16 34 16 34 528 673 39 712 Total 462 211 208 189 142 161 96 155 163 172 1959 2687 220 2907 Table 23 Number of Exonerated People By Method of Exoneration (International) 433 169 120 122 121 63 35 29 22 42 10 yr total 1156 Acquitted after Retrial 9 13 4 7 0 7 6 4 11 14 75 107 Charges dismissed 20 21 84 59 21 9 4 9 7 1 272 300 2 302 Pardoned 0 8 0 1 0 5 0 1 1 6 22 96 13 109 Type 2016 2015 2014 2013 2012 2011 2010 2009 Acquitted by reviewing Court 2008 2007 19892016 1212 Pre1989 14 15 122 Total 1226 Table 24 Number of Exonerated Persons Involved In A Case With A Co-Defendant (International) Type 2016 2015 2014 2013 2012 2011 2 Co-defendants 14 3 Co-defendants 9 4 Co-defendants 12 4 5 Co-defendants 10 5 10 0 10 15 6 Co-defendants 6 6 12 0 0 5 7 Co-defendants 0 0 14 0 0 0 8 Co-defendants 8 7 0 0 0 9 Co-defendants 0 0 0 0 9 11 Co-defendants 0 0 0 0 12 Co-defendants 0 12 0 0 13 Co-defendants 0 0 0 0 16 Co-defendants 0 0 16 17 Co-defendants 0 0 0 18 Co-defendants 0 0 0 19 Co-defendants 19 0 20 Co-defendants 0 0 2010 20 28 26 20 5 24 12 3 15 9 0 8 16 0 14 10 yr total 161 19892016 234 Pre1989 15 12 117 165 30 195 8 68 98 1 99 2009 2008 2007 Total 7 9 18 11 13 9 4 16 0 5 10 5 70 75 5 80 1 0 0 6 36 54 0 54 7 0 7 7 35 35 6 41 0 0 8 0 8 31 31 0 31 0 0 9 0 0 18 18 0 18 22 0 0 0 0 0 22 22 0 22 0 12 0 0 0 0 24 24 0 24 0 0 0 0 0 0 0 13 13 0 0 0 0 0 0 0 16 16 0 16 0 17 0 0 0 0 0 17 17 0 17 0 0 18 0 0 0 0 18 18 0 18 0 0 0 0 0 0 0 0 19 19 0 19 0 0 0 20 0 0 0 0 20 20 0 20 249 29 Co-defendants 0 0 29 0 0 0 0 0 0 0 29 29 0 29 Total 78 78 121 37 93 100 26 48 60 60 701 875 70 945 21 Map 2 World Map of Total Exonerations for each Country (See Table 21’s Total column for data.) Map created with Carto.com. 22 Federal Court Is The Death Zone For Innocent State Prisoners15 F ederal court is the place where an innocent state prisoner goes as a last resort when the highest court in their state has denied justice. It is common to hear people assert a prisoner will finally get justice when they get out of what is viewed as a state court system rigged to protect shady convictions and wrongdoing by prosecutors and police. Federal court is envisioned as nirvana populated with judges dedicated to seeking the truth. Unfortunately, reality is that the overwhelming majority of state prisoners have the last vestige of their belief in justice crushed in federal court. Six state prisoners were exonerated in 2016 after having their federal habeas corpus petition granted.16 Six out of the thousands of federal habeas petitions filed each year by state prisoners in the United States, plus Puerto Rico, Guam, and the U.S. Virgin Islands. Those six people were: ● Joel Albert Alcox, convicted of murder and robbery in California. He spent 26 years in custody. ● Jaime Caetano, convicted of possessing a dangerous weapon (stun gun) in Massachusetts. She was jailed for several days. ● Teshome Campbell, convicted of first-degree murder in Illinois. He spent 18 years in custody. ● Jimmie Gardner, convicted of rape and assault in West Virginia. He spent 27 years in custody. ● William Haughey, convicted of arson in New York. He spent 8 years in custody. ● Jules Letemps, convicted of sexual assault and kidnapping in Florida. He spent 27 years in custody. The exoneration in 2016 of those six after federal court review of their convictions wasn’t an anomaly. It was slightly more than the annual average of less than five from 2002 to 2016, when there were a total of 64 exonerations of a state prisoner following the grant of their federal habeas corpus. For each year from 2002 to 2016 the number of exonerations were: 2016 = 6 2015 = 7 2014 = 3 2013 = 4 2012 = 2 2011 = 4 2010 = 4 2009 = 6 2008 = 4 2007 = 7 2006 = 3 2005 = 2 2004 = 3 2003 = 5 2002 = 4 Total = 64 The 64 state prisoner exonerations in the fifteen years from 2002 to 2016 was less than one for each of the 94 federal court districts. Those 64 exonerations were of state prisoners in only 20 states, plus the District of Columbia and Puerto Rico: Arizona = 1 California = 12 Connecticut = 1 District of Columbia = 2 Florida = 2 15 This is a modification of the article by Hans Sherrer, “Federal Court Is The Death Zone For Innocent State Prisoners,” published by Justice Denied on February 16, 2017. Available online at, http://justicedenied.org/wordpress/archives/3511 . 16 Innocents Database, http://forejustice.org/idb1989us.html . 23 Illinois = 6 Louisiana = 1 Massachusetts = 4 Nevada = 3 New Jersey = 1 New York = 12 North Carolina = 2 Ohio = 6 Oklahoma = 2 Oregon = 1 Pennsylvania = 1 Puerto Rico = 1 Texas = 1 Virginia = 1 Washington = 1 West Virginia = 1 Wisconsin = 2 More than half – 36 – came from federal courts in four states: California (12); Illinois (6); Ohio (6); and, New York (12). So in the fifteen years from 2002 to 2016 there wasn’t a single state prisoner exonerated by a federal court in thirty states! The rarity of an exoneration as the result of action by a federal court is not only shown by how few occur, but by the low number of successful petitions compared with the number of habeas petitions filed. From 2002 to 2016 there were 51,010 federal habeas petitions filed by state prisoners seeking to overturn their conviction(s).17 That means the overall success rate was one out of 797, or 00.1255%. That is very long odds at best. However, federal courts treat a case in which the death penalty was imposed more favorably than a non-death penalty case. That is reflected in the significant difference in the exoneration rate between the two types of cases. There were 56 exonerations out of the 50,884 state prisoner non-death penalty federal habeas petitions filed. So 1 out of 909 petitions was successful, a rate of 0.11%. There were 126 habeas petitions filed in a death penalty case, and 8 exonerations. So 1 out of 15.75 petitions was successful, a rate of 6.3%. Hovering over every failed federal habeas corpus petition is the gleeful ghost of deceased U.S. Supreme Court Chief Justice William Rehnquist. He was a champion of the Anti-Terrorism and Effective Death Penalty Act (AEDPA) enacted in 1996. Rehnquist was a passionate proponent of limiting the ability of state prisoners to successfully raise post-conviction constitutional claims in federal court. The AEDPA codified some of the judicial rules in effect during his reign as chief justice. The AEDPA established procedural requirements and review standards so onerous that few state prisoners meet them, regardless of the merits of their case – or their factual innocence. Consequently, the AEDPA is working exactly as Rehnquist intended to make federal court the place where unjustly convicted or sentenced state prisoners go to have their hopes die. Many commentators – including federal appellate court judges – have observed that the AEDPA has had a devastating effect on the ability of a state prisoner – even those who may be actually innocent – to obtain federal habeas relief. In 2015 articles by Alex Kozinski and Stephen Reinhardt, who are both judges on the U.S. Court of Appeals for the Ninth Circuit, explained the negative effect of the AEDPA on state prisoners seeking federal habeas corpus relief. Judge Stephen Reinhardt wrote in “The Demise of Habeas Corpus and the Rise of Qualified Immunity: The Court’s Ever Increasing Limitations on the Development and Enforcement of Constitutional Rights and Some 17 Information source: Statistical Tables for the Federal Judiciary, United States Courts, http://www.uscourts.gov/statisticsreports/analysis-reports/statistical-tables-federal-judiciary . (last viewed March 15, 2017) 24 Particularly Unfortunate Consequences,” 113 Mich. L.R. 1219, Issue 7, (2015): “The collapse of habeas corpus as a remedy for even the most glaring of constitutional violations ranks among the greater wrongs of our legal era. Once hailed as the Great Writ, and still feted with all the standard rhetorical flourishes, habeas corpus has been transformed over the past two decades from a vital guarantor of liberty into an instrument for ratifying the power of state courts to disregard the protections of the Constitution. … any participant in our habeas regime would have to agree that it resembles a twisted labyrinth of deliberately crafted legal obstacles that make it as difficult for habeas petitioners to succeed in pursuing the Writ as it would be for a Supreme Court Justice to strike out Babe Ruth, Joe DiMaggio, and Mickey Mantle in succession—even with the Chief Justice calling balls and strikes.” (1219-20) Similarly, Judge Alex Kozinski wrote in, “Criminal Law 2.0,” 44 Geo. L.J. Ann. Rev. Crim. Proc (2015) (Preface, iii): “The federal court safety-value was abruptly dismantled in 1996 when Congress passed and President Clinton signed the Antiterrorism and Effective Death Penalty Act. … We now regularly have to stand by in impotent silence, even though it may appear to us that an innocent person has been convicted. AEDPA is a cruel, unjust and unnecessary law that effectively removes federal judges as safeguards against miscarriages of justice. It has resulted and continues to result in much human suffering.” (xli-xlii) The United States Court website has statistical tables regarding the filing of federal habeas petitions.18 The information about the exonerated individuals and the number of exonerations is from the Innocents Database.19 18 Statistical Tables for the Federal Judiciary, United States Courts, http://www.uscourts.gov/statistics-reports/analysis-reports/statisticaltables-federal-judiciary . (last viewed March 15, 2017) 19 Innocents Database, http://forejustice.org/exonerations.htm . (last viewed March 15, 2017) 25