
NYC DOC Commissioner Statement re 2014 Budget, 2013
Download original document:
Document text
Document text
This text is machine-read, and may contain errors. Check the original document to verify accuracy.
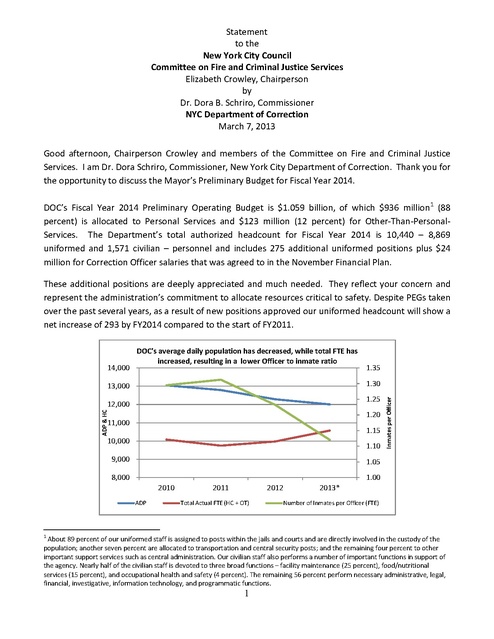
Statement
to the
New York City Council
Committee on Fire and Criminal Justice Services
Elizabeth Crowley, Chairperson
by
Dr. Dora B. Schriro, Commissioner
NYC Department of Correction
March 7, 2013

Good  afternoon,  Chairperson  Crowley  and  members  of  the  Committee  on  Fire  and  Criminal  Justice
Services.  I am Dr. Dora Schriro, Commissioner, New York City Department of Correction.  Thank you for
the opportunity to discuss the Mayor’s Preliminary Budget for Fiscal Year 2014.

DOC’s  Fiscal  Year  2014  Preliminary  Operating  Budget  is  $1.059  billion,  of  which  $936  million 1  (88
percent)  is  allocated  to  Personal  Services  and  $123  million  (12  percent)  for  Other‐Than‐Personal‐
Services.    The  Department’s  total  authorized  headcount  for  Fiscal  Year  2014  is  10,440  –  8,869
uniformed  and  1,571  civilian  –  personnel  and  includes  275  additional  uniformed  positions  plus  $24
million for Correction Officer salaries that was agreed to in the November Financial Plan.
These additional positions are deeply appreciated and much needed.  They reflect your concern and
represent the administration’s commitment to allocate resources critical to safety. Despite PEGs taken
over the past several years, as a result of new positions approved our uniformed headcount will show a
net increase of 293 by FY2014 compared to the start of FY2011.

 1.35
 1.30

 13,000

 1.25

ADP & HC

 12,000

 1.20

 11,000

 1.15

 10,000

 1.10

 9,000

Inmates per Officer

 14,000

DOC's average daily population has decreased, while total FTE has
increased, resulting in a  lower Officer to inmate ratio

 1.05

 8,000

 1.00
2010
ADP

2011

2012

Total Actual FTE (HC + OT)

2013*

Number of Inmates per Officer (FTE)


1

 About 89 percent of our uniformed staff is assigned to posts within the jails and courts and are directly involved in the custody of the
population; another seven percent are allocated to transportation and central security posts; and the remaining four percent to other
important support services such as central administration. Our civilian staff also performs a number of important functions in support of
the agency. Nearly half of the civilian staff is devoted to three broad functions – facility maintenance (25 percent), food/nutritional
services (15 percent), and occupational health and safety (4 percent). The remaining 56 percent perform necessary administrative, legal,
financial, investigative, information technology, and programmatic functions.

1

We are hiring more officers, more often.
We received authorization in FY 2012 to hire recruits to keep pace with attrition, instead of waiting for
vacancies to build up. This is important.  It means that on average, over the course of a year, we will
never have a vacancy.
It  has  also  been  quite  an  undertaking.    Since  then,  six  classes  –  up  to  300  recruits  per  class  –  have
graduated close to 1,500 probationary Correction Officers2  and a seventh class is about to begin next
month.  These  six  classes  amount  to  more  than  all  of  the  recruits  we  hired  during  the  previous  four
fiscal years combined and we plan to continue to hire at the same aggressive rate in Fiscal Year 2014.
By this summer, the Department will have also hired all of the 275 additional uniformed staff included
in  the  Mayor’s  FY2014  Preliminary  Budget3.    It  is  then  that  we  will  have  caught  up  and  then,  will
continue to keep pace with retirements and resignations.
We are filling more posts on straight‐time instead of overtime.
It is always preferable to have permanently‐assigned officers work steady posts in our jails. It’s the best
way  to  ensure  that  each  member  of  service  learns  everything  he  or  she  needs  to  know  about  the
inmates under his or her supervision and the security issues associated with that post.  By the end of
Fiscal  Year  2014,  the  additional  headcount  we  received  combined  with  our  new  hiring  schedule  will
permit  us  to  operate  on  average  110  more  posts  on  straight  time,  just  about  80  percent  of  the  136
posts that would otherwise be run on overtime.
We have a viable plan in place to cut overtime spending in half by the end of FY2014.
We will cut overtime spending in half from current levels and increase our available staffing levels by
continuing to bring on new recruits faster than we expect existing staff to retire (or resign).  Up until
last year, our hiring schedule only allowed for recruit classes to come on board if we had vacancies to
fill.    The  delay  between  each  position  being  vacated  and  then  filled  with  a  new  recruit  generates
overtime, as does  the first 16 weeks after that  vacancy is filled because the recruit is assigned first to
the Academy and only after graduation, to a jail to work a post.    The cost to transition from the old to
new way of hiring will be cost neutral by the end of the next fiscal year (FY2014).
In  addition,  ongoing  efforts  to  ensure  that  overtime,  when  used,  is  being  used  in  the  most  efficient
manner  possible,  will  continue.  These  efforts,  which  require  careful  consideration  by  uniformed
managers  include  personnel  reviews  within  each  jail  by  the  warden  and  his  or  her  team  and  then
further assessment by the Chiefs.


2

 This figure includes three classes in Fiscal Year 2012 (573 Correction Officers), two classes so far this fiscal year (596 Correction Officers)
and one additional class graduating on April 25 (308 Correction Officers).
3
 As of the March 1st payroll, DOC employs 8,820 uniformed staff and 1,375 civilian personnel.

2


Overtime Spending Projection
$180,000,000
$160,000,000
$140,000,000

$30 million due to recruit training

$120,000,000

Overtime Spending (Dollars)

$18 million due to recruit training

$100,000,000
Beginning Budget (incl PS
Surplus)

$80,000,000

Revised Budget (incl New
Needs)

$60,000,000
$40,000,000
$20,000,000
$0
FY2010  FY2011  FY2012  FY2013  FY2014  FY2015


Like  all  other  city  agencies,  DOC  must  still  do  its  part  to  contain  the  growth  in  City  expenses.  The
Department’s  cost  saving  measures  included  in  the  Mayor’s  Preliminary  Budget  total  $41.4  million
(four percent of the total operating budget) in Fiscal Year 2014.  Aside from ongoing efforts that enable
us to redeploy more uniformed staff to security posts, we are eliminating over 100 Civilian positions by
identifying  existing  long‐term  vacancies,  as  well  as    achieving  other  staffing  efficiencies  such  as
redeploying tradespersons within our Support Services Division consistent with the workload.  We will
continue to work diligently to identify more areas for consolidation and additional efficiencies, while
still providing a safe and secure environment in which to work and for those in our custody.
In addition to the initiatives submitted during the financial plan process, we continue making progress
towards more efficient operations in other areas as well, such as energy efficiency.  We have reduced
our energy costs by more than $600,000 during the first six months of Fiscal Year 2013 when compared
to  the  same  time  period  last  year.    This  is  on  top  of  a  reduction  of  $1.4  million  in  Fiscal  Year  2012
compared to the previous fiscal year, for a two year savings of more than $2 million. These cost savings
are  due,  in part,  to  ongoing  lighting  retrofits throughout  our  facilities,  steam pipe  insulation  and the
opening of an energy‐efficient, central laundry facility.
The Capital Budget
In addition to the annual operating budget, the Mayor’s Preliminary Budget includes the FY 2013‐2023
Ten‐Year  Capital  Strategy  of $1.38  billion,  funding  critical  to  maintain  existing  facilities  and  complete
important capital projects through the remainder of FY2013 and in FY2014 ($1.02 billion).
Our capital plan includes $151 million to replace fire safety systems and to address other critical fire
safety  conditions;  $176  million  for  critical  infrastructure  projects  including  heating,  ventilation,
3

plumbing, and other structural upgrades; $58 million for IT infrastructure projects, including $7 million
for  the  installation  of  additional  cameras  throughout  our  facilities,  and  $22  million  for  critical
contraband  detection  security  equipment  and  state‐of‐art  radios  and  personal  body  alarms  that  will
enhance communications and further everyone’s safety and wellbeing.
Between FY2006 and FY2009, DOC registered $46.4 million capital dollars on average annually.  Since
FY2010,  we  have  increased  our  capital  registrations  to  an  annual  average  of  $79.7  million.  And  in
FY2013  to  date  we  surpassed  that  annual  average  and  have  registered  $89.7  million  as  of  March  1.
These funds are being used to fully resolve longstanding commitments – fire safety projects, as well as
other  critical  projects  impacting  sanitation,  ventilation  and  lighting,  which  are  also  driven  by  the
Benjamin litigation.
Since  our  last  budget  briefing  in  June  we  have  made  considerable  progress  installing  fire  alarm
systems, with significant headway towards fully operational systems in three facilities (AMKC, MDC and
RNDC), and work begun in two additional facilities (OBCC and QDC). Despite set‐backs due to budget
constraints, we will have begun installation of fire alarm systems in every jail that requires a fire alarm
system by the end of this calendar year 4. Approximately two thirds of inmate housing areas will have
fire alarms by the end of calendar year 2013, and the remaining areas will be completed in 2014 and
2015 5.
DOC  also  continues  to  aggressively  pursue  rehabilitation  projects  in  shower  areas  to  help  improve
sanitation conditions in the jails; we have completed renovations in 116 out of 181 housing areas. We
will complete the renovations in the remaining areas by the end of this calendar year.
The  Department  also  developed  a  plan  to  address  decommissioning  of  our  most  obsolete  housing
stock.  Out  of  a  total  of  74  existing  modular  and  sprung  structures,  we plan  to  demolish  all  but  nine
housing structures. Thirty‐five units including 25 sprungs and 10 modular structures are no longer fit
for confinement and they have been vacated. We expect to demolish these 35 units and an additional
30  structures  by  the  time  the  new  Rikers Island  facility  opens  in  2018 6.  The  only  modular  structures
that will remain in our inventory upon the completion of the demolitions will be those nine that are
solid steel structures.
In addition to the Department’s many maintenance and upkeep projects within our jails, we continue
to invest in our infrastructure and the future of Rikers Island.  Later this year, we will break ground for
a new Rikers Island facility. Funding totaling $626.5 million is available for this project, of which $34.1
million  has  been  committed  since  last  fiscal  year  for  design.    The  new  jail,  capacity  1,500  beds,  will
serve as the central admissions center for all male inmates on Rikers Island and will include a 225‐bed
infirmary and an expanded detox unit.  The project also includes a central storage facility that will be
4

 DOC has operational fire alarm systems at BKDC, NIC and GRVC. AMKC and NIC are also receiving full fire life safety upgrades this year,
which includes sprinklers and improved fire smoke separation. Fire alarm installation will start at RMSC, GMDC, VCBC and EMTC, pending
completion of current projects
5
285 housing areas will have operational fire alarm system by the end of calendar year 2013. An additional 130 housing areas will receive
operational fire alarm systems by 2014 and the remaining 45 housing areas will be completed by 2015.
6
 These 30 remaining modular structures are currently vital as swing space while we complete important fire safety and sanitation
projects.

4

located  adjacent  to  the  visitor  registration  center  and  will  greatly  improve  storage  and  retrieval  of
inmate property.
Lastly,  funding  in  our  capital  budget  will  enable  us  to  continue  upgrading  security  equipment  by
acquiring  four  additional  full‐body  imaging  scanners  (for  a  total  of  10)  so  that  more  jails  can  better
intercept dangerous contraband on – and in – inmates that cannot be detected by other means.
Super Storm Sandy


I’d like to take this opportunity to recognize again the resourcefulness and resiliency of our workforce
before, during and after Super Storm Sandy, as evidenced by uninterrupted operations on the island.
We did not lose power, we had ample food and medical supplies and staff did its level best to report to
work. In fact, we were able to respond immediately to affected communities throughout the city and
lend  assistance  in  Sandy’s  aftermath.    Correction  Officers  provided  security  at  relief  stations,
transported  relief  workers,  and  delivered  foodstuffs  and  other  emergency  relief  supplies.    We
laundered  clothes  for  thousands  of  New  York  City  families  temporarily  residing  in  shelters  after  the
storm  and  participated  in  other  meaningful  ways.    They  perform  with  excellence  in  good  times  and
bad.
Still, Sandy did take a toll that needs to be addressed. The Mayor’s Preliminary Capital Budget provides
the Department $68.6 million to assess, repair and recover from the damage we sustained.  Although
5

all of the jails on Rikers Island are at elevations of 15 feet or more and did not suffer any damage, the
northern shore line lost about 4 acres of land, and a number of trailers along that road are now close
to the water. We have assessed the condition of the trailers, decommissioned four of them, and can
say  with  certainty after inspections by  an  engineering firm  that  the  remainder  is  safe for  occupancy.
The Buildings Department and PESH have also looked at the Donald Cranston Justice Center, the most
heavily used of the affected trailers.  Nonetheless, in anticipation of future storms, we are planning the
relocation of all of the units occupying these trailers 7 and the overall area is continuously monitored to
ensure  ongoing  safety.    Also  on  Rikers  Island,  the  Anna  M.  Kross  Center  sustained  significant  roof
damage. To ensure minimal impact on our operations, we retained a design consultant so that a new
roof can be installed expeditiously. Off island, the electrical substation for the Vernon C. Bain Center,
the City’s jail barge located in the Hunts Point section of the Bronx, should be raised to meet FEMA’s
new floodplain standards.  We also retained a consultant to evaluate the current grade of the parking
lot  and  visitor’s  access.    We  are  working  very  closely  with  OMB  and  FEMA  to  ensure  that  the  City
recovers all the costs the Department incurred related to this disaster.  Going forward, the new FEMA
advisory data confirms that Rikers Island can continue to withstand a Category 4 hurricane.
Safety and Security
Our core mission is care, custody and control. The work is three‐fold: To provide the necessary care to
ensure the safety and well‐being of both the prisoners in our custody and the personnel who supervise
them;  to  meet,  if  not  exceed,  the  conditions  of  incarceration  as  set  out  in  statute  and  minimum
standards;  and  to  manage  the  population  by  the  most  effective  and  efficient  means  to  protect  the
public at large.
The department has two key security indicators – Uses of Force (and its subsets, Assaults on Staff and
Serious Injuries to Staff assaulted) and Inmate‐on‐Inmate violence (and its subset, Serious Injuries to
Inmates). Both of them generally are triggered by an incident involving one or more inmates – either
an assault on staff or a fight between or an assault on other inmate(s).

Uses of Force
The total number of Uses of Force A (any injury to either an officer or inmate requiring more than basic
first aid) decreased 30 percent (from 52 to 40) during the PMMR reporting period. The total number of
Uses of Force C (no injury to either an officer or inmate) increased 66 percent (from 291 to 484) during
the PMMR reporting period. This is good news.

Although  uses  of  force  with  serious  injuries  decreased  and  incidents  with  no  injuries  increased,  the
total number of incidents and allegations of Uses of Force has gone up by about 400 incidents. About
half of the increase is attributable to the rise in Uses of Force C (193); the rest is due primarily to an
increase  of  200  Uses  of  Force  B  (an  injury  to  either  an  officer  or  inmate  requiring  basic  first  aid).
Lowering the number of UOF B is an area clearly in need of improvement and I am confident that we
can do it. During the PMMR period, we increased OC usage 63 percent and now fully 49 percent of all
7

 All units will be relocated out of the north shoreline by August 2013.

6

uses of force utilize OC only, eliminating any physical contact. Likewise, 49 percent of all uses of force
resulted in no injury to anyone.  Continuing to use OC as often and as soon as warranted, is expected
to result in more responses with no injury and fewer with minor injury. We have already fine tuned the
instruction  provided  to  emphasize  earlier  intervention  in  the  UOF  training.    Efforts  like  these  have
already produced measurable results in CPSU where uses of force decreased by 31 percent during the
PMMR period.  Additional training and supervision to ensure all safety equipment is used as intended
is under way as well and should make a positive difference.

Indicator
Use of Force (UOF) A,B,C

Definition
FY12
FY13
% +/‐
UOF counts uses of force in response to inmate

misconduct and reflects the extent to which an injury was
sustained by the MOS and/or the inmate(s) involved in the
underlying incident or the UOF that followed.
UOF‐A
An injury requiring more than basic first aid
1.05
0.83
‐21%
(Serious Injury)


Rate:  1000 ADP
n=
52
40
‐30%
UOF‐B
An injury requiring basic first aid only
7.09  11.38
61%
(Minor Injury)


Rate:  1000 ADP
n=
351
551
57%
UOF‐C
No injury to anyone
5.88  10.00
70%
(No Injury)


Rate:  1000 ADP
n=
291
484
66%
Incidents and Allegations of UOF  All UOF plus allegations, included those determined to be
819  1213
48%
unfounded.
Assaults on Staff (AOS)
This indicator is a subset of Use of Force.  It is the force
3.8
4.3
15%
Rate:  1000 ADP
used by a MOS in response to an assault on uniformed
staff by one or more inmates.  The most common AOS
involve throwing a liquid or an article of clothing at an
officer and bodily physical force.

Assaults on Staff (and serious injury to an officer resulting from an Assault on Staff)
The total number of Assaults on Staff (any physical contact with an officer by an inmate or an object
thrown by an inmate) increased 9 percent during the PMMR reporting period from 186 to 204.  The
total  number  of  Assaults  on  Staff  resulting  in  a  serious  injury  to  an  officer  (an  injury  requiring  more
than  basic  first  aid)  decreased  by  9  percent  during  the  PMMR  period  from  13  to  12.8    Half  of  the
injuries to staff was sustained during the assault; the other half during the UOF that followed. Here,
too,  ensuring  OC  is  used  as  often  as  it  is  feasible  should  continue  to  lower  the  number  of  injuries
sustained by our staff.


8

 During PMMR FY12, 7 of the 13 AOS resulted in an A‐injury; the remaining 6 A‐injuries occurred during the UOF that followed. During
PMMR FY13, 6 of the 12 AOS resulted in an A‐injury; the remaining 6 A‐injuries occurred during the UOF that followed.

7

Indicator
Assaults on Staff (AOS)
Rate:  1000 ADP

Serious injury to staff as a
result of an inmate assault on
staff (AOS‐A)
Rate:  1000 ADP

Definition
FY12
FY13  % +/‐
This indicator is a subset of Use of Force.  It is the force
3.8
4.3
15%
used by a MOS in response to an assault on uniformed


staff by one or more inmates.  The most common AOS


involve throwing a liquid or an article of clothing at an


officer and bodily physical force.


n=
186
204
9%
AOS‐A is also a subset of Use of Force.  It is a serious
0.3
0.3  ‐11%
injury (any injury requiring more than basic first aid) to


either the MOS and/or the inmate(s) involved in the AOS


or UOF that followed.


  n=
13
12
‐9%
Assault
7
6
Use of Force followed
6
6


Violent Inmate‐on‐Inmate Incidents (and serious injuries to an inmate)
This indicator captures three types of incidents. They are fights, assaults, and assaults with a weapon (a
slashing or a stabbing). During the PMMR period, reported inmate‐on‐inmate incidents increased by 17
percent  or  170  incidents.  The  most  frequently  occurring  inmate‐on‐inmate  incident  is  fighting.
Together, fighting and assault9 make up 98 percent of all of these incidents.10 The number of serious
injuries to an inmate (an injury requiring more than basic first aid) as the result of an inmate‐on‐inmate
incident increased by 2, or 5 percent, from 40 to 42.

While assaults with weapons make up the remaining 2 percent, it is a growing number of incidents and
it is of great concern to us. Adolescents and M‐inmates are the most likely to engage in fights.  SRG
members are the inmates most often to assault other inmates, including assaults by means of slashing.
The next section highlights plans in place to addresses these concerns.

Indicator
Violent inmate‐on‐inmate
incidents
Rate:  1000 ADP
Serious injury to inmate (SITI)
as a result of violent inmate‐
on‐inmate incidents
Rate:  1000 ADP

Definition
FY12  FY13  % +/‐
There are 3 kinds of violent inmate‐on‐inmate incidents –
24.9  29.28
17%
fights, assaults, and slashings/stabbings.


Fight/Assaults  1120  1390
Slashing/Stabbing
15
27
A serious injury to an inmate as a result of a violent inmate‐
1.11
1.43
28%
on‐inmate incident – fight, assault, or slashing/stabbing – is


defined as an injury to an inmate that requires more than


basic first aid.  It is not the result of a UOF.


n=
40
42
5%


9

 A fight is an incident where two or more inmates assault one another. An assault is where one inmate attacks another who does not
reciprocate.
10
 The increase in the number of reported fights may be due in part to the installation of over additional 1200 cameras in housing units
and other areas of the jails to which inmates have access. Reviewing video on a daily basis has led to the identification of incidents that
occurred out of staff’s view. Similarly, as we identify more of the fights that occur, we are also issuing more infractions, holding more
inmates accountable.


8


Violence Prevention efforts
Four indicators capture several of the ways that the department strives to improve safety and security.
They  are  jail‐based  arrests  of  inmates,  fight  and  assault  infractions,  facility  searches,  and  weapons
confiscation.

Jail‐based  arrests  of  inmates  have  increased  by  33  percent  during  the  PMMR  period.  The  primary
reasons  for  inmate  arrests  are  contraband  (29%),  assault  on  staff  (28%),  and  obstruction  of
government  administration  (14%).  Half  of  the  contraband  arrests  were  for  weapons  and  a  third  for
drugs.

Infractions issued for fights and assaults increased by 23 percent. As noted above, we are identifying
more fights than before; the number of inmates participating in a fight has remained constant at 2 to 3
per incident.

Facility  searches  increased  by  1,930  and  yielded  a  similar  percent  increase  in  the  confiscation  of
weapons.  The  weapons  that  we  are  finding  have  changed  over  time.  Completing  maintenance  and
repair projects have eliminated much of the weapons‐grade material that had been used as weapons.
Now, we are intercepting appreciably more razor blades and scalpels.

Indicator
Jail‐based arrests of inmates

Fight/assault infractions
Searches
Weapons recovered

Definition
Arrests of inmates for jail‐based criminal incidents,
notably, Assaults on Staff, Contraband, Slashings,
Destruction of Property.
Jail‐based rules violation issued for fighting or assaulting
another inmate.
Search of a specific physical area within a correctional
facility (i.e., living quarter or common area).
Including:
Jail/prison shanks/shivs, factory manufactured knives,
razor type instruments, scalpels, hobby blades,
unsharpened metal, nails

FY12  FY13  % +/‐
220
292
33%

2287

2804

23%

77082  79012

3%

654

676

3%


Significant Additional Measures to Improve Safety and Security
The  inmate  population  is  increasingly  ‘jail‐wise’  and  with  more  time  in  detention,  they  have  more
opportunities to violate rules and regulations.  Over time, the average number of prior admissions to
jail has increased from 6.6 to 8.7 per inmate. Similarly, the percent of population with prior jail stays
has risen from 77 to 86 percent. Likewise, the average length of stay in detention continues upwards
from 47 to 53 days.

9

Population Demographics
FY 2002‐FY 2012
In FY2012, inmates had on average
15000

90
In FY2005, inmates had
on average 6.6 prior
admissions

14500
14,533

13,934

77.3%

77.2%

13,576

13,497

13,987

13,751

13500

83.3%

81.4%

81.3%

14000

84.4%

83.3%

75
70
13,362

65

13,049

60

12,790

12500

53.6

12000
47.6

48.8

47

48.3

85
80

13,849

13000

11500

86.3%

47.5

48.3

47.1

48.9

12,286

55

53.1  50

50.1

45
40

11000
FY 2002  FY 2003  FY 2004  FY 2005  FY 2006  FY 2007  FY 2008  FY 2009   FY 2010  FY 2011  FY 2012
Total ADP

Average length of stay

% of admissions with one or more prior arrests


Key  characteristics  of  the  population  contributing  to  institutional  misconduct  have  changed  as  well.
Over time, the percent of inmates in custody with a violent felony has increased from 31 to 39 percent
of the average daily population. The percent with a mental health diagnosis has grown as well from 24
to 36 percent. The percent of inmates with SRG affiliations has risen from 10 to 19 percent.

Population Demographics
FY 2005‐FY 2012
14,500
14,000

13,987
13,576

45%
13,849

13,497

13,362

13,500

37%

13,000
12,500

31%

31%

39%

39%

12,790

34%
32%

32%

33%

36%

12,286

40%
35%
30%

28%

12,000
11,500

37%

13,049

26%
24%

24%

25%

24%

11,000

20%
FY 2005

FY 2006
Total ADP

FY 2007

FY 2008

FY 2009

% of ADP with Violent Felony (Top Charge)

FY 2010

FY 2011

FY 2012

% of ADP with M‐diagnosis


A  number  of  measures  that  we  have  taken  are  applicable  to  all  inmates  and  they  are  taking  hold.
These  are  several  notable  examples.  To  ensure  sanctions  for  assaults  on  staff,  violent  inmate‐on‐
inmate  incidents  and  other  serious  rule  violations  are  imposed  in  a  swift  and  certain  manner;  we
increased the capacity of punitive segregation and within a year eliminated the longstanding backlog of
10

inmates  who  had  been  cleared  by  DOHMH,  the  first  time  in  anyone’s  recollection.    To  address  the
remaining  backlog made  up  of  inmates  with mental health  or  medical  conditions that preclude their
clearance, DOC along with DOHMH developed an alternative to MHAUII. Focusing first on adolescents,
the first restricted housing unit opened last May and since then, 173 have been transferred to the unit.
None of the young men who completed its 3‐step program has re‐infracted.  In October, we opened a
restricted housing unit for adult males. We are meeting with similar success.  Plans are underway to
expand its capacity this year.

 The  imposition  of  swift  and  certain  penalties  through  the  disciplinary  process  coupled  with  more
arrests and referrals for prosecution are critical.  Increasing activities to reduce idleness and build skills
critical to pro‐social problem solving in jail and after release, are also crucial.  DOC recently announced
several significant initiatives towards this end as well.  They include ABLE, a behavioral program for all
adolescents, 16 – 18 years of age; I‐CAN, discharge planning and preparation for inmates 19 years of
age  and  older  who  are  at  heightened  risk  of  returning  to  jail;  and  borough‐based  resource  hubs  to
identify earlier, prepare better and divert sooner a segment of the Brad H population who are at low to
moderate risk of reoffending, from jail to community‐based providers.

A  number  of  measures  that  we  have  put  into  place  have  been  tailored  specifically  to  improve
outcomes for inmates who disproportionately and repeatedly participate in incidents.  These inmates
are the mentally ill, 11 adolescents,12 and gang (SRG) members.13  I’ve already highlighted several of the
reforms  that  focus  on  M‐inmates.    Many  changes  have  also  been  instituted  at  RNDC  where  the
majority of adolescents are assigned. These include moving most of the population from dormitories to
cell  housing  areas,  increasing  uniformed  coverage  and  supervision,  exchanging  personal  clothing  for
uniform apparel and shoes, pushing up the curfew, adding an after‐school program provided by DOE,
providing behavioral programming every day to improve pro‐social problem‐solving, and adding both
an ombudsman and integrity control officer.  Early results have been promising and as the changes in
custody management take hold and the new programs are fully implemented, we are confident that
measurable improvements in jail safety and recidivism will be realized.

SRG‐involved inmates make up the third group that must be addressed.   Members of gangs and street
crews  are  increasingly  carrying  rivalries  from  the  community  into  the  correctional  system.  We  have
taken  a  number  of  steps  to  identify  gang  members  sooner,  develop  intelligence faster  and  intercept
their contraband more quickly to eliminate gang‐related violence. These steps include the acquisition
of  full‐body  scanners  similar  to  equipment  that  the  TSA  uses,  more  facility  and  visitor  searches
resulting in the confiscation of greater numbers of scalpels and razors, more arrests and referrals for

11

M‐inmates are most likely to participate spontaneously in incidents; they are 38 percent of the ADP and engage in 54 percent of all
incidents either as the perpetrator or victim. The disproportionate involvement is even more significant among the acutely mentally ill
who make up 6 percent of the ADP and are involved in 16 percent of all misconduct.
12
 Adolescents are spontaneous as well and are far more likely than adults to fight; they make up 6 percent of the ADP and participate in
28% of all fights.
13
 Gang members are the most likely to participate in premeditated assaults, particularly assaults with weapons.

11

prosecution,  an  agreement  by  the  Bronx  DA  to  seek  significant  penalties,  greater  coordination  with
NYPD, and the opening of a restricted housing unit for predators.

Going forward, we’re steadying‐up assignments to ensure regularly assigned and specially trained staff
is  consistently  assigned  to  special  units.  Both  K‐9  and  special  search  teams  will  be  expanded.  Every
initiative that has been put into place will be monitored closely for strict compliance.  Adjustments will
be made whenever warranted for optimal outcomes.

Recent, Unlawful Access to City Jails

Last Thursday evening, we became aware that the day before, an individual, posing as a Department of
Correction  investigator,  had  entered  and  exited  the  Manhattan  Detention  Center  without  being
detected at first.  Within hours, investigating officers from the Intelligence Unit identified the individual
as Matthew Matagrano, age 36.  The Chiefs distributed his picture to all of the jails and directed staff,
as a priority, to be on the lookout for him.  Late Friday afternoon, less than 24 hours later, Matagrano
entered the Bronx courthouse. One of our COs assigned to the court recognized him immediately and
called  for  assistance  while  two  other  COs  distracted  him.  Minutes  later,  several  of  our  captains
apprehended and held him.  The Intelligence Unit made the arrest.

The  DOC  investigation  has  turned  its  full  focus  and  resources  from  apprehending the  intruder  into a
complete and candid assessment of the entire matter:  What happened; how did it happen; what we
must  do  to  ensure  it  never  happens  again.   I  have  directed  that  each  of  the  facilities  submit  a  full
report.  Those reports are due on my desk by the close of business tomorrow.   The investigation must
and will be concluded as quickly as possible, but at the same time we can all agree that it must also be
accurate and thorough if we are going to get to the bottom of the matter and fix it in full.

This  does  not  mean that I  am  waiting  for  the  reports to  take  steps  right  away  to  improve  security –
and, in fact, we are doing just that.  In just the last few days, the Chief and Deputy Chief of Department
undertook a review of each jail’s security operating plans and personnel with the Supervising Wardens
and Wardens to ensure they meet the Department’s highest standards; Wardens and Deputy Wardens
for  Security have  been providing  additional security training  at  shift briefings;  and  all  of the  ID cards
issued by the Department to paralegals have been reviewed and the criteria narrowed; and consistent
with the new criteria, some are being revoked.

We will get to the bottom of this together, and together we will make sure this never happens again.

In Closing
Thank  you  for  your  time,  attention,  and  support.   We  welcome  your  input  and  are  ready  to  answer
your questions.

12