
Officer Shootings And Custodial Deaths, Texas Justice Initiative, 2018
Download original document:
Document text
Document text
This text is machine-read, and may contain errors. Check the original document to verify accuracy.
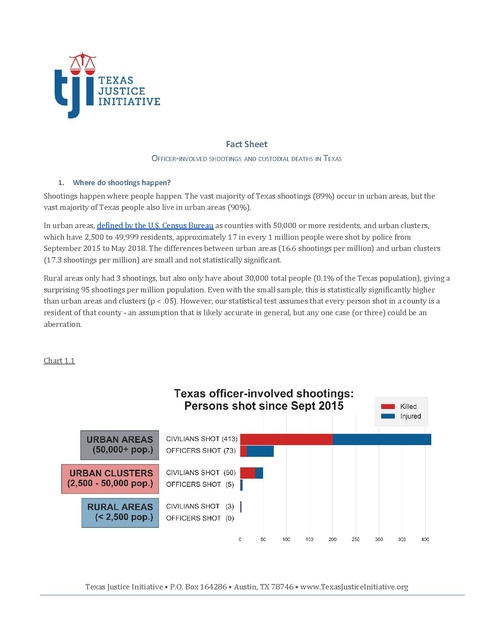
Fact Sheet OFFICER-INVOLVED SHOOTINGS AND CUSTODIAL DEATHS IN TEXAS 1. Where do shootings happen? Shootings happen where people happen. The vast majority of Texas shootings (89%) occur in urban areas, but the vast majority of Texas people also live in urban areas (90%). In urban areas, defined by the U.S. Census Bureau as counties with 50,000 or more residents, and urban clusters, which have 2,500 to 49,999 residents, approximately 17 in every 1 million people were shot by police from September 2015 to May 2018. The differences between urban areas (16.6 shootings per million) and urban clusters (17.3 shootings per million) are small and not statistically significant. Rural areas only had 3 shootings, but also only have about 30,000 total people (0.1% of the Texas population), giving a surprising 95 shootings per million population. Even with the small sample, this is statistically significantly higher than urban areas and clusters (p < .05). However, our statistical test assumes that every person shot in a county is a resident of that county - an assumption that is likely accurate in general, but any one case (or three) could be an aberration. Chart 1.1 Texas Justice Initiative • P.O. Box 164286 • Austin, TX 78746 • www.TexasJusticeInitiative.org Chart 1.2 2. Who are the officers involved in civilian shootings? Texas officers involved in shootings tend to be young men. Younger officers, particularly those under age 30, are disproportionately likely to be involved in shootings (p < 0.001) compared to Texas officers at large. While the racial makeup of officers in shootings is similar to that of officers at large, there are some small yet statistically significant differences (p < .05, χ2 = 9.60): More white and Hispanic officers, and fewer black and other-race officers, are reported in shootings than the general officer population. Most striking is the gender difference. Males are 88% of the Texas police force but comprise 97% of officers involved in shootings. This is highly significant (p < 0.001), especially considering that younger officers (who are disproportionately responding to calls) are even less male than the overall police force -- women comprise some 20% of new officers, but still only 3% of officers involved in shootings. Page 2 Chart 2.1 Chart 2.2 Page 3 Chart 2.3 3. What is a custodial death? A custodial death, or death in custody, is when a person dies in prison, jail, police custody, or while police are trying to arrest them. There are approximately 600 custodial deaths in Texas every year. The vast majority (about 90%) of deaths in prison are reportedly from “natural causes.” Deaths in police custody are generally from shootings with police, categorized as “justifiable homicides.” On average, 100 people die in Texas jails each year, 26% of whom die from suicide (nearly all from hanging). Chart 3.1 Page 4 4. How are jail deaths related to an inmate’s cell type? Looking more closely at jail suicides reveals a relationship with how the inmate is housed. Deaths of people in solitary cells are much more frequently caused by suicide - nearly half (p < 0.001). Chart 4.1 5. Are officer-involved shootings on the rise? We have two sources of data on civilians shot by police: Peace Officer Involved Shooting Reports - reports on fatal and non-fatal shootings filed with the Texas Office of the Attorney General since September 2015 - and Custodial Death Reports, consistently collected since 2005. To count officers who are shot on the job, we refer to the Peace Officer Involved Shooting Reports and the Officer Down Memorial Page, a database of line-of-duty officer deaths dating back more than a century run by a nonprofit organization. The red line in Chart 5.1, which plots data from Custodial Death Reports, shows an upward trend in state-reported shootings of civilians by police -- a trend that is highly statistically significant (p < 0.001, pearson r = 0.86). Chart 5.2 shows monthly data from the Peace Officer Involved Shooting Report, which goes back to September 2015. This report includes civilians who are shot fatally and non-fatally. This chart suggests a vague downward trend, but is not statistically significant (p = 0.24, pearson r = -0.21). Page 5 Chart 5.1 Chart 5.2 Page 6 6. In what ways do officers die on duty? From the Officer Down Memorial Page, we can see that - in addition to gunfire and violence - a large threat to police officers’ lives is one that civilians also face: Driving in a car. It’s also worth noting that the total number of deaths, about 15 per year, is small relative to the number of officers in Texas (75,000). Chart 6.1 7. How diverse is the Texas police force? These charts show that officers who recently joined the force are more demographically diverse than officers with longer tenures. Two plausible explanations emerge here. First, it could be that women and minority officers are increasingly joining Texas law enforcement agencies. Second, it could be that women and minority officers leave police work at much higher rates than whites and men. Note that this is not data for all officers who have ever enlisted in Texas -- it is data for current officers. To answer the question definitively, we would need records for all persons who belonged to the Texas police force each year, to track when they joined and departed. Page 7 Chart 7.1 Page 8 Chart 7.2 The Texas Justice Initiative is a nonprofit organization aimed at increasing transparency and accountability in the Texas criminal justice system. The author of this Fact Sheet, Everett Wetchler, is a PhD candidate in social psychology at the University of California, Berkeley. He previously worked as a software engineer for Google, then as CTO of the data science nonprofit Bayes Impact. There, he helped build URSUS — a data collection platform for police use of force in California. Note: For these and other findings, many explanations might account for the differences observed. We aim only to describe the differences and their statistical significance. Page 9