
Palantir secret user manual for police officers
Download original document:
Document text
Document text
This text is machine-read, and may contain errors. Check the original document to verify accuracy.
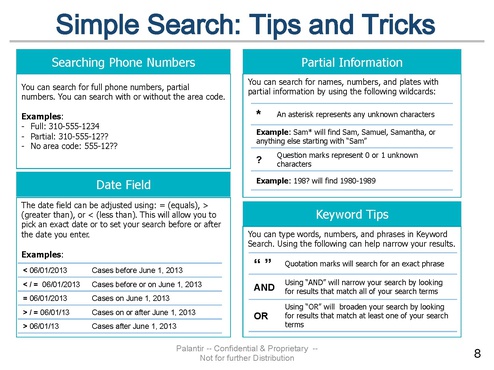
Searching Phone Numbers
You can search for full phone numbers, partial
numbers. You can search with or without the area code.
Examples:
-  Full: 310-555-1234
-  Partial: 310-555-12??
-  No area code: 555-12??

Partial Information
You can search for names, numbers, and plates with
partial information by using the following wildcards:

*

Example: Sam* will find Sam, Samuel, Samantha, or
anything else starting with “Sam”

?

Date Field
The date field can be adjusted using: = (equals), >
(greater than), or < (less than). This will allow you to
pick an exact date or to set your search before or after
the date you enter.
Examples:
< 06/01/2013

Cases before June 1, 2013

< / = 06/01/2013

Cases before or on June 1, 2013

= 06/01/2013

Cases on June 1, 2013

> / = 06/01/13

Cases on or after June 1, 2013

> 06/01/13

Cases after June 1, 2013

An asterisk represents any unknown characters

Question marks represent 0 or 1 unknown
characters

Example: 198? will find 1980-1989

Keyword Tips
You can type words, numbers, and phrases in Keyword
Search. Using the following can help narrow your results.

“”

Quotation marks will search for an exact phrase

AND

Using “AND” will narrow your search by looking
for results that match all of your search terms

OR

Using “OR” will broaden your search by looking
for results that match at least one of your search
terms

Searching for Person Records in Palantir
Start

1

Start in the
Graph application.

Type the reason for the search in the Search
Purpose field.
This could be the
case number or a
suspect name. This
part is required.

4

Type the name of the
suspect and any other
information in the next
fields.

If the Easy Search helper is open, go to step 2

If not, click the
Helpers toolbar, then
click Easy Search to
open it.

2

3

The Easy Search helper opens to the right.

Palantir returns any
records that match
these fields.

When you first open
the helper, it should
look like this.
If you don’t see the
name field, click the
person icon to see
person search fields.

5

Click the gear icon
to choose which
data to search.
Make sure that
Palantir is checked.
Click the gear icon again to close the menu.

Palantir -- Confidential & Proprietary -- Not for Distribution

Next page

8

Palantir -- Confidential & Proprietary -- Not for Distribution

6

7

8

Click Run Search.

9

Select any results that
are relevant to your search.
Press Ctrl + A to select all results,
or hold down Ctrl + Click to select
results one at a time.

The results that appear are
from LAPD and LASD data
sources, and include person
records linked to crimes,
citations, and arrests.

Click a result to open a preview window, which
shows all the information in the record.

You can also click a result, hold
down Shift, and click another
result to select several results
in a row.

10 You can either click and drag
the selected results to the
Graph, or click Import.

Stop

With the records on the Graph you can:
•
•

Read through the preview, and make sure the record
is about your suspect.

9

View them with the Histogram to decide if they
are the same person, then resolve them together
into one record (See page 14)
SearchAround to find other linked records

Finding Persons Related to a Vehicle
Start

1

Start in the
Graph application.

3

2

Type the reason for the search in the Search
Purpose field. This could be the case number or a
suspect name. This part is required.

If the Easy Search Helper is open, go to step 2.

If not, click the
Helpers toolbar, then
click Easy Search to
open it.

Type the license plate number in the next field.

The Easy Search helper opens at the right.

When you first open
the helper, it should
look like this.
If you don’t see the
license plate field,
click the car icon to
see vehicle search
fields.

11

4 Click the gear icon
to choose which
data to search.

Make sure that Palantir
is checked.
Click the gear icon again to close the menu.
Palantir -- Confidential & Proprietary -- Not for Distribution

Next page

12

Palantir -- Confidential & Proprietary -- Not for Distribution

5

6

Click
Run Search.

7

If all of the records are for your
suspect vehicle, press Ctrl + A
to quickly select them all.

The search runs, and returns any matching vehicle
records that are already in Palantir.
The green box at the
top of the helper lists
how many results
returned for each data
source you selected
from the gear menu.
The results show if the
vehicle appeared in any
crimes, arrests, field
interviews, incidents, or
citations, across both
LAPD and LASD sources
simultaneously.

Select all of the matching
records for this license plate.

8

Click Import. The records
appear on your Graph.

9

Select all of the records on
the graph, then click and
drag them onto the Browser
application.

The list of results appears in
the folder panel at the left.

This could be a lot of results, so make your searches
as detailed as possible!

Tip!

Notice that since we’re running a Vehicle Easy
Search, only Vehicle records appear in the search
results.

Tip! If you don’t see the Folders helper,
click the Folders icon.
Next page

Palantir -- Confidential & Proprietary -- Not for Distribution

5

Read through each record to make sure they’re the
same vehicle.
Make note of
any records that
are not related
to your vehicle.

6

Go back to the
Graph application.

8

13

Select the resulting
record, then
right-click it.
Go to
SearchAround
in the right-click
menu, and click Entities.

10 Any Person objects related to the vehicle from LAPD
or LASD reporting appears on the Graph.

If any records were not about your suspect vehicle,
move them to the side, or delete them from the
Graph.

7

Select all of the records that are about your suspect
vehicle, then right-click on the Graph, and click
Resolve.

The different records
you selected are
combined into one record.

Stop From here, you can:
• Determine if all of the Person records are for the
same suspect, and resolve them together. (Go to
page 14)
• Generate a report containing the vehicle and the
people linked to it (Go to page 10)

Resolving Person Records
Start

1

2

Start in the
Graph application.
Start with several Person
records about your
suspect on the Graph
application.

If the Histogram helper is
open, skip to the next
step.
If not, click the Helpers
toolbar, then click
Histogram to open it.

3

Select all of the Person
records that you want
to look at.

4

14

The Histogram helper updates
to show how often the
records you selected had
the same property values.

5 Look for bars that
show that more than
one record had the
same property.
If several records
have the same name,
DOB, and license
number, they are
probably for the same
person.

Tip! Start by looking for unique identifying numbers, such
as a Social Security or Driver’s license number.
Palantir -- Confidential & Proprietary -- Not for Distribution

Next page

Palantir -- Confidential & Proprietary -- Not for Distribution

6

Click on a bar that has multiple records to select
those records.
Once you select some
records, you can rightclick and select Drill
Down to build a Histogram
that shows the property
frequencies for just those
records.

8

15

Choose the name which
contains the most info
for the combined object.
By default, Palantir
chooses the longest title.

9

The objects are combined into one record that
contains all of the information from the original
separate records.

You can also right-click
and Build Folder from
Current Selection to
read the record details
to make sure they are about the same person.

7

Once you’ve made sure that the records are for the
same person, select those records on the Graph, and
then right-click them.

From the
right-click menu,
click Resolve.

If there are more records that relate to the same
person, repeat the process from step 3.

Stop When you are finished, you should have one record
for your suspect that contains all of their
information.
From here, you can:
• Generate a Person Report (Go to page 10)
• SearchAround for related events and entities

HISTOGRAM HELPER
VIEW AND COMPARE OBJECT, PROPERTY, AND LINK FREQUENCY

HISTOGRAM
HELPER
OVERVIEW

Comparative Analysis at a Glance
The Histogram helper caluclates and displays the frequency of individual
Objects, Properties, and Link types selected in the current application. Use the
Histogram helper to select subsets of Objects, Properties, or Link types. The
selection in the application will reflect the selected subset. Use the Histogram
helper to identify correlations between Objects and Properties, connections
between Objects, and trends among activities and behaviors in investigations.

Integrates with the Following Applications: Browser, Graph, Map

Copyright © 2016 Palantir USG, Inc. All rights reserved. The information herein contains trade secrets and
commercial or financial information which is privileged and confidential within the meaning of all relevant laws.
This information shall not be disclosed without the prior written approval of Palantir USG. The data subject to
this restriction are contained in all sheets of this proposal.

Palo Alto • Los Angeles • McLean • New York • Ottawa • London
Rome • Abu Dhabi • Singapore • Canberra • Wellington

Palantir USG, Inc. / Histogram Helper

HELPER LAYOUT

The Histogram helper is available in the Browser, Graph and Map applications
and is composed of two types of panels: Object Types and Properties. The
Object Type panel displays Object (e.g. Entity, Event, or Document) frequency.
Click the arrow next to the Object type to see view the frequency broken down by
Object subtype (e.g., Arrest and Attack are subtypes of the Event Objects).
There are three Properties panels, each corresponding to a specific Object type
from the Object Type panel (e.g., Entity, Events, and Documents). Each
Properties panel shows the frequency of the individual properties associated with
that Object type. For example, if Entity Objects include people, the properties
panel may display the frequency of a specific address, email account, or gender.

The use or disclosure of data contained in this sheet is subject to the restrictions on the title page of this document.

2

Palantir USG, Inc. / Histogram Helper

WORKFLOW:
SELECTING
OBJECTS FOR
FREQUENCY
ANALYSIS

Use the Histogram Helper
To use the Histogram helper, click on the Helpers dropdown menu in the top left
of the workspace and select Histogram. Alternatively, the hotkey Ctrl+Shift+H
launches the Histogram helper. The helper panel will appear on the right of the
workspace.
Add all desired Objects to the active application and ensure they are currently
selected. Click and drag the mouse over the Objects you wish to select.
Additional Objects can be added by holding the Ctrl key and clicking on the
desired Objects.

The use or disclosure of data contained in this sheet is subject to the restrictions on the title page of this document.

3

Palantir USG, Inc. / Histogram Helper

WORKFLOW:
MODIFYING THE
DISPLAY OF
DATA

The Histogram helper will automatically display the frequency of the selected
Objects and their Properties and Links. Frequencies are displayed as bars and
integers. Use the dropdown menu at the top left of the helper to sort Objects,
Properties, and Links by frequency.

Adjusting the Number of Objects and Events Displayed
Use the dropdown menu in the upper right of the helper to adjust the number of
Objects, Properties, or Links displayed. The default setting for this menu is three.
If there are more than three Object or Property types, only the three most
frequent will be displayed unless the number is adjusted.
Use the Show More button under each Object Type subsection to view the
frequency of additional Object subtypes. Click the Show Fewer button to collapse
the viewable data set.

The use or disclosure of data contained in this sheet is subject to the restrictions on the title page of this document.

4

Palantir USG, Inc. / Histogram Helper

To collapse any subsection, click the arrow to the left of the section title (Entity
Types, Event Types, or Document Types), highlighted in the image below. The
total number of subtypes under that particular Object or Property will still display.
In the image below, the number 8 next to Event Types indicates there are 8
subtypes, but the individual subtypes, such as Arrest and Attack, are no longer
visible. To view the subtypes, click the arrow.

WORKFLOW:
ANALYZING A
SPECIFIC
SUBSET OF DATA

To select a specific subset of Objects in the Histogram helper, click the desired
subtype or select a subset of the Objects in the active application. In the diagram
below, the user clicked the Person subtype and the corresponding Person
Objects are now selected in the active application.
Change the selection by clicking another Object or Property type. To select
multiple Object or Property types, press and hold the Ctrl key while clicking the
desired Objects or Properties.
Selected Objects and Properties may be brought into other applications in the
workspace by clicking the selected Objects or Properties and dragging them over
the application’s icon at the top of the workspace.
To clear selection(s), click the Clear Selection button at the top of each panel of
the helper, shown in the image below.

The use or disclosure of data contained in this sheet is subject to the restrictions on the title page of this document.

5

Palantir USG, Inc. / Histogram Helper

Drill Down
To closely examine a single Object, Property, or Link category, right-click on on
the desired heading. Select Drill Down to Current Selection. This will refresh the
histogram to include only the information associated with the selection.

In the image below, the Histogram helper has drilled down on the All Events
Entity type. The helper panels automatically repopulate, and only the Properties
and Links associated with the All Events subset are visible.

The use or disclosure of data contained in this sheet is subject to the restrictions on the title page of this document.

6

Palantir USG, Inc. / Histogram Helper

WORKFLOW:
BUILDING
FOLDERS OF
DATA SETS

Right-click on an Object set in the Histogram helper to bring up the Histogram
Context menu and select Build a Folder from Current Selection. A folder will be
created in the Folders helper containing the Virtual Dossiers of the selected
Objects.

Restricting Data Sets
To remove data superfluous to an investigation, right-click on the Objects in the
Histogram helper. The Histogram Context menu will appear. Click Remove Other
Objects in Histogram from Graph/Map.
This option is not available in the Browser application.

The use or disclosure of data contained in this sheet is subject to the restrictions on the title page of this document.

7

Palantir USG, Inc. / Histogram Helper

WORKFLOW:
COLLABORATION

Exporting Data as Plain Text
Right-click on an Object set in the Histogram helper to bring up the Histogram
Context menu and click Copy Selected. This allows you to paste the selected text
into a text document, table, or spreadsheet.

To select multiple entires, hold the Ctrl key and click the desired Objects. Rightclick on one of the selected Objects to bring up the Histogram Context menu and
click Copy All Visible to copy the selected to a text document, table, or
spreadsheet.
Exporting Data as a Comma Separated Values File
Select the desired Objects in the Histogram helper as described above. Rightclick on a selected Object. Click Copy Selected Bucket Names to CSV. Rightclick into a .csv file and choose Paste to copy selected items into the Comma
Separated Values File.
Export to Excel
Hold the Ctrl key and click to select multiple Objects. Right-click to open the
Histogram Context menu, and click to select Export to Excel or Export All Visible
to Excel. The spreadsheet will appear automatically.


The use or disclosure of data contained in this sheet is subject to the restrictions on the title page of this document.

8

Map Application: Basics

2

1
2
Tip!

3

5

4

To pan in the Map, click the right
mouse button and drag left, right,
up or down.

7

1

The toolbar is at the top of the Map.

2

Map history records each location change. You can use
the back/forward button to toggle between map views.

3

5

6

Select allows you to select points of interest on your map.
You can also do this by clicking on the points on the map.
Ctrl+A will select all data points on your map.

4

Zoom allows you to zoom in on a map point. You can also
use the scroll wheel on your mouse to zoom in/out.

5

Geosearches: The purple radius, polygon, route, or recent
buttons allow you to draw a shape and search for
objects/properties that are within the search area.

6

Presentation features: Use the blue buttons to draw, add a
text box, or insert an image into your Map.

7

Snapshot/camera: Use the camera button to take a picture
of your map to save it/export later.

Palantir -- Confidential & Proprietary -- Not for Distribution

Heatmap Helper
1

5

2

3
4

1

Use the Heatmap Helper to create a
heatmap visualization that displays
concentrations of objects or properties on the
map.

2

To turn the heatmap on or off, click the
Show/Hide Heatmap button in the top right
corner of the helper panel.

3

The Data panel allows you to show how data
points should be used when generating the
heatmap.

4

The Legend panel allows you to change how
you view heatmap info. The density radius
slider allows you to change the displayed
radius of each data point.

4

Palantir -- Confidential & Proprietary -- Not for Distribution

ALPR Search Helper
1

2
3
4
5

7

6
9

8

10
11

1

Drop an object here to search for it.

2

Click to switch between using normal ALPR search
or ALPR with geo search properties.

3

Enter your search purpose for auditing. This
should be a DR or case number.

4

Enter an address to search around with city and
state.

5

Paste geo coordinates, or allow this to auto-fill
from the address field.

6

Change the radius size.

7

Change the radius units.

8

Center on the selected point.

9

Enter a license plate to search for.

10 Enter a start date, an end date, both, or neither.
12

6

11 Reset. Clear all search criteria.
12 Run the search.
Palantir -- Confidential & Proprietary -- Not for Distribution

1

ALPR Search Helper
Results

2

1

3

2
4

Go back to change the search criteria.
Find matching text in the search results.

3

Sort results by this field.
Click again to reverse the order.

4

Search results. Click to view larger or to
select.

5

Import the selected ALPR records.

5

Palantir -- Confidential & Proprietary -- Not for Distribution

7


OBJECT EXPLORER
Navigation

2

Types Histogram

3

Drill down History

3

Features

4

Visualizations

4

Searching Text

4

Property Value Histogram

5

Timeline

6

Time Wheel

7

Link Type Histogram

8

Branching History Helper

8

Group By

9

Chart

10

Combining Object Sets

11

Transfering Objets to and From Object Explorer

12

Bulk data export to Excel

13

Copyright © 2016 Palantir USG, Inc. All rights reserved. The information herein contains trade secrets and
commercial or financial information which is privileged and confidential within the meaning of all relevant laws.
This information shall not be disclosed without the prior written approval of Palantir USG. The data subject to this
restriction are contained in all sheets of this proposal.

Palo Alto • Los Angeles • McLean • New York • Ottawa • London
Rome • Abu Dhabi • Singapore • Canberra • Wellington

Palantir USG, Inc. / Object Explorer


NAVIGATION

Object Explorer (OE) allows you to explore large sets of data to identify relevant
subsets, calculate statistics, or export data outside of Palantir for further
manipluation.
You can begin by clicking the Explore All Objects button. This will display a snapshot
of all data currently stored in Palantir.

Drill down breadcrumbs show filters applied to
object sets

Select visualizations,
filters, or analytical tools
here.

Types Histogram lists
the number of
objects that include
each property type

If you ever want to restart your exploration and return to the view of all objects
currently stored in Palantir, click the click the “New Formula” button at the top-right
and choose Explore All Objects.

The use or disclosure of data contained in this sheet is subject to the restrictions on the title page of this document.

2

Palantir USG, Inc. / Object Explorer


Types Histogram
The Types Histogram, found on the right side of OE, displays aggregate object counts
by object type and property type. The example on the right shows a data set that
includes, among other things, a total of 2,850,899 entities. Of these entities, 1,451,566
are Vehicles, 1,346,598 are Persons, and so on.
To filter to any specific set of objects, double-click
the blue bar next to that object set. We refer to
this type of filtering as a drill down. For example:
to drill down on just the Organization entities,
double-click the blue bar to the right of the text
“Organization”.
After each drill down, the Types Histogram will
update to display data only for the drill down
subset.
You can also use the Types Histogram to filter to
objects that have particular property types. For
example, double clicking on the blue bar next to
the Incident Status label will drill down to only the
objects that posses an Incident Status property.
Objects lacking an Incident Status property will be
filtered out of the drill down set.

The use or disclosure of data contained in this sheet is subject to the restrictions on the title page of this document.

3

Palantir USG, Inc. / Object Explorer


Drill down History
With each drill down step, a new breadcrumb will be displayed at the top of the OE
window:

OE breadcrumb view. Here, you can see the history of drill downs
applied to the data set. In this case, the breadcrumbs show that Fire
Call for Service filters and Battalion drill downs were applied.
The bar along the top of the OE window shows the history of your drill downs. You
can return to any previous drill down state by left-clicking on the appropriate
breadcrum. This will cause that level to become highlighted, and the Types
Histogram will also recalculate to show information for the selected drill down state.

FEATURES

Visualizations & Filters
The grey and blue buttons in the center of the OE screen allow you to apply
visualizations and filters to your current object set. These operations are described in
detail in the next sections.

The best OE workflows use many tools in the OE toolkit to test multiple hypotheses
about the data. The appropriate drill downs to use depend on the outcomes you
desire.

The use or disclosure of data contained in this sheet is subject to the restrictions on the title page of this document.

4

Palantir USG, Inc. / Object Explorer


Property Value Histogram
To generate a Property Value
Histogram, left-click on the
button shown here and choose
the specific property for which you want to create a histogram.
You may also generate a Property Value Histogram from the Type Histogram panel.
To do so, right-click on a property type in the Type Histogram panel and select
“Histogram this Property”.

As an example, creating a Property Value Histogram of the “Data Source” property
type will display a breakdown of events and entities by their source system. Note:
you can also choose to “Sort A-Z” to order your histogram by unit name. Also, in the
bottom left, you can type the name of a data source to filter down to just those units
that match your search text.

Add filters to the Property Value Histogram list by
typing your filter into the box at the bottom left
The use or disclosure of data contained in this sheet is subject to the restrictions on the title page of this document.

5

Palantir USG, Inc. / Object Explorer


Double-click on a source system of interest to drill down on the various entities and
events from that system. You may also hold shift or ctrl to select multiple units at
once. Click the green “Back” arrow in the top left to return to the object set before
the drill down.

Timeline

Timeline allows you to visualize trends
in events over time and filter objects by
date and time.

For example, if you drill down on Calls for Service, and then click the Timeline
button, you will see a timeline of all Calls for Service.

You can interact with the Timeline in three ways:

Pro Tip
The Browser &
Graph have
timeline helpers
that can be used
similarly

•

To pan from side to side, right-click in the Timeline window, hold down the
mouse button, and drag the mouse to the left or right.

•

To zoom in and out, use the mouse scroll wheel or the + and – buttons on the
right side of the Timeline.

•

Left-click and drag a yellow window to select a range of events. Right-click
on the window to drill down to events in that window. Click the ‘x’ in the top
right of the window to remove it. You may create and multiple time windows
and apply the filters simultaneously.

The use or disclosure of data contained in this sheet is subject to the restrictions on the title page of this document.

6

Palantir USG, Inc. / Object Explorer


The Timeline shows different colors for different date properties available in your
data set. For example, Call for Service events may have time stamps for Call Receive
Time, Clear Time, and more; the Timeline can display all of these properties
simultaneously, but you can also configure it to display only the properties that you
care about most. The checkboxes in the legend on the left side of the Timeline allow
you to toggle display of date properties. Hovering the mouse over any property name
will display a short description of that property.
Link Type Histogram
The Link Type Histogram
function allows you to move from
one set of objects to a set of
related objects.
For example, with Arrests selected, the Link Type Histogram will allow you to
quickly filter down to the set of persons, vehicles, cases, etc. linked to those Arrests.

Branching History
The Branching History helper displays the paths of all drill downs you have taken on
a set of data. Double click any branch in the view to jump back to it. Drag and drop
one branch onto another to merge branches.

To display the Branching History panel at the top of your screen, go to the Palantir
menu bar at the very top of the screen and click Helpers > Branching History
Group By
The Group By function allows you
to perform basic statistical
calculations on selected data
sets.

The use or disclosure of data contained in this sheet is subject to the restrictions on the title page of this document.

7

Palantir USG, Inc. / Object Explorer


Combining object sets
Sets of objects from different stages in your drill down history may be combined
using the breadcrumb bar. To combine two drill down sets, click and drag any
breadcrumb and drop it onto the breadcrumb with which you wish to create a
merged set. A window will pop up asking you to select the type of combinatation you
would like to apply.


The use or disclosure of data contained in this sheet is subject to the restrictions on the title page of this document.

8

Palantir USG, Inc. / Object Explorer


Transferring Objects to and from Object Explorer
Once you have filterd to your target set of events, you can move these events to
another application in Palantir or export your results in several ways:
1. Moving data to the Graph, Map or Browser: Right-click on any bar in the Type
Histogram and click “Add Current Selection to (…)” to load the objects
represented in that bar into the Graph, Map, or Browser application.

2. Exporting OE histograms to Excel. At any time, you may right-click on
histograms in OE to export the underlying numerical values to Excel. Simply
select either Export Selection to Excel or Export All Visible to Excel. See the
next section for information on how to export the underlying data to Excel.


The use or disclosure of data contained in this sheet is subject to the restrictions on the title page of this document.

9