
Phillips Study Racial Disparities in the Capital of Capital Punishment 2008
Download original document:
Document text
Document text
This text is machine-read, and may contain errors. Check the original document to verify accuracy.
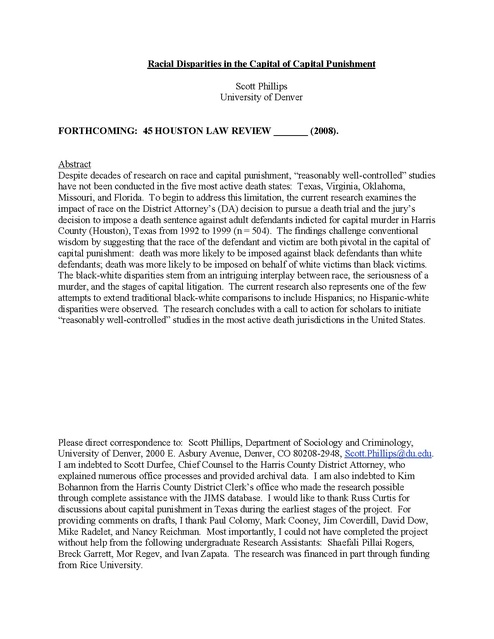
Racial Disparities in the Capital of Capital Punishment
Scott Phillips
University of Denver
FORTHCOMING: 45 HOUSTON LAW REVIEW _______ (2008).
Abstract
Despite decades of research on race and capital punishment, “reasonably well-controlled” studies
have not been conducted in the five most active death states: Texas, Virginia, Oklahoma,
Missouri, and Florida. To begin to address this limitation, the current research examines the
impact of race on the District Attorney’s (DA) decision to pursue a death trial and the jury’s
decision to impose a death sentence against adult defendants indicted for capital murder in Harris
County (Houston), Texas from 1992 to 1999 (n = 504). The findings challenge conventional
wisdom by suggesting that the race of the defendant and victim are both pivotal in the capital of
capital punishment: death was more likely to be imposed against black defendants than white
defendants; death was more likely to be imposed on behalf of white victims than black victims.
The black-white disparities stem from an intriguing interplay between race, the seriousness of a
murder, and the stages of capital litigation. The current research also represents one of the few
attempts to extend traditional black-white comparisons to include Hispanics; no Hispanic-white
disparities were observed. The research concludes with a call to action for scholars to initiate
“reasonably well-controlled” studies in the most active death jurisdictions in the United States.

Please direct correspondence to: Scott Phillips, Department of Sociology and Criminology,
University of Denver, 2000 E. Asbury Avenue, Denver, CO 80208-2948, Scott.Phillips@du.edu.
I am indebted to Scott Durfee, Chief Counsel to the Harris County District Attorney, who
explained numerous office processes and provided archival data. I am also indebted to Kim
Bohannon from the Harris County District Clerk’s office who made the research possible
through complete assistance with the JIMS database. I would like to thank Russ Curtis for
discussions about capital punishment in Texas during the earliest stages of the project. For
providing comments on drafts, I thank Paul Colomy, Mark Cooney, Jim Coverdill, David Dow,
Mike Radelet, and Nancy Reichman. Most importantly, I could not have completed the project
without help from the following undergraduate Research Assistants: Shaefali Pillai Rogers,
Breck Garrett, Mor Regev, and Ivan Zapata. The research was financed in part through funding
from Rice University.

2

Racial Disparities in the Capital of Capital Punishment
Justice is supposed to be blind – meted out according to the legal characteristics of a case
rather than the social characteristics of the defendant and victim. Decades of research on race
and capital punishment, however, demonstrate that blind justice is a mirage (United States
General Accounting Office 1990; Baldus and Woodworth 2003a, 2003b; Paternoster, Brame, and
Bacon 2008).
Ironically, the most rigorous research on race and capital punishment has not been
conducted in the jurisdictions that execute the most offenders. In a recent comprehensive review
of the literature, David Baldus and George Woodworth, leading scholars in the field, argue that
“reasonably well-controlled” studies have been conducted in the following jurisdictions:
California, Colorado, Georgia, Kentucky, Maryland, Mississippi, Nebraska, New Jersey, North
Carolina, Philadelphia, and South Carolina (2003a:519). The list of jurisdictions with
“reasonably well-controlled” studies is striking due to glaring omissions – the list does not
include the five most active death states: Texas, Virginia, Oklahoma, Missouri, and Florida.
Such states account for 719 of the 1,099 executions in the modern era, defined as the Supreme
Court’s reinstatement of capital punishment in 1976 to the present.
The current paper advances the field of race and capital punishment by conducting
“reasonably well-controlled” research in one of the most active death jurisdictions in the United
States. To do so, I examine whether race influenced the District Attorney’s (DA) decision to
pursue a death trial or the jury’s decision to impose a death sentence against adult defendants
indicted for capital murder in Harris County, Texas from 1992-1999 (n = 504).1
Baldus and Woodworth define “reasonably well-controlled” studies as those including
“statistical controls for 10 or more legitimate non-racial case characteristics” (2003a:519). The
current research meets the Baldus/Woodworth standard of being “reasonably well-controlled.”
To be clear, the current research does not claim to be in the same league as Baldus and
1

3

Though the entire state of Texas has earned a reputation for execution, Harris County –
home to Houston and surrounding areas – is arguably the capital of capital punishment. With
102 executions in the modern era, Harris County has often captured the national and
international spotlight in the death penalty debate (see e.g. Amnesty International, 2007). Table
1 demonstrates three compelling patterns: if Harris County were a state it would rank second in
executions after Texas, recently passing Virginia; Harris County has executed more offenders
than all the other major urban counties in Texas, combined; and Harris County has executed
more than twice as many offenders as the top death jurisdiction that has been subject to
“reasonably well-controlled” research on race and capital punishment. The period from 1992 to
1999 is also critical because the number of death sentences in Harris County climbed to historic
highs. From 1976 to 1991, Texas’ death row received an average of six offenders per year from
Harris County. But from 1992 to 1999, the average almost doubled to 11 offenders per year –
about one a month. The average dropped to 5 offenders per year from 2000 to 2007 (Texas
Department of Criminal Justice, 2008).2 3
colleagues’ seminal research. The Baldus study remains the most rigorous research on race and
capital punishment by far, and arguably the most impressive research on any topic in the field of
Criminology.
2
One could argue that it is inaccurate to call Harris County the “capital of capital punishment.”
In an important article that provides the first comprehensive examination of death sentences for
the entire nation, Blume and colleagues (2004) demonstrate that the death sentence rate in Texas
is below the national average (the death sentence rate is defined as the number of death sentences
divided by the number of murders). In fact, the death sentence rate in Texas ranks 16th among
the 31 states that sent more than 10 offenders to death row from 1977 to 1999. The authors also
note in a New York Times article that the death sentence rate in Harris County is average for
Texas (Liptak 2004). Thus, the considerable number of executions in Texas is not a product of a
high death sentence rate, but rather a large number of murders coupled with the state’s
propensity to execute inmates who are sentenced to death (Blume, Eisenberg, and Wells 2004).
Given Blume and colleagues’ (2004) findings, how can Harris County be called the capital of
capital punishment? Consider the following: (1) The execution rate is arguably more important
than the death sentence rate – a death sentence is a pivotal and crucial moment in a capital case,
but execution is the quintessence of capital punishment. Calculating the execution rate reveals
that Texas catapults from 16th to 3rd in the national rankings (the execution rate is defined as the

4

[Table 1 Here]
To anticipate, the results challenge conventional wisdom regarding the basic relationship
between race and capital punishment. Conventional wisdom holds that the race of the victim is
pivotal, but the race of the defendant is not (United States General Accounting Office 1990).
The current research suggests that the race of the defendant and victim are both pivotal in the
capital of capital punishment: death was more likely to be imposed against black defendants
than white defendants, and death was more likely to be imposed on behalf of white victims than
black victims. No Hispanic-white disparities were observed.
Before proceeding it is important to note that the central claim of the research – racial
disparities exist – does not insinuate that judicial actors intend to discriminate. Because human
motivations are unobservable, scientific methods cannot be used to determine whether disparities
are intentional or unintentional, conscious or unconscious (Black 1995). The word “disparities”
is used throughout the research to denote aggregate numerical differences, while the word
“discrimination” has been avoided because it unfairly impugns motives.

number of executions divided by the number of murders). (2) Raw numbers and rates both
matter. The following example from baseball illustrates the point. Barry Bonds holds the career
homerun record at 762 even though Bonds hit a homerun in 7.7 percent of at bats (762/9,847)
compared to Babe Ruth who hit a homerun in 8.5 percent of at bats (714/8,398). Ty Cobb holds
the career batting average record at .366 even though Cobb had a total of 4,189 hits compared to
Pete Rose who had 4,256 hits (www.baseball-reference.com/leaders/). Bonds’ raw number of
homeruns is not diminished by Ruth’s homerun rate, nor is Cobb’s batting rate diminished by
Rose’s raw number of hits. In most areas of life, including baseball and capital punishment, raw
numbers and rates both contain important information needed to determine rankings. (3) The
phrase “capital of capital punishment” is not meant to suggest that Harris County would be rated
as the most prolific death penalty jurisdiction under any possible standard. Rather, the phrase is
a heuristic device used to call attention to the indisputable fact that Harris County is one of the
most active death jurisdictions in the nation.
3
The annual number of death sentences from Harris County was calculated from the Texas
Department of Criminal Justice website which lists the county of conviction for each offender
and the date the offender was received on death row.

5

I. RACE AND CAPITAL PUNISHMENT
Rather than attempt to summarize the immense body of scholarship on race and capital
punishment, the following review focuses on five issues that are relevant to the current project:
(1) landmark Supreme Court cases, (2) seminal research conducted by Baldus and colleagues, (3)
existing reviews of the literature, (4) prior research in Texas, and (5) the limitations of prior
research in Texas.
In Furman v. Georgia (1972), the Supreme Court ruled on a 5-4 vote that capital
punishment was administered in an arbitrary manner that constituted cruel and unusual
punishment. Most of the justices in the majority used the word “arbitrary” to refer to numerical
disparities, arguing that there was no legal basis for distinguishing the handful of defendants who
were sentenced to death from the large number of defendants who committed equally
reprehensible crimes but were not condemned. But two justices, Douglas and Marshall, also
used the word “arbitrary” to refer to racial disparities in the imposition of capital punishment.
After the Supreme Court’s decision in Furman, states began to revise their laws and
reinstate capital punishment. Some states eliminated arbitrariness by making the death penalty
mandatory for defendants convicted of certain crimes. Other states adopted “guided discretion,”
an approach that narrowed and specified the range of crimes eligible for death, separated the
guilt and sentencing phases of a capital trial (allowing the prosecution and defense to introduce
evidence of aggravating and mitigating circumstances during the sentencing phase that could not
have been introduced during the guilt phase), and required automatic appellate review of death
sentences. In Woodson v. North Carolina (1976) and the companion case of Roberts v.
Louisiana (1976), the Supreme Court struck down mandatory death statutes arguing that the
protection of human dignity required individual consideration of each case. But the Supreme

6

Court upheld guided discretion statutes in Gregg v. Georgia (1976) and the companion cases of
Proffitt v. Florida (1976) and Jurek v. Texas (1976), beginning the modern era of capital
punishment. Guided discretion statutes soon proliferated as states passed legislation that would
comply with the ruling in Gregg.
Following the Supreme Court decision in Gregg (1976), social scientists began to
examine whether guided discretion eliminated the influence of race on capital punishment.
Baldus and colleagues’ Procedural Reform Study (PRS) and Charging and Sentencing Study
(CSS) remain the most important and rigorous research on the topic (Baldus, Woodworth, and
Pulaski 1990). The PRS includes 750 (156 pre-Furman and 594 post-Furman) murder
convictions in Georgia spanning 1970 to 1978, and the CSS includes 1,066 defendants convicted
of murder or voluntary manslaughter in Georgia from 1973 to 1979. Both studies control for an
enormous number of potential confounders. The statewide post-Furman findings reveal that the
race of the defendant was not a significant predictor, but the race of the victim was crucial:
defendants who killed white victims were 4.3 times more likely to be sentenced to death.
Moreover, black defendants who killed white victims were more likely to be sentenced to death
than any other racial combination.
The results of the CSS, and to a lesser degree the PRS, became the basis for the most
important Supreme Court decision on race and capital punishment: McCleskey v. Kemp (1987).
McCleskey argued that racial disparities in the administration of capital punishment rendered the
ultimate sanction unconstitutional. The Supreme Court did not contest the empirical patterns,
but nonetheless rejected McCleskey’s challenge on a 5-4 vote. Most centrally, the court argued
that statistical evidence of racial disparities alone, without evidence of discrimination in the
particular case at hand, does not establish a constitutional violation. The court was also reluctant

7

to open Pandora’s box, reasoning that if social science research regarding racial disparities
invalidated capital punishment then social science research could ultimately undermine the entire
criminal justice system.
Two comprehensive reviews of research on race and capital punishment have been
conducted since the Supreme Court decision in McCleskey. The United States General
Accounting Office reviewed the 28 studies published from 1972 to 1990, and, more recently,
Baldus and Woodworth reviewed the 18 studies reported or published from 1990 to 2003 (United
States General Accounting Office 1990; Baldus and Woodworth 2003a, 2003b). Both reviews
reach the same conclusion: (1) The race of the defendant does not have a consistent influence on
capital punishment: some studies suggest the disparate treatment of black defendants, but most
do not. (2) The race of the victim has a consistent and robust influence on capital punishment:
almost all studies suggest that death is more apt to be imposed on behalf of white victims.
Drawing on Supplemental Homicide Reports (SHR), scholars have also examined the
relationship between race and capital punishment in Texas. The SHR data are used to examine
whether race distinguishes the large number of defendants arrested for murder from the small
number sentenced to death. The post-Furman findings in Texas mirror established patterns: the
race of the defendant does not seem to matter; death is more apt to be imposed on behalf of white
victims; and minorities who kill whites are more apt to be sentenced to death than any other
racial combination (Bowers and Pierce 1980; Ekland-Olson 1988; Sorensen and Marquart 19901991; Marquart, Ekland-Olson, and Sorensen 1994; Brock, Cohen, and Sorensen 2000; for preFurman patterns see e.g. Koeninger 1969; Ralph, Sorensen, and Marquart 1992; Hunter, Ralph,
and Marquart 1993).

8

Existing research in Texas suffers from five important limitations, most of which stem
from a reliance on SHR data: (1) SHR data cannot control for critical confounders such as the
defendant’s prior criminal record or the heinousness of the crime. Hence, no study in Texas
meets the Baldus/Woodworth standard for “reasonably well-controlled” research enumerated
above. (2) SHR data cannot isolate murder defendants who were eligible for capital punishment
under Texas law, so the imperfect comparison includes defendants who were not eligible for
death and/or excludes defendants who were eligible for death. (3) If racial disparities emerge,
SHR data cannot identify the stage of the process that produced the disparities. Disparities may
originate in the decision to charge a defendant with capital murder, the decision to indict a
defendant for capital murder, the DA’s decision to pursue a death trial, or the jury’s decision to
impose a death sentence. (4) SHR data are sometimes problematic due to missing values. (5)
Existing studies tend to examine the entire state of Texas (for an exception see Brock, Cohen,
and Sorensen 2000). Because capital punishment in Texas is the aggregation of capital
punishment in 254 counties with different histories, cultures, political climates, and legal actors –
including different DA’s who decide whether to pursue a death trial – an investigation of race
and capital punishment across the state of Texas cannot account for local conditions.
The current research overcomes such limitations by: controlling for critical confounders,
focusing exclusively on defendants who were eligible for death, identifying the stage of the
process that produced racial disparities, including complete data for all cases, and examining
patterns for a single county.

9

II. RESEARCH METHODS
A. Dependent Variables: Trajectory and Disposition
In Harris County, the path from the commission of a murder to the pronouncement of a
death sentence includes four major decisions: the intake prosecutor’s decision to charge a
defendant with capital murder, the grand jury’s decision to indict a defendant for capital murder,
the District Attorney’s decision to pursue a death trial, and the jury’s decision to impose a death
sentence. Because the charging and indictment decisions do not appear to exhibit enough
variation to warrant an investigation, the current research focuses on whether race influenced the
DA’s decision to pursue death or the jury’s decision to impose death – the trajectory and
disposition of a case.4 5 6
The data include the population of adult defendants indicted for capital murder in
Harris County, Texas from 1992 to 1999 (n = 504).7 The Harris County District Clerk (HCDC)
used the Harris County Justice Information Management System (JIMS) to identify the
4

John Holmes Jr. was the DA in Harris County during the time period under consideration.
The Harris County intake division prosecutor must determine whether a homicide can be
charged under the Texas capital murder statute. Despite repeated attempts, collecting the data
needed to examine the impact of race on the charging decision proved impossible. But the
charging decision does not appear to exhibit much variation. To begin, the Texas capital murder
statute delineates narrow categories of murder that are death-eligible. The precision of the
statute simplifies the charging decision, as opposed to states that define heinous murders as death
eligible (see Texas Penal Code, title 5, chapter 19, section 19.03). Moreover, The Houston
Chronicle reports in a February 2001 special series that the intake prosecutor has “standing
orders” to file capital murder charges in all possible cases (Tolson and Brewer, February 4,
2001:A1; the remaining segments in the special series are listed in the reference section for the
interested reader). Nonetheless, the inability to examine the charging decision remains a
potential weakness of the current research.
6
The grand jury must return a “Bill of Indictment” for capital murder in order for the DA to
pursue a death trial. This step borders on a formality, as data from the Harris County district
clerk indicate that grand juries returned a “No Bill” in just seven capital cases from 1992 to
1999.
7
Defendants were excluded if the case was dismissed, the case was disposed but expunged, the
defendant was never arrested, the victim’s remains could not be identified, or the case had not
been disposed at the time the list of cases was requested from the Harris County District Clerk in
December 2001. The two Native American defendants were also excluded.
5

10

defendants. The HCDC also provided a JIMS file that contained public information about each
case, including whether the case resulted in a plea bargain or trial and the disposition. The
Harris County District Attorney’s office provided archival documents that were used to verify
the list of defendants and determine if the DA pursued a death trial.
Figure 1 traces the trajectory, disposition, and current status of the 504 defendants who
murdered 614 victims (defendants age 17 or older at the time of the crime were considered adults
in Texas during the time period under consideration). The figure reveals that the DA pursued a
death trial against 129 of the 504 defendants. Of the 129 defendants who advanced to a death
trial, 98 were sentenced to death, 29 were sentenced to life imprisonment, one was sentenced to
confinement in the Texas Department of Corrections (TDC) for some period of time less than
life, and one was acquitted.8 Of the 98 condemned defendants, 32 have been executed to date,
52 remain on death row, and 14 will not be executed (10 were commuted to life imprisonment
due to the Supreme Court’s 2005 decision regarding juveniles in Roper v. Simmons; four died of
natural causes on death row). The figure also reveals that the DA pursued a life trial against 218
defendants and reached a plea bargain with 157 defendants.
[Figure 1 Here]
B. Race/Ethnicity
Table 2 describes measurement strategies, data sources, and means for the race/ethnicity
of the defendant and victim. Though the terms “race” and “ethnicity” are not interchangeable, in
the interest of brevity the generic term “race” is used throughout the remainder of the paper.
[Table 2 Here]
8

The inmates sentenced to life imprisonment are eligible for parole because Texas did not pass
a life without parole (LWOP) statute until 2005 (defendants in the data who were convicted in
1992 must serve 35 years before becoming eligible for parole; defendants in the data who were
convicted between 1993 and the passage of LWOP must serve 40 years before becoming eligible
for parole).

11

Data regarding the defendant’s race were obtained from JIMS. The JIMS file included
separate indicators for race (white, black, Asian) and ethnic origin (Hispanic). But important
clues suggested that JIMS did not distinguish between Hispanic defendants and non-Hispanic
defendants in a consistent manner. An examination of defendants’ names suggested a problem
of under-inclusion: defendants coded as Hispanic tended to have Spanish surnames, but some
defendants with Spanish surnames were not coded as Hispanic. The same defendants who
appeared to be miscoded tended to murder Hispanic victims, a pattern that supports the
presumption of coding errors in JIMS considering the intra-racial nature of most murder. The
problem was addressed with a two-pronged approach: (1) If a defendant was coded as Hispanic
in JIMS then the original code remained the same. (2) If a defendant was coded as non-Hispanic
in JIMS then the defendant’s name was compared to the U.S. Census Bureau’s 1990 Spanish
Surname List (Word and Perkins 1996). The list classifies 12,215 surnames as “Heavily
Hispanic,” meaning more than 75 percent of Census respondents with the surname reported
being Hispanic. Using a conservative standard, capital murder defendants were recoded as
Hispanic if at least 80 percent of Census respondents with the same surname reported being
Hispanic. After correcting Hispanic origin, the defendants are distributed as follows: 24 percent
white, 23 percent Hispanic, 49 percent black, and 3 percent Asian.
Data regarding the victim’s race were obtained from a name-identified version of the
Texas Department of Health’s Vital Statistics Mortality File (VSMF).9 Coding the race of the
victim required a procedure that could accommodate cases with multiple victims: 75 cases
include multiple victims of the same race; 11 cases include multiple victims of different races. If
multiple victims are the same race, then one dichotomous indicator represents the victims (if a
9

If data were missing in the VSMF, then Harris County Medical Examiner records were used to
code the race of the victim.

12

white defendant murders two Hispanic victims then the indicator for Hispanic victim is coded 1).
If multiple victims are of different races, then multiple dichotomous indicators represent the
victims (if a white defendant murders a Hispanic victim and a black victim then the indicators for
Hispanic victim and black victim are both coded 1). The dichotomous indicators capture the
presence or absence of victims of each race. The victims are distributed as follows: 41 percent
white, 24 percent Hispanic, 28 percent black, and 10 percent Asian (percentages do not sum to
100 because the dichotomous indicators for each case are not mutually exclusive).
C. Controls
To control for potential confounders, the models also examine the social characteristics
of the defendant, the social characteristics of the victim, and the legal dimensions of the case.
Table 2 also reports measurement strategies, data sources, and means for the controls.
1. Defendant Social Characteristics
Data regarding defendant social characteristics were drawn from the JIMS file. The
multivariate models control for the defendant’s sex (1 = male), age (dichotomous indictors for
teen 17 to 19, young adult 20 to 29, and adult 30 or more), whether the defendant had a prior
violent conviction (discussed below), whether the defendant had a prior non-violent conviction
(discussed below), and the defendant’s form of legal counsel (discussed below). Measurement
of the defendant’s prior record and legal counsel require elaboration.
Controlling for the defendant’s criminal record is crucial because of the special
sentencing issues considered during the punishment phase of a Texas capital murder trial. To
sentence a defendant to death, jurors must answer two or three questions depending on whether
the defendant was a lone actor or a party to the case: (1) Does the defendant pose a continuing
threat to society? (2) If the defendant is a party to the case, did the defendant cause the death of

13

the victim, intend to cause the death of the victim, or anticipate that a life would be taken? (3)
Do mitigating circumstances warrant a life sentence? If the jurors unanimously answer the
questions in the following order – yes, yes, no – then the defendant is sentenced to death (Texas
Statutes: Code of Criminal Procedure, 2007: Chapter 37, Article 37.071).10 Research suggests
that future dangerousness is the most critical sentencing consideration in Texas: most defendants
sentenced to life were spared because jurors concluded that the defendant did not pose a
continuing threat, not because jurors concluded that mitigating circumstances warranted mercy
(Sorensen and Marquart 2003: 286; Sorensen and Pilgrim 2006:53). Thus, to pursue a death trial
the DA must decide if the defendant’s criminal record (or some other aspect of the case) supports
a prediction of future dangerousness. Although the DA has access to national criminal record
data, JIMS criminal record data are limited to Harris County. To address the problem, JIMS data
were supplemented with information from the website: www.publicdata.com. The website
charges users a fee to access public criminal record data compiled from 45 states, including
Texas. Searches were conducted on all defendants. The inquiries revealed that among
defendants who had a clean record in JIMS, 13 had a prior violent conviction and 32 had a prior
non-violent conviction on the public data website. Merging data from JIMS and the public data
10

Prior to 1991, jurors considered three different special sentencing issues: (1) Did the
defendant deliberately kill the victim? (2) Does the defendant pose a continuing threat to
society? (3) If relevant, was the defendant’s behavior an unreasonable response to the victim’s
provocation? If the jury unanimously answered yes to all the questions then the defendant was
sentenced to death. The second question regarding future dangerousness was meant to allow the
defense to present the types of mitigating circumstances that the Supreme Court required for a
statute to pass constitutional muster. However, Penry, a mentally retarded defendant who was a
victim of child abuse, maintained that the second special sentencing issue did just the opposite in
his case. Specifically, Penry claimed that if he presented the issues of retardation and abuse as
mitigating circumstances the jury might conclude that he was more of a future danger, thereby
transforming mitigating circumstances into aggravating circumstances. In the 1989 case of
Penry v. Lynaugh, the Supreme Court upheld the defendant’s challenge, leading to the adoption
of the current special sentencing issues which explicitly require consideration of mitigating
circumstances (Sorensen and Pilgrim 2006:1-8).

14

website, the indicators for prior violent conviction and prior non-violent conviction are coded 1 =
yes, 0 = no.
Controlling for the defendant’s form of legal counsel is also important, particularly
because Harris County does not have a Public Defender’s Office; if a defendant is indigent then
the judge appoints defense counsel from a list of qualified attorneys. The JIMS file indicates that
369 defendants were appointed counsel, 31 defendants hired counsel, and 104 defendants had
both hired and appointed counsel at different stages of the case. Legal counsel is measured
through a dichotomous indicator coded 1 = appointed only, 0 = hired counsel at some point
during the case.11 12
2. Victim Social Characteristics
Data regarding victim social characteristics were drawn from the Vital Statistics
Mortality File and www.publicdata.com.13 The multivariate models control for the victim’s sex
(1 = female), whether the victim was vulnerable due to age (1 = 6 to 16 or over 60; children 0 to
5 considered below), and whether the victim had a prior violent or non-violent conviction (1 =
yes; searches were conducted on all victims on the public data website). Coding the victims’
characteristics required a procedure that could accommodate cases with multiple victims.
Because each of the characteristics is thought to influence the chance of a death trial and a death
sentence – more on behalf of female victims and vulnerable victims, but less on behalf of

11

Legal counsel could also be measured through three dichotomous indicators: appointed,
hired, and both. But this approach poses the problem of quasi-complete separation: 1 of the 31
defendants with hired counsel advanced to a death trial; 0 of the 31 defendants with hired
counsel received a death sentence (for more on quasi-complete separation see Allison 1999).
12
The JIMS file does not indicate whether defendants who had both changed from appointed to
hired, or hired to appointed (or the date of the change).
13
If data were missing in the VSMF, then Harris County Medical Examiner records were used
to code the age and sex of the victim.

15

disreputable victims with a prior criminal record – a case is coded 1 if one or more of the victims
meet the specified criterion.
3. Legal Dimensions of Case
Data regarding the legal dimensions of the case were obtained from Grand Jury
indictments, the Harris County Medical Examiner (HCME), and The Houston Chronicle. The
multivariate models control for the heinousness of the crime (discussed below), whether multiple
defendants were indicted (1 = yes), the form of capital murder (discussed below), and the method
of murder (dichotomous indicators for shot, stabbed, beaten, and asphyxiated). Controls for
heinousness and the form of capital murder require elaboration.
To measure the heinousness of the crime, newspaper articles about each case were
collected from The Houston Chronicle online archive (an average of 6.75 articles per case, for a
total of more than 3,400 articles). The aggravating and mitigating circumstances in each case
were coded based on a list drawn from Baldus and colleagues’ research on race and capital
punishment (1990: 526-535). Table 3 lists the aggravating and mitigating circumstances in
question. The following formula was used to construct a scale of heinousness: number of
aggravating circumstances minus number of mitigating circumstances (the scale ranged from -3
to +7). The original scale was transformed into three dichotomous indicators: Level 1
Heinousness (bottom quartile of scores ranging from -3 to 0), Level 2 Heinousness (middle 50
percent of scores ranging from 1 to 2), and Level 3 Heinousness (top quartile of scores ranging
from 3 to 7).
The heinousness measure included missing data because The Houston Chronicle did not
report on 28 cases. To address the problem, missing cases are assumed to be Level 1. This
assumption is based on compelling patterns. To begin, the cliché “if it bleeds it leads”

16

encapsulates the media’s obsession with sensational crimes. Considering the fact that The
Houston Chronicle reported on 476 of the 504 cases, the 28 capital murders that did not attract
media attention are almost sure to be the least heinous of all. In fact, the DA did not pursue a
death trial against any of the 28 defendants, bolstering the assumption of minimal heinousness.
Because the substantive results are the same regardless of whether the missing cases are
excluded or coded as Level 1, the models presented in the results section use the revised
indicator of heinousness to ensure complete data for all cases. Thus, the original scale was
transformed into three dichotomous indicators to facilitate a solution to the missing data problem
(also because several values on the original scale had no cases or just one case).14
[Table 3 Here]
Grand Jury indictments were used to determine the form of capital murder. Of the forms
delineated in the Texas capital murder statute, the following appear in the data: robbery,
burglary, multiple victims, kidnapping, rape, remuneration, child 0 to 5 years old, police officer,
arson, and obstruction/retaliation. The form of capital murder is measured through dichotomous
indicators coded 1 = yes, 0 = no (other includes police officer, arson, and obstruction/retaliation).
Because a case can be a capital murder for multiple reasons, the indicators are not mutually
exclusive.
D. Modeling
Logistic regression is used to estimate the impact of race on the odds of a death trial (1 =
death trial; 0 = all other trajectories) and a death sentence (1 = death sentence; 0 = all other
14

Heinousness was also coded based on a visceral reaction to the facts of the crime, just as a DA
or juror would do. Each case was assigned to Level 1 (relative minimal), Level 2 (intermediate),
or Level 3 (extreme). The Baldus measure of heinousness (based on coding of aggravating and
mitigating circumstances) and the visceral measure of heinousness produce the same substantive
results. The Baldus measure is used here because it provides slightly more conservative
estimates of the impact of race on capital punishment.

17

dispositions). In a logistic model, odds ratios represent the effect of a unit change in the
independent variable on the odds of the outcome occurring – a death trial or a death sentence.
An odds ratio greater than 1 denotes a direct relationship, an odds ratio less than 1 denotes an
inverse relationship, and an odds ratio of 1 suggests that the independent variable has no
influence on the outcome. So, for example, an odds ratio of 1.5 would suggest that being a black
defendant, relative to the reference of being a white defendant, increases the odds of a death trial
by 50 percent (or, the odds of a death trial are 1.5 times greater for black defendants than white
defendants). An odds ratio of .7 would suggest that being a black defendant, relative to the
reference of being a white defendant, reduces the odds of a death trial by 30 percent (1 -.7 = .3).
Because the data include a population rather than a random sample, statistical
significance becomes meaningless (Cowger 1984, 1985).15 Tests of statistical significance
examine a narrow question: the probability of making a Type 1 or Type 2 error in generalizing
from a sample to a population. The current research does not generalize from a sample to a
population, but rather describes the impact of race on capital punishment for a population of
cases. The critical issue in the current research is substantive significance, not statistical
significance. Thus, I focus on the magnitude of population parameters (Bollen 1995:468).
Specifically, regression coefficients are converted to predicted probabilities in order to examine
the cost of racial disparities in human lives. Ignoring statistical significance also eliminates the
need to correct for non-independent observations (clustering occurs because multiple defendants
are often indicted for the same crime). Non-independent observations can produce correlated
error terms leading to biased standard errors and inaccurate tests of statistical significance
(McClendon, 1994). But correlated error terms do not influence population parameters.
15

For more on the topic of statistical significance and population data see: Berk, Western, and
Weiss 1995a, 1995b; Firebaugh 1995; Rubin 1995.

18

It is important to note that the data do not include enough Asian defendants or Asian
victims to produce robust parameters (for defendants the DA pursued a death trial in 4 of 15
cases and jurors imposed death in 3 of 15 cases; for victims the DA pursued death in 8 of 48
cases and jurors imposed death in 6 of 48 cases). To preserve the population of cases, Asian
defendants and Asian victims are included in the multivariate models. But the parameters for
Asian defendant and Asian victim are reported in table footnotes and should not be interpreted.16
E. Limitations
The most significant limitation is the inability to control for the strength of evidence in
each case, an important consideration in the DA’s decision to pursue a death trial and the jury’s
decision to impose a death sentence. This is not a fatal flaw. The only reason to control for a
potential confounder is if the confounder is correlated with both race and the trajectory or
disposition of cases. Strength of evidence could be related to race if members of certain racial
groups tend to be defendants/victims in capital murders that naturally produce more evidence. If,
for example, beating a rape victim to death produces more evidence than shooting a robbery
victim, and if certain racial groups are more apt to be defendants/victims in the former murder
than the latter, then apparent racial disparities might be a legitimate response to differences in the
strength of evidence across cases. But the models control for the form and method of murder, so
the data include proxies for strength of evidence. Strength of evidence could also be related to
race if the police conduct more thorough investigations against certain racial groups, or on behalf
of certain racial groups. If so, then controlling for strength of evidence might locate the source
of racial disparities in the police department rather than the DA’s office or the jurors’
deliberation room, but would not eliminate the existence of racial disparities. It is also worth
16

Because Asians are often considered the “model minority,” whites and Asians could be
combined into a single category. But whites and Asians are treated differently (see Table 4), so
combining the groups would dilute black-white and Hispanic-white comparisons.

19

noting that the only study to measure strength of evidence in capital cases found that inclusion of
the evidence variable did not change the race findings (Nakell and Hardy 1987). Moreover, in
the current data 496 of the 504 defendants were convicted, suggesting that insufficient evidence
was rarely a problem for the Harris County DA.
III. RESULTS
A. Bivariate Patterns
Table 4 presents percentage distributions for case trajectory and case disposition by race.
Panel A demonstrates the equal treatment of defendants: the DA pursued a death trial against 27
percent of white defendants, 25 percent of Hispanic defendants, and 25 percent of black
defendants; a death sentence was imposed against 21 percent of white defendants, 19 percent of
Hispanic defendants, and 19 percent of black defendants.
Panel B demonstrates the relatively equal treatment of Hispanic and white victims, but
suggests disparities in the treatment of black victims compared to white victims: the DA pursued
a death trial on behalf of 30 percent of white victims and 26 percent of Hispanic victims, but just
23 percent of black victims; a death sentence was imposed on behalf of 23 percent of white
victims and 21 percent of Hispanic victims, but just 18 percent of black victims.
[Table 4 Here]
B. Multivariate Patterns: Death Trial
Do the bivariate patterns regarding death trials hold in a multivariate context? Table 5
reports odds ratios from the logistic regression of death trial on race. The results present a
surprising twist. The bivariate comparison of Hispanics to whites holds: Hispanic and white
defendants and victims are treated the same. But the bivariate comparison of blacks to whites
does not.

20

1. Black and White Defendants
The percentage distribution suggested that the DA pursued death against black
defendants and white defendants at the same rate, but controlling for confounders reveals
disparities in the treatment of black defendants: the odds ratio for black defendant changes from
.91 in the bivariate logistic model (available upon request) to 1.75 in the multivariate logistic
model. The transformation occurs because black defendants committed murders that were less
“serious.” Here, the term “serious” refers to the features of a murder that increase the chance of
a death trial at the bivariate level in the current data. Table 6 demonstrates that black defendants
were less likely than white defendants to:
∞ murder white victims;
∞ commit the most heinous murders;
∞ commit murders involving burglary, kidnapping, rape, remuneration, or a child;
∞ commit murder by beating, stabbing, or asphyxiating the victim;
∞ commit murder as an adult;
∞ murder victims who were vulnerable due to age;
∞ murder women.
So the DA pursued death against black defendants and white defendants at the same rate
despite the fact that black defendants committed less serious murders along several dimensions –
meaning black defendants committed murders that were less likely to include the features that
tend to increase the chance of a death trial in Harris County. Put differently, the bar appears to
have been set lower for pursuing death against black defendants. Comparing the percentage
distribution to the multivariate finding leads to the following conclusion: to impose equal
punishment against unequal crimes is to impose unequal punishment.

21

2. Black and White Victims
The percentage distribution suggested that the DA was less likely to pursue death on
behalf of black victims than white victims, but controlling for confounders amplifies the original
disparity: the odds ratio for black victim changes from .75 in the bivariate logistic model
(available upon request) to .57 in the multivariate logistic model. The transformation occurs
because black victims were twice as likely to be killed in murders with multiple victims: 24
percent of black victim cases had multiple victims compared to just 11 percent of white victim
cases. So the DA pursued death less on behalf of black victims than white victims despite the
fact that black victims were killed in more serious murders with multiple victims. Put
differently, the bar appears to have been set higher for pursuing death on behalf of black victims.
[Table 5 and Table 6 Here]
C. Multivariate Patterns: Death Sentence
The DA decides whether to pursue a death trial, but jurors decide whether to impose a
death sentence. If jurors treated all cases the same regardless of race, then disparities in death
trials would be duplicated in death sentences. But jurors could also strengthen, attenuate, or
eliminate disparities that originate in the DA’s office. Table 7 reports odds ratios from the
logistic regression of death sentence on race.
[Table 7 Here]
The results suggest duplication and slight attenuation. Duplicating the existing patterns,
Hispanic and white defendants and victims are treated the same. But jurors attenuate the
differential treatment of blacks and whites: the odds of a death trial are 1.75 times higher against
black defendants than white defendants, but drop to 1.49 times higher for a death sentence; the
odds of a death trial are 43 percent lower on behalf of black victims relative to white victims, but

22

drop to 38 percent lower for a death sentence. Presumably, the partial correction by jurors is a
response to the DA occasionally overreaching against black defendants and on behalf of white
victims. But the correction is partial – disparities in death sentences remain.17
D. Using Predicted Probabilities to Examine the Magnitude of Black-White Disparities
The results suggest that capital punishment in Harris County is stratified according to
race – Hispanics and whites are treated the same, but blacks and whites are not. How substantial
are the black-white disparities? To provide a more interpretable metric, Table 8 presents
predicted probabilities of death trials and death sentences (confounders held constant at the
mean). The predicted probabilities are then used to calculate the conditional probability of juries
imposing a death sentence against defendants who advance to a death trial. To illustrate the
calculation of conditional probabilities, consider the following example. For black defendants,
the predicted probability of a death trial is .23 and the predicted probability of a death sentence is
.17. Thus, the conditional probability of juries imposing a death sentence is: .23x = .17; x =
.17/.23; x = .74.
[Table 8 Here]
Panel A examines the impact of defendant race. Assume, hypothetically, that 100 black
defendants and 100 white defendants were indicted for capital murder. The predicted
probabilities suggest the following: the DA would pursue death against 23 black defendants and
jurors would impose death in 74 percent of the cases, so 17 black defendants would be
condemned; the DA would pursue death against 15 white defendants and jurors would impose
17

The multivariate models for death trial and death sentence were also run controlling for the
relationship between the defendant and victim. Data regarding the defendant-victim relationship
were drawn from newspaper articles about each case (stranger = 1, non-stranger = 0). If the
newspaper did not mention a relationship then the defendant and victim were considered to be
strangers. Controlling for the defendant-victim relationship did not change the substantive
results. However, the relationship variable is not included in the tables due to missing data and
the obvious problems of relying on the newspaper for such information.

23

death in 80 percent of the cases, so 12 white defendants would be condemned. The probabilities
translate abstract numbers into human lives: five black defendants would be sentenced to the
ultimate state sanction because of race.
Panel B examines the impact of victim race. Here, assume, hypothetically, that 100
defendants murdered white victims and 100 defendants murdered black victims. The predicted
probabilities suggest the following: the DA would pursue death on behalf of 22 white victims
and jurors would impose death in 68 percent of the cases, so 15 defendants would be
condemned; the DA would pursue death on behalf of 13 black victims and jurors would impose
death in 77 percent of the cases, so 10 defendants would be condemned. The impact in terms of
human lives is the same: five defendants would be sentenced to the ultimate state sanction
because the victim is white.
The predicted probabilities also demonstrate how jurors provide a partial correction to
disparities that arise in the DA’s decision to pursue a death trial. The DA is considerably more
likely to pursue death against black defendants and on behalf of white victims, but jurors are
slightly more likely to impose death against white defendants and on behalf of black victims.
The net effect is that jurors attenuate but do not eliminate the overall black-white disparities –
black defendants and defendants who kill whites are still more likely to be sentenced to death, all
else equal. The bottom line is clear: race continues to shape case outcomes decades after the
Supreme Court declared in Gregg v Georgia (1976) that guided discretion would eliminate
arbitrariness in the administration of capital punishment.

24

IV. CONCLUSION
The race and capital punishment literature is somewhat paradoxical. Numerous studies
have been conducted over the years, but no “reasonably well-controlled” research has been done
in the five most active death states: Texas, Virginia, Oklahoma, Missouri, and Florida. The
current research begins to address this paradox by focusing on the capital of capital punishment.
Harris County is exceptional in the modern era of execution. Not only has the county executed
102 inmates, 123 more inmates from Harris County are currently awaiting execution on Texas’
death row. Because the pipeline is full, Harris County will probably continue to be one of the
most active death jurisdictions in the United States for the foreseeable future.
Some might consider the focus on Harris County to be a limitation rather than an asset –
because Harris County is exceptional the findings do not tell us much about the relationship
between race and capital punishment in a broader context. But this potential critique misses the
mark. No research on race and capital punishment can be generalized to other places or time
periods. Seminal research in Georgia (Baldus et al. 1990) and Maryland (Paternoster et al.
2004), for example, cannot be generalized to Harris County, nor can research in Harris County
be generalized to Georgia or Maryland. Research in Harris County cannot even be generalized
to the rest of Texas – Texas does not have a singular capital punishment regime, but rather 254
capital punishment regimes operating in separate counties authorized by state law. The fact that
all research on the topic is confined to particular places and time periods might seem dire, but
such a pessimistic conclusion is unwarranted. Our understanding of the relationship between
race and capital punishment has always expanded through individual studies that cannot be
generalized, but nonetheless combine to form a composite picture – the current research adds an
important pixel.

25

How does the current pixel sharpen the existing image? The findings challenge
conventional wisdom by suggesting that the race of the defendant and victim are both pivotal in
the capital of capital punishment: death is more likely to be imposed against black defendants
than white defendants, and death is more likely to be imposed on behalf of white victims than
black victims. The central pattern stems from an intriguing interplay between race, the
seriousness of a murder, and the stages of capital litigation. Defendants and victims are
considered in turn.
∞ Defendants: The DA pursued death against black defendants and white defendants at the
same rate, but controlling for confounders revealed disparate treatment because black
defendants committed murders that were less “serious” along several dimensions.
Although the DA was considerably more likely to pursue death against black defendants,
juries were slightly more likely to impose death against white defendants. Presumably,
the jurors’ behavior is a response to the DA’s occasional overreaching against black
defendants, a possibility that should be investigated in future research. The net effect is
that juries attenuate but do not eliminate disparities between black and white defendants
that originate in the DA’s office.
∞ Victims: The DA was considerably more likely to pursue death on behalf of white
victims than black victims, particularly given the fact that black victims tended to be
killed in murders that were more serious due to the presence of multiple victims. But
jurors were slightly more likely to impose death on behalf of black victims. Again, the
jurors’ behavior is assumed to be a response to the DA’s occasional overreaching on
behalf of white victims. The net effect is that juries attenuate but do not eliminate
disparities between black and white victims that originate in the DA’s office.

26

Perhaps surprisingly, the findings also suggest that Hispanics and whites are treated the
same. This pattern could be a product of the demographic landscape: whites and Hispanics
represent an equal share of Harris County residents at 38 percent each, compared to 18 percent
for blacks. Such numbers suggest that Hispanics wield more political power and are a greater
presence within criminal justice, such as on juries (U.S. Census Bureau 2007). More research is
needed to understand the juxtaposition of black-white disparities but Hispanic-white parities.
The capital punishment literature is marked by exemplary research (see e.g. Bowers and
Pierce 1980; Radelet 1981; Foley and Powell 1982; Paternoster 1984; Nakell and Hardy 1987;
Gross and Mauro 1989; Keil and Vito 1989; Baldus et al. 1990; Paternoster et al. 2004; Blume et
al. 2004; Pierce and Radelet 2005; Hindson et al. 2006). The current research contributes to a
crowded field by: focusing on the capital of capital punishment; challenging conventional
wisdom regarding the basic relationship between race and capital punishment; demonstrating the
nuanced interplay between race, the seriousness of a murder, and the stages of capital litigation;
translating abstract odds ratios into interpretable predicted probabilities that are accessible to
policymakers; and serving as a call to action for scholars to initiate “reasonably well-controlled”
studies in the most active death jurisdictions in the United States.

27

REFERENCES
Allison, Paul D. 1999. Logistic Regression Using the SAS System: Theory and Application.
Cary, NC: SAS Institute Inc.
Amnesty International. 2007. http://www.amnesty.org/en/report/info/AMR51/125/2007
Baldus, David C., George Woodworth, and Charles A. Pulaski Jr. 1990. Equal Justice and the
Death Penalty: A Legal and Empirical Analysis. Boston: Northeastern University Press.
Baldus, David C. and George Woodworth. 2003a. “Race Discrimination and the Death Penalty:
An Empirical and Legal Overview.” Pp. 501-551 in America’s Experiment with Capital
Punishment edited by James R. Acker, Robert M. Bohm, and Charles S. Lanier. Durham.
North Carolina: Carolina Academic Press.
Baldus, David C. and George Woodworth. 2003b. “Race Discrimination in the Administration
of the Death Penalty: An Overview of the Empirical Evidence with Special Emphasis on
the Post-1990 Research.” Criminal Law Bulletin 39: 194-226.
Berk, Richard A., Bruce Western, and Robert E. Weiss. 1995a. “Statistical Inference for
Apparent Populations.” Sociological Methodology 25:421-458.
Berk, Richard A., Bruce Western, and Robert E. Weiss. 1995b. “Reply to Bollen, Firebaugh,
and Rubin.” Sociological Methodology 25:481-485.
Black, Donald. 1995. “The Epistemology of Pure Sociology.” Law and Social Inquiry 20
(3):829-870.
Blume, John, Theodore Eisenberg, and Martin T. Wells. 2004. “Explaining Death Row’s
Population and Racial Composition.” Journal of Empirical Legal Studies 1(1):165-207.
Bollen, Kenneth A. 1995. “Apparent and Nonapparent Significance Tests.” Sociological
Methodology 25:459-468.
Bowers, William J. and Glenn L. Pierce. 1980. “Arbitrariness and Discrimination under PostFurman Capital Statutes.” Crime and Delinquency 26:563-635.
Brock, Dean, Nigel Cohen, and Jonathan Sorensen. 2000. “Arbitrariness in the Imposition of
Death Sentences in Texas: An Analysis of Four Counties by Offense Seriousness, Race
of Victim, and Race of Offender.” American Journal of Criminal Law 28:43-71.
Cowger, Charles D. 1984. “Statistical Significance Tests: Scientific Ritualism or Scientific
Method?” Social Services Review 58:358-371.
Cowger, Charles D. 1985. “Reply to Allen Rubin’s Significance Testing with Population Data.”
Social Services Review 59:521-522.

28

Death Penalty Information Center. 2007. http://www.deathpenaltyinfo.org/. Retrieved
September 17, 2007.
Ekland-Olson, Sheldon. 1988. “Structured Discretion, Racial Bias, and the Death Penalty: The
First Decade after Furman in Texas.” Social Science Quarterly 69(4):853-873.
Firebaugh, Glenn. 1995. “Will Bayesian Inference Help? A Skeptical View.” Sociological
Methodology 25:469-472.
Foley, Linda and Richard Powell. 1982. “The Discretion of Prosecutors, Judges, and Juries in
Capital Cases.” Criminal Justice Review 7(2):16-22.
Gross, Samuel R. and Robert Mauro. 1989. Death and Discrimination: Racial Disparities in
Capital Sentencing. Boston: Northeastern University Press.
Hindson, Stephanie, Hillary Potter, and Michael L. Radelet. 2006. “Race, Gender, Region, and
Death Sentencing in Colorado, 1980-1999.” University of Colorado Law Review
77(3):549-594.
Houston Chronicle. Allan Turner. February 4, 2001. Harris County is a Pipeline to Death Row.
A Four-Part Series Examines Why, and Explores Whether Justice is Served. A Deadly
Distinction: Bloodthirsty Image at Odds with Local Poll. A1.
Houston Chronicle. Mike Tolson and Steve Brewer. February 4, 2001. Harris County is a
Pipeline to Death Row. A Four-Part Series Examines Why, and Explores Whether
Justice is Served. A Deadly Distinction. A1.
Houston Chronicle. Mike Tolson. February 5, 2001. A Deadly Distinction: Part II. Between
Life and Death: Borderline Capital Cases Raise Questions of Justice. A1.
Houston Chronicle. Steve Brewer and Mike Tolson. February 6, 2001. A Deadly Distinction:
Part III. Debate Fervent in Mental Cases: Johnny Paul Penry Illustrates a Lingering
Capital Conundrum. A6
Houston Chronicle. Mike Tolson. February 7, 2001. A Deadly Distinction: Part IV. Death
Penalty Reforms Sought: Life Without Parole Has Chance to Pass in this Legislature.
A1.
Hunter, Robert J., Paige Heather Ralph, and James Marquart. 1993. “The Death Sentencing of
Rapists in Pre-Furman Texas (1942-1971): The Racial Dimension.” American Journal
of Criminal Law 20(3):313-337.
Keil, Thomas J. and Gennaro F. Vito. 1989. “Race, Homicide Severity, and Application of the
Death Penalty: A Consideration of the Barnett Scale.” Criminology 27(3):511-536.

29

Koeninger, Rupert C. 1969. Capital Punishment in Texas, 1924-1968.” Crime and Delinquency
15:132-141.
Marquart, James W., Sheldon Ekland-Olson, and Jonathan R. Sorensen. 1994. The Rope, the
Chair, and the Needle: Capital Punishment in Texas, 1923-1990. Austin, Texas:
University of Texas Press.
McClendon, McKee J. 1994. Multiple Regression and Causal Analysis. F.E. Peacock
Publishers: Itasca, Illinois.
Nakell, Barry and Kenneth A Hardy. 1987. The Arbitrariness of the Death Penalty.
Philadelphia, Pennsylvania: Temple University Press.
New York Times. Adam Liptak. February 14, 2004. Study Revises Texas’ Standing as a Death
Penalty Leader.
Paternoster, Raymond. 1984. “Prosecutorial Discretion in Requesting the Death Penalty: A
case of Victim-Based Racial Discrimination.” Law and Society Review 18(3):437-478.
Paternoster, Raymond, Robert Brame, Sarah Bacon, and Andrew Ditchfield. 2004. “Justice by
Geography and Race: The Administration of the Death Penalty in Maryland, 1978-1999."
Margins: University of Maryland Law Journal on Race, Religion, Gender and Class 4(1):
1-97.
Paternoster, Raymond, Robert Brame, and Sarah Bacon. 2008. The Death Penalty: America’s
Experience with Capital Punishment. New York: Oxford University Press.
Pierce, Glenn L. and Michael L. Radelet. 2005. “The Impact of Legally Inappropriate Factors
on Death Sentencing for California Homicides, 1990-1999.” Santa Clara Law Review
46(1): 1-47.
Radelet, Michael L. 1981. “Racial Characteristics and the Imposition of the Death Penalty.”
American Sociological Review 46(6):918-927.
Ralph, Paige H., Jonathan R. Sorensen, and James W. Marquart. 1992. “A Comparison of
Death Sentenced and Incarcerated Murderers in Pre-Furman Texas.” Justice Quarterly
9(2):185-209.
Rubin, Donald B. 1995. “Bayes, Neyman, and Calibration.” Sociological Methodology 25:473479.
Sorensen, Jonathan R. and James W. Marquart. 1990-1991. “Prosecutorial and Jury DecisionMaking in Post-Furman Texas Capital Cases.” NYU Review of Law and Social Change
18(3):743-776.

30

Sorensen, Jon and James Marquart. 2003. “Future Dangerousness and Incapacitation.” Pp. 283300 in America’s Experiment with Capital Punishment edited by James R. Acker, Robert
M. Bohm, and Charles S. Lanier. Durham. North Carolina: Carolina Academic Press.
Sorensen, Jon and Rocky Leann Pilgrim. 2006. Lethal Injection: Capital Punishment in Texas
During the Modern Era. Austin, Texas: University of Texas Press.
Texas Department of Criminal Justice. 2007. http://www.tdcj.state.tx.us/stat/deathrow.htm.
Retrieved September 17, 2007.
Texas Statutes: Code of Criminal Procedure. 2007. http://tlo2.tlc.state.tx.us/statutes/cr.toc.htm.
Retrieved September 19, 2007.
Texas Statutes: Penal Code. 2007. http://tlo2.tlc.state.tx.us/statutes/petoc.html. Retrieved
September 17, 2007.
United States Census Bureau. 2007. http://quickfacts.census.gov/qfd/states/48/48201.html.
Retrieved September 17, 2007.
United States General Accounting Office. 1990. “Death Penalty Sentencing: Resource Indicates
Pattern of Racial Disparities. Washington, D.C.: U.S. General Accounting Office.
Word, David L. and R Colby Perkins. 1996. “Building a Spanish Surname List for the 1990’s –
A New Approach to an Old Problem.”
http://www.census.gov/population/documentation/twpno13.pdf. Retrieved September
17, 2007.
CASES CITED
Furman v. Georgia, 408 U.S. 238 (1972).
Gregg v. Georgia, 428 U.S. 153 (1976).
McCleskey v. Kemp, 481 U.S. 279 (1987).
Penry v Lynaugh, 492 U.S. 302 (1989)
Proffitt v. Florida, 428 U.S. 242 (1976).
Roberts v. Louisiana, 428 U.S. 325 (1976).
Roper v. Simmons, 543 U.S. 551 (2005).
Woodson v. North Carolina, 428 U.S. 280 (1976).

31

Table 1. Number of Executions in Selected Jurisdictions, 1976 to Present
Top 10 States
Texas
Harris County (Houston)
Virginia
Oklahoma
Missouri
Florida
North Carolina
Georgia
Alabama
South Carolina
Louisiana

Texas’ Urban Counties
405
102
98
86
66
64
43
40
38
37
27

Harris County (Houston)
Dallas County (Dallas)
Tarrant County (Fort Worth)
Bexar County (San Antonio)
Travis County (Austin)

102
34
27
26
7

Jurisdictions with “Reasonably
Well-Controlled” Research
Harris County (Houston)
102
North Carolina
43
Georgia
40
South Carolina
37
California
13
Mississippi
8
Maryland
5
Philadelphia
3
Nebraska
3
Kentucky
2
Colorado
1
New Jersey
0

Notes:
1. Current as of March 27, 2008.
2. Data on Texas come from the Texas Department of Criminal Justice website. Data for the remaining
states come from the Death Penalty Information Center website.
3. Numbers for Philadelphia represent Pennsylvania.

32

Figure 1: Trajectory, Disposition, and Status of Adult Defenda
1999 (status current as of March 27, 2008)
TRAJECTORY

nts Indicted for Capital Murder in Harris County, Texas from 199

Death Trial: 129

DISPOSITION
Death: 98

Executed to Date: 32

Life: 29

On Death Row: 52

TDC: 1

Commuted to Life: 10

Acquittal: 1

Died Natural Causes: 4

Life: 179
Adult Cases:
504 Defendants
614 Victims

TDC: 31
Life Trial: 218

Probation: 1
Acquittal: 7
Life: 76

Plea-Bargain: 157

TDC: 78
DADJ: 3

Abbreviations: TDC = Texas Department of Corrections; DADJ = De

STATUS

ferred Adjudication.

2 to

33

Table 2. Measurement Strategies, Data Sources, and Means for the Independent Variables
Variable
Measurement
Data Source1
Mean
Defendant Race
White
1 = yes
JIMS
.24
Hispanic
1 = yes
JIMS
.23
Black
1 = yes
JIMS
.49
Asian
1 = yes
JIMS
.03
Victim Race
White
1 = yes
VSMF
.41
Hispanic
1 = yes
VSMF
.24
Black
1 = yes
VSMF
.28
Asian
1 = yes
VSMF
.10
Controls
Legal Dimensions of Case
Heinous Level 1
1 = yes
HC
.27
Heinous Level 2
1 = yes
HC
.51
Heinous Level 3
1 = yes
HC
.22
Multiple Defendants Indicted on Case
1 = yes
GJI
.49
Form of Capital Murder: Robbery
1 = yes
GJI
.72
Form of Capital Murder: Burglary
1 = yes
GJI
.10
Form of Capital Murder: Multiple Victims 1 = yes
GJI
.17
Form of Capital Murder: Kidnapping
1 = yes
GJI
.10
Form of Capital Murder: Rape
1 = yes
GJI
.06
Form of Capital Murder: Remunerate
1 = yes
GJI
.05
Form of Capital Murder: Child
1 = age 0 to 5
GJI
.03
Form of Capital Murder: Other
1 = yes
GJI
.02
Method of Murder: Shot
1 = yes
HCME
.74
Method of Murder: Beaten
1 = yes
HCME
.14
Method of Murder: Stabbed
1 = yes
HCME
.10
Method of Murder: Asphyxiated
1 = yes
HCME
.09
Defendant Social Characteristics
Teen
1 = 17 to 19
JIMS
.37
Young Adult
1 = 20 to 29
JIMS
.44
Adult
1 = > 30
JIMS
.19
Sex
1 = male
JIMS
.95
Prior Violent Conviction
1 = yes
JIMS
.19
Prior Non-Violent Conviction
1 = yes
JIMS
.45
Appointed Attorney
1 =appointed only
JIMS
.73
Victim Social Characteristics
Vulnerable Age
1 = age 6-16 or > 60
VSMF
.12
Sex
1 = female
VSMF
.27
Prior Conviction
1 = yes
www.publicdata.com
.14
Note:
1. Abbreviations: JIMS = Justice Information Management System; VSMF = Vital Statistics Mortality File; HC = The
Houston Chronicle; GJI = Grand Jury Indictment; HCME = Harris County Medical Examiner.

34

Table 3. Aggravating and Mitigating Circumstances used to Construct Measure of Heinousness
Aggravating Circumstances
Mitigating Circumstances
Victim vulnerable (e.g. handicapped, mental
∞ Defendant showed remorse
retardation, frail, pregnant, etc.)
∞ Victim aroused defendant's sexual desire at
∞ Victim suffered physical torture (methodical
time of homicide
infliction of severe pain)
∞ Victim aroused defendant's fear for life at time
∞ Victim suffered mental torture (e.g. hostage
of homicide
informed of impending death before homicide)
∞ Victim provoked defendant – verbal abuse or
∞ Unnecessary pain (pain that is not necessary to
physical attack at time of homicide
kill the victim given the method of killing)
∞ Victim provoked defendant – verbal abuse or
∞ Victim suffered lingering death
physical attack of someone defendant cares
∞ Victim suffered brutal beating – stomping,
about
clubbing, etc
∞ Victim aroused defendant's hate on a previous
∞ Victim bound/gagged
occasion
∞ Victim ambushed
∞ Victim had used alcohol or drugs immediately
∞ Execution style murder (methodical,
prior to crime
passionless killing of subdued/defenseless
∞ Victim showing or talking about large amounts
victim)
of money
∞ Killing unnecessary to complete felony (e.g.
∞ History of bad blood between defendant and
store-keeper turns over money and then shot)
victim
∞ Victim plead for life
∞ Victim consents to killing
∞ Defendant expressed pleasure regarding killing
∞ Victim was a participant in the crime
∞ Defendant violated victim's dead body (e.g.
∞ Victim engaged in questionable behavior
mutilation, sexual assault)
∞ Defendant mental impairment
∞ Victim disrobed
∞ Defendant engaged in significant planning for
murder
∞ Defendant attempted to dispose/conceal body
of the victim
∞ Victim killed in presence of family members or
friends
∞ Defendant used multiple methods for killing
∞ Overkill
The list of aggravating and mitigating circumstances was derived from Baldus et al. (1990: 526-535).
∞

Table 4: Case Trajectory and Case Disposition by Race (N=504)
Table 4: Case Trajectory and Case Disposition by Race (N=504)

35

Trajectory
(in percentages)
Plea
Bargain

Life
Trial

Death
Trial

Disposition
(in percentages)
Acquit

Deferred
Adjudication

Probation

TDC

(N)
Life

Death
Sentence

Panel A: Defendant Race
White
38
35
27
2
2
0
24
52
21
122
Hispanic
31
45
25
1
1
1
23
56
19
118
Black
28
47
25
2
0
0
22
57
19
249
Asian
33
40
27
0
0
0
0
80
20
15
Panel B: Victim Race
White
30
40
30
1
1
1
22
53
23
205
Hispanic
30
45
26
3
1
0
21
55
21
121
Black
29
48
23
2
0
0
24
56
18
141
Asian
42
42
17
0
2
0
13
73
13
48
Notes:
1. Abbreviation: TDC refers to a period of confinement in the Texas Department of Corrections for some period less than life.
2. Panel A has 504 cases because the data include 504 defendants. Panel B has 515 cases because 11 defendants killed multiple victims
of two different races.

Table 5. Odds Ratios from the Logistic Regression of Case Trajectory on Race (n = 504)

36

Death Trial
Defendant Race
Hispanic
Black

1.043
1.752

Victim Race
Hispanic

1.045

Black

.565

Control
Legal Dimensions of Case
Heinous Level 2

1.890

Heinous Level 3

2.285

Multiple Defendants Indicted On Case

.268

Type of Capital Murder: Burglary

.497

Type of Capital Murder: Multiple Victims

2.508

Type of Capital Murder: Kidnapping

2.235

Type of Capital Murder: Rape

2.565

Type of Capital Murder: Remunerate

11.900

Type of Capital Murder: Child

.794

Type of Capital Murder: Other

10.376

Method of Murder: Beaten

1.031

Method of Murder: Stabbed

1.617

Method of Murder: Asphyxiated

1.103

Defendant Social Characteristics
Young Adult

1.056

Adult

1.050

Male

5.822

Prior Violent Conviction

2.030

Prior Non-Violent Conviction

1.278

Appointed Attorney

1.237

Victim Social Characteristics
Vulnerable Age

1.748

Female

2.697

Prior Conviction

.511
Notes:
1. Reference categories: defendant race = white; victim race = white; heinousness = level 1; type of capital murder =
robbery; method of murder = shot; defendant age = teen.
2. Other type of capital murder includes arson, obstruction/retaliation, and killing a police officer.
3. The odds ratio for Asian defendant is 1.773. The odds ratio for Asian victim is .853.
Table 6. Explaining the Relationship Between Black Defendant and Case Trajectory

37

Victim Race
White
Hispanic
Black
Asian
Heinousness
Level 1
Level 2
Level 3
Type of Capital Murder
Robbery
Burglary
Child
Multiple Victims
Kidnapping
Remunerate
Rape
Other
Method of Murder
Shot
Beaten
Stabbed
Asphyxiated
Defendant Age
Teen
Young Adult
Adult
Victim Vulnerable Age
17 to 60
6 to 16 or > 60
Victim Gender
Male
Female

Black Defendant
(in percentages)

White Defendant
(in percentages)

Death Trial
(in percentages)

26
16
53
8

77
13
3
8

30
26
23
17

28
54
18

22
55
23

14
26
38

79
8
2
15
8
4
4
1

61
12
7
16
14
9
6
2

19
24
35
38
41
50
63
75

86
8
7
6

47
25
20
16

23
29
35
46

37
49
14

27
36
37

18
26
39

89
9

79
15

23
46

74
26

62
38

17
49

Table 7. Odds Ratios from Logistic Regression of Case Disposition on Race (N = 504)

38

Death Sentence
Defendant Race
Hispanic
Black

.966
1.491

Victim Race
Hispanic

1.186

Black

.615

Controls
Legal Dimensions of Case
Heinous Level 2

1.162

Heinous Level 3

2.793

Multiple Defendants Indicted On Case

.316

Type of Capital Murder: Burglary

.621

Type of Capital Murder: Multiple Victims

1.886

Type of Capital Murder: Kidnapping

1.474

Type of Capital Murder: Rape

2.104

Type of Capital Murder: Remunerate

7.166

Type of Capital Murder: Child

.523

Type of Capital Murder: Other

2.964

Method of Murder: Beaten

1.038

Method of Murder: Stabbed

1.803

Method of Murder: Asphyxiated

1.624

Defendant Social Characteristics
Young Adult

.997

Adult

.940

Male

3.816

Prior Violent Conviction

1.966

Prior Non-Violent Conviction

.908

Appointed Attorney

2.154

Victim Social Characteristics
Vulnerable Age

1.505

Female

2.044

Prior Conviction

.569
Notes:
1. Reference categories: defendant race = white; victim race = white; heinousness = level 1; type of capital murder =
robbery; method of murder = shot; defendant age = teen.
2. Other type of capital murder includes arson, obstruction/retaliation, and killing a police officer.
3. The odds ratio for Asian defendant is 1.518. The odds ratio for Asian victim is .865.
Table 8. Using Predicted Probabilities (PP) to Illuminate Black-White Disparities
Death
Conditional Probability: Death Sentence if Death Trial

Death

39

Panel A. Race of Defendant
Black
White
Panel B. Race of Victim
White
Black

Trial

(PP Death Trial)(X) = PP Death Sentence
X = (PP Death Sentence) / (PP Death Trial)

Sentence

.23
.15

.74
.80

.17
.12

.22
.13

.68
.77

.15
.10