
Pjim04
Download original document:
Document text
Document text
This text is machine-read, and may contain errors. Check the original document to verify accuracy.
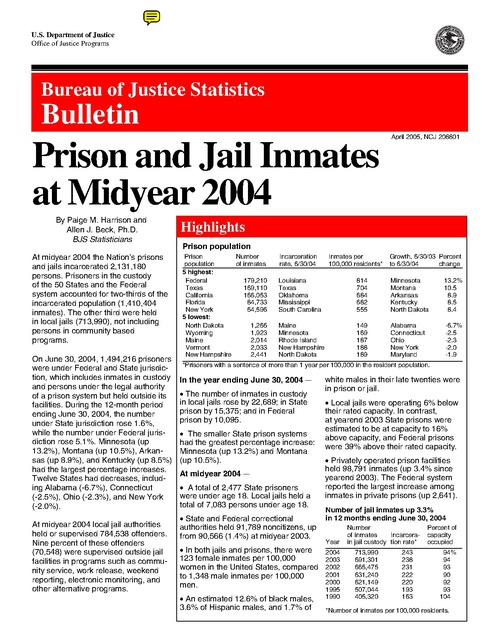
U.S. Department of Justice
Office of Justice Programs

Bureau of Justice Statistics

Bulletin
April 2005, NCJ 208801

Prison and Jail Inmates
at Midyear 2004
By Paige M. Harrison and
Allen J. Beck, Ph.D.
BJS Statisticians
At midyear 2004 the Nation’s prisons
and jails incarcerated 2,131,180
persons. Prisoners in the custody
of the 50 States and the Federal
system accounted for two-thirds of the
incarcerated population (1,410,404
inmates). The other third were held
in local jails (713,990), not including
persons in community based
programs.
On June 30, 2004, 1,494,216 prisoners
were under Federal and State jurisdiction, which includes inmates in custody
and persons under the legal authority
of a prison system but held outside its
facilities. During the 12-month period
ending June 30, 2004, the number
under State jurisdiction rose 1.6%,
while the number under Federal jurisdiction rose 5.1%. Minnesota (up
13.2%), Montana (up 10.5%), Arkansas (up 8.9%), and Kentucky (up 8.5%)
had the largest percentage increases.
Twelve States had decreases, including Alabama (-6.7%), Connecticut
(-2.5%), Ohio (-2.3%), and New York
(-2.0%).
At midyear 2004 local jail authorities
held or supervised 784,538 offenders.
Nine percent of these offenders
(70,548) were supervised outside jail
facilities in programs such as community service, work release, weekend
reporting, electronic monitoring, and
other alternative programs.

Highlights
Prison population
Prison
Number
population
of inmates
5 highest:
Federal
179,210
Texas
169,110
California
166,053
Florida
84,733
New York
64,596
5 lowest:
North Dakota
1,266
Wyoming
1,923
Maine
2,014
Vermont
2,033
New Hampshire
2,441

Incarceration
rate, 6/30/04

Inmates per
100,000 residents*

Growth, 6/30/03 Percent
to 6/30/04
change

Louisiana
Texas
Oklahoma
Mississippi
South Carolina

814
704
684
682
555

Minnesota
Montana
Arkansas
Kentucky
North Dakota

13.2%
10.5
8.9
8.5
8.4

Maine
Minnesota
Rhode Island
New Hampshire
North Dakota

149
169
187
188
189

Alabama
Connecticut
Ohio
New York
Maryland

-6.7%
-2.5
-2.3
-2.0
-1.9

*Prisoners with a sentence of more than 1 year per 100,000 in the resident population.

In the year ending June 30, 2004 C
• The number of inmates in custody
in local jails rose by 22,689; in State
prison by 15,375; and in Federal
prison by 10,095.
• The smaller State prison systems
had the greatest percentage increase:
Minnesota (up 13.2%) and Montana
(up 10.5%).
At midyear 2004 C
• A total of 2,477 State prisoners
were under age 18. Local jails held a
total of 7,083 persons under age 18.
• State and Federal correctional
authorities held 91,789 noncitizens, up
from 90,566 (1.4%) at midyear 2003.
• In both jails and prisons, there were
123 female inmates per 100,000
women in the United States, compared
to 1,348 male inmates per 100,000
men.
• An estimated 12.6% of black males,
3.6% of Hispanic males, and 1.7% of

white males in their late twenties were
in prison or jail.
• Local jails were operating 6% below
their rated capacity. In contrast,
at yearend 2003 State prisons were
estimated to be at capacity to 16%
above capacity, and Federal prisons
were 39% above their rated capacity.
• Privately operated prison facilities
held 98,791 inmates (up 3.4% since
yearend 2003). The Federal system
reported the largest increase among
inmates in private prisons (up 2,641).
Number of jail inmates up 3.3%
in 12 months ending June 30, 2004
Year
2004
2003
2002
2001
2000
1995
1990

Number
of inmates
Incarcerain jail custody tion rate*
713,990
691,301
665,475
631,240
621,149
507,044
405,320

243
238
231
222
220
193
163

Percent of
capacity
occupied
94%
94
93
90
92
93
104

*Number of inmates per 100,000 residents.

Since midyear 2003 the total incarcerated population has increased 2.3%
(table 1). Including inmates in public
On June 30, 2004, 1,410,404 inmates
and privately operated facilities, the
were in the custody of State and
number of inmates in State prisons
Federal prison authorities, and 713,990 increased 1.3%; in Federal prisons,
inmates were in the custody of local jail 6.3%; and in local jails, 3.3%. At
authorities. In the first 6 months of
midyear 2004, Federal prisons (includ2004, the Nation’s prison population
ing all secure and non-secure public
increased 24,079 (1.7%). These data
and private facilities) held 8.3% of all
were collected in the 2004 National
inmates, up from 5.6% in 1995.
Prisoner Statistics program and the
2003 Annual Survey of Jails. (See
Between yearend 1995 and midyear
Methodology, page 11, for a descrip2004, the incarcerated population grew
tion of data collections.)
an average of 3.5% annually.
Incarceration rate for Nation
reaches 726 per 100,000 residents

Table 1. Number of persons held in State or Federal prisons
or in local jails, 1995-2004
Total inmates
in custody

Year
1995
2000b
2001b
2002b
2003b
June 30
December 31
2004b
June 30

Prisoners in custody
Federal
State

Inmates held
in local jails

Total incarceration ratea

1,585,586
1,935,919
1,961,247
2,033,022

89,538
133,921
143,337
151,618

989,004
1,176,269
1,180,155
1,209,331

507,044
621,149
631,240
665,475

601
683
685
701

2,082,728
--

159,275
161,673

1,225,659
1,224,652

691,301
--

716
726

2,131,180

169,370

1,241,034

713,990

Percent change,
6/30/03- 6/30/04

2.3%

6.3%

1.3%

3.3%

Annual average
increase,
12/31/95 - 6/30/04

3.5%

7.8%

2.7%

4.1%

Note: Jail counts are for midyear (June 30) and exclude persons who were supervised
outside of a jail facility. State and Federal prisoner counts for 1995-2003 are for December 31.
--Not available.
a
Persons in custody per 100,000 residents in each reference year.
b
Total counts include Federal inmates in non-secure privately operated facilities (6,143 in 2000,
6,192 in 2001, 6,598 in 2002, 6,493 (June) and 6,471 (December) in 2003, and 6,786 in June,
2004).

Percent change during 6-month periods in the number of prisoners
under the jurisdiction of State correctional authorities, 1995-2004
Percent change
5%

3%
2%

Jan.June

1%

JulyDec

0%
1995

In the 12 months before midyear 2004,
the number of inmates in prison and
jail rose an estimated 48,452 inmates,
or 932 inmates per week.
The rate of incarceration in prison and
jail in 2003 was 726 inmates per
100,000 U.S. residents C up from 716
at midyear 2003. At midyear 2004,
1 in every 138 U.S. residents were
in prison or jail.
Federal system growth continues
to outpace that of States
The rate of growth of the State prison
population slowed between 1995 and
2001 and then began to rise. During
this time, the percentage change in the
first 6 months of each year steadily
decreased, reaching a low of 0.6% in
2001, and then rose to 1.5% in 2004
(table 2). The percentage change in
the second 6 months of each year
showed a similar trend, resulting in an
actual decrease in State prison populations for the second half of 2000 and
2001.
Since 1995 the Federal system has
grown at a much higher rate than the
States, peaking at 6% growth in the
first 6 months of 1999. In the first 6
months of 2004, the number of Federal
inmates increased 3.6% (more than
twice the rate of State growth).
Growth rates in Federal
prison population at 6-month
intervals
January
July to
to June
December

4%

-1%

During this period the Federal and
State prison populations and the local
jail population grew at the average
annual rates of 7.8%, 2.7%, and 4.1%,
respectively.

1996

1997

1998

1999

2000

Figure 1

2 Prison and Jail Inmates at Midyear 2004

2001

2002

2003

2004

2004
3.6%
2003
4.2
2002
3.0
2001
5.1 .
2000
5.4
1999
6.0
1998
5.3
1997
4.4
1996
3.5
1995
4.7
-- Not available

-- %
1.5
1.1
2.8
2.0
3.7
3.5
2.6
1.8
0.8

Some of the Federal growth since
1999 has been the result of the transfer of responsibility for housing
sentenced felons from the District of
Columbia. The transfer to Federal
facilities was completed by yearend
2001. Since then, the Federal system
has continued to receive sentenced
felons from DC Superior Court.
In absolute numbers, the total increase
of 30,019 State and Federal prison
inmates between July 1, 2003, and
June 30, 2004, was significantly lower
than the growth during the previous
12-month period (44,260 inmates).
The percentage change from midyear
2003 to midyear 2004 (2.1%) was also
smaller the 2002-03 increase (3.1%).
The average annual growth from 1995
to 2004 was 3.4%.

Years

Annual increase in the
number of prisoners
under State or Federal
jurisdiction, July 1-June 30
Number
Percent

2003-04
2002-03
2001-02
2000-01

30,019
44,260
20,587
14,587

2.1%
3.1
1.5
1.0

1999-00
1998-99
1997-98
1996-97
1995-96

30,710
56,059
57,726
56,710
57,507

2.3
4.4
4.7
4.9
5.2

Average growth,
1995-2004
40,907

3.4

Federal system accounts for over
25% of inmate population increase
Twenty-nine percent of the Nation’s
prison population during the 12 months
ending June 30, 2004, was accounted
for by the 8,749 additional inmates
under jurisdiction of the Federal
system. During this 12-month period,
several States also experienced
substantial growth, including Minnesota
(13.2%), Montana (10.5%), and Arkansas (8.9%).
Twelve States experienced a decline
in their prison population. Alabama
had the largest percentage decrease
(-6.7%), followed by Connecticut
(-2.5%), Ohio (-2.3%), and New York
(-2.0%).

Table 2. Prisoners under the jurisdiction of State or Federal correctional
authorities, June 30 and December 31, 2003, and June 30, 2004

Region and
jurisdiction
U.S. total
Federal
State

Percent change from C
Total
6/30/03 to 12/31/03 to
6/30/04 12/31/03 6/30/03
6/30/04
6/30/04
1,494,216 1,468,530 1,464,197
2.1%
1.7%
179,210
173,059
170,461
1,315,006 1,295,471 1,293,736

Prison incarceration rate,
6/30/04a
486

5.1%
1.6

3.6%
1.5

53
433

Northeast
Connecticutb
Maine
Massachusettsc
New Hampshire
New Jerseyd
New York
Pennsylvania
Rhode Islandb
Vermontb

173,967
20,018
2,014
10,365
2,441
28,107
64,596
40,692
3,701
2,033

173,330
19,846
2,013
10,232
2,434
27,246
65,198
40,890
3,527
1,944

175,753
20,525
2,009
10,511
2,483
28,213
65,914
40,545
3,569
1,984

-1.0%
-2.5
0.2
-1.4
-1.7
-0.4
-2.0
0.4
3.7
2.5

0.4%
0.9
0.0
1.3
0.3
3.2
-0.9
-0.5
4.9
4.6

299
379
149
234
188
323
336
328
187
236

Midwest
Illinoisd
Indiana
Iowa
Kansasd
Michigan
Minnesota
Missouri
Nebraska
North Dakota
Ohiod
South Dakota
Wisconsin

249,965
44,379
23,760
8,611
9,152
48,591
8,613
30,775
4,042
1,266
44,770
3,101
22,905

247,388
43,418
23,069
8,546
9,132
49,358
7,865
30,303
4,040
1,239
44,778
3,026
22,614

247,464
43,186
22,576
8,395
9,009
49,524
7,612
30,649
4,103
1,168
45,831
3,059
22,352

1.0%
2.8
5.2
2.6
1.6
-1.9
13.2
0.4
-1.5
8.4
-2.3
1.4
2.5

1.0%
2.2
3.0
0.8
0.2
-1.6
9.5
1.6
0.0
2.2
0.0
2.5
1.3

378
349
380
292
335
480
169
536
227
189
391
402
394

South
Alabama
Arkansas
Delawareb
Florida
Georgiae
Kentucky
Louisiana
Maryland
Mississippi
North Carolina
Oklahomad
South Carolina
Tennessee
Texas
Virginia
West Virginia

598,246
26,521
13,477
6,973
84,733
48,625
17,763
36,745
23,727
20,429
34,917
24,767
24,173
25,834
169,110
35,472
4,980

586,299
27,913
13,084
6,794
82,012
47,208
16,622
36,047
23,791
20,589
33,560
22,821
23,719
25,403
166,911
35,067
4,758

585,211
28,440
12,378
6,879
80,352
47,004
16,377
36,091
24,186
20,542
33,334
23,004
24,247
25,409
167,532
34,733
4,703

2.2%
-6.7
8.9
1.4
5.5
3.4
8.5
1.8
-1.9
-0.6
4.7
7.7
-0.3
1.7
0.9
2.1
5.9

2.0%
-5.0
3.0
2.6
3.3
3.0
6.9
1.9
-0.3
-0.8
4.0
8.5
1.9
1.7
1.3
1.2
4.7

543
554
487
487
489
551
413
814
416
682
358
684
555
439
704
474
272

West
Alaskab
Arizonae
California
Coloradod
Hawaiib
Idaho
Montana
Nevada
New Mexico
Oregon
Utah
Washington
Wyoming

292,828
4,515
31,631
166,053
19,756
5,946
6,312
3,800
10,971
6,341
13,219
5,802
16,559
1,923

288,454
4,527
31,170
164,487
19,671
5,828
5,887
3,620
10,543
6,223
12,715
5,763
16,148
1,872

285,308
4,431
30,741
163,361
19,085
5,635
5,825
3,440
10,527
6,145
12,422
5,603
16,284
1,809

2.6%
1.9
2.9
1.6
3.5
5.5
8.4
10.5
4.2
3.2
6.4
3.6
1.7
6.3

1.5%
-0.3
1.5
1.0
0.4
2.0
7.2
5.0
4.1
1.9
4.0
0.7
2.5
2.7

421
367
506
457
429
320
454
410
468
319
366
239
264
382

Note: The District of Columbia inmates sentenced to more than 1 year are now under the
responsibility of the Federal Bureau of Prisons.
a
The number of prisoners with a sentence of more than 1 year per 100,000 residents.
b
Prison and jails form an integrated system. Data include total jail and prison population.
c
The incarceration rate includes an estimated 6,200 inmates sentenced to more than 1 year
but held in local jails or houses of corrections.
d
Includes some inmates who were sentenced to 1 year or less rather than a year or more.
e
Population figures are based on custody counts.

Prison and Jail Inmates at Midyear 2004

3

Prison incarceration rates continue to rise

Table 3. Prisoners held in private facilities,
December 31, 2003, and June 30, 2004

Region and
jurisdiction
U.S. total
Federalc
State

Inmates held in private facilitiesa
Percent of
all inmatesb
Number
6/30/04 12/31/03
6/30/04
98,791
95,522
6.6%
24,506
21,865
13.7
74,285
73,657
5.6

Northeast
Connecticut
Maine
Massachusetts
New Hampshire
New Jersey
New York
Pennsylvania
Rhode Island
Vermont

3,328
0
0
0
0
2,566
0
361
0
401

3,201
0
30
0
0
2,636
0
535
0
0

1.9%
0
0
0
0
9.1
0
0.9
0
19.7

Midwest
Illinois
Indiana
Iowa
Kansas
Michigan
Minnesota
Missouri
Nebraska
North Dakota
Ohio
South Dakota
Wisconsin

3,854
0
655
0
0
480
268
0
0
47
1,903
8
493

4,957
0
652
0
0
480
0
0
0
0
1,901
25
1,899

1.5%
0
2.8
0
0
1.0
3.1
0
0
3.7
4.3
0.3
2.2

South
Alabama
Arkansas
Delaware
Florida
Georgia
Kentucky
Louisiana
Maryland
Mississippi
North Carolina
Oklahoma
South Carolina
Tennessee
Texas
Virginia
West Virginia

47,706
153
0
0
4,327
4,597
1,679
2,923
126
4,397
217
5,675
17
5,121
16,906
1,568
0

48,222
1,698
0
0
4,330
4,589
1,640
2,918
122
3,463
215
6,022
44
5,049
16,570
1,562
0

8.0%
0.6
0
0
5.1
9.5
9.5
8.0
0.5
21.5
0.6
22.9
0.1
19.8
10.0
4.4
0

West
Alaska
Arizona
California
Colorado
Hawaii
Idaho
Montana
Nevada
New Mexico
Oregon
Utah
Washington
Wyoming

19,397
1,304
4,371
2,797
3,074
1,621
1,269
1,060
455
2,649
0
0
232
565

17,277
1,386
2,323
3,507
3,013
1,478
1,267
1,059
0
2,751
0
0
0
493

6.6%
28.9
13.8
1.7
15.6
27.3
20.1
27.9
4.1
41.8
0
0
1.4
29.4

a

Excludes inmates in publicly operated State or local
facilities.
b
Based on the total number of inmates under State or
Federal jurisdiction.
c
Includes 6,786 and 6,471 Federal inmates held in
privately operated community correctional centers on
6/30/04 and 12/31/03, respectively.

4 Prison and Jail Inmates at Midyear 2004

The incarceration rate of State and Federal prisoners sentenced to
more than 1 year was 486 per 100,000 U.S. residents on June 30,
2004, up from 482 per 100,000 on December 31, 2003. At midyear
2004, 12 States led by Louisiana (814 sentenced prisoners per
100,000 State residents), Texas (704), and Oklahoma (684),
exceeded the national rate. Nine States, including Maine (149),
Minnesota (169), and North Dakota (189) C had rates that were less
than half of the national rate.
Overall, the State incarceration rate rose about 14% between yearend
1995 and midyear 2004, from 379 to 433 prisoners per 100,000 U.S.
residents. At the same time, the Federal incarceration rate rose
almost 66%, from 32 to 53 prisoners per 100,000 U.S. residents.
Since yearend 1995 the total number of sentenced inmates per
100,000 residents has risen from 411 to 486. During this period prison
incarceration rates rose the most in the Midwest (from 310 to 378),
followed by the West (from 358 to 421) and the South (from 483 to
543). The rate in the Northeast decreased slightly from 301 to 299.
Number of sentenced inmates
per 100,000 U.S. residents on December 31C
State
Federal
Totala
1995
379
32
411
1996
393
33
427
1997
409
35
444
1998
421
38
460
1999b
422
40
462
2000
426
42
469
2001
422
48
470
2002
427
49
476
2003
430
52
482
2004, midyear
433
53
486
a

Totals may not add due to rounding.
Rates for 1999 adjusted using the 2000 Census of Population and Housing
to estimate the December 31, 1999, resident population.

b

A quarter of inmates in private facilities held for Federal system
In the first 6 months of 2004, the number of prisoners held in privately
operated facilities increased from 95,522 to 98,791, an increase of
3.4% (table 3). Overall, private facilities held 6.6% of all State and
Federal inmates, up from 6.5% at midyear 2003. The Federal system
(24,506), Texas (16,906), Oklahoma (5,675), and Tennessee (5,121)
reported the largest number of inmates in private facilities at midyear
2004. Five States, all in the West, had at least a quarter of their
prisoners in private facilities.

06/30/04
12/31/03
06/30/03
12/31/02
06/30/02
12/31/01
06/30/01
12/31/00

Number of inmates held in privately operated facilities
Total
State
Federal
Percent of all inmates
98,791
74,285
24,506
6.6%
95,522
73,657
21,865
6.5
94,406
73,034
21,372
6.5
93,912
73,638
20,274
6.5
88,576
68,283
20,293
6.2
91,953
72,702
19,251
6.5
94,948
76,763
18,185
6.8
90,542
75,018
15,524
6.5

Female inmate population continues
to rise at a faster rate than male
inmate population

Table 5. Number of inmates under age
18 held in State prisons, by gender,
June 30, 1990, 1995, and 1999-2004

From June 30, 2003, to June 30, 2004,
the number of women under the jurisdiction of State and Federal prison
authorities grew from 100,384 to
103,310, an increase of 2.9% (table 4).
The number of men rose 2.0%, from
1,363,813 to 1,390,906. At midyear
2004, California, Texas, Florida, and
the Federal system housed 4 of every
10 female inmates.

Year
2004
2003
2002
2001
2000
1999

Since 1995 the annual rate of growth
in the number of female inmates has
averaged 5.0%, higher than the 3.3%
average increase of male inmates.
Women accounted for 6.9% of all
inmates at midyear 2004, up from
6.1% at yearend 1995.
Relative to their number in the U.S.
resident population, men were almost
15 times more likely than women to be
incarcerated in a State or Federal
prison. On June 30, 2004, the rate for
inmates serving a sentence of more
than 1 year was 63 female inmates per
100,000 women in the United States,
compared to 923 sentenced male
inmates per 100,000 men.
Table 4. Prisoners under the
jurisdiction of State or Federal
correctional authorities, by gender,
1995, 2003, and 2004
Men
All inmates
6/30/04
6/30/03
12/31/95
Percent change,
2003-2004
Average annual,
1995-2004

Women

1,390,906
1,363,813
1,057,406

103,310
100,384
68,468

2.0%

2.9%

3.3%

5.0%

Sentenced to more
than 1 year
6/30/04
6/30/03
12/31/95

1,333,791
1,308,891
1,021,059

94,192
91,245
63,963

Incarceration rate*
6/30/04
6/30/03
12/31/95

923
915
789

63
62
47

Inmates under age 18
Total
Male
Female
2,477
2,369
108
2,740
2,627
113
3,038
2,927
111
3,147
3,010
137
3,896
3,721
175
4,194
4,027
167

Year
2004
2003
2002
2001
2000
1999
1998

1995
5,309
--3,600
--1990
Note: Federal prisons held 39 inmates under
age 18 in 1990, but none in 1995 and 1999
to 2004.
--Not available.

A total of 2,477 State prisoners were
under age 18 on June 30, 2004, down
nearly 10% from 2,740 at midyear
2003 (table 5). The number of minors
held in State prisons peaked in 1995 at
5,309, and has since decreased every
year. Overall, 0.2% of all State prisoners were under age 18.
Eight States reported more than 100
prisoners under age 18 at midyear
2004, led by Connecticut (321), New
York (225), Florida (214), and Texas
(210). Three of these States reported
an increase in their under age 18
populations held in prison during the 12
months ending June 30, 2004, while
the rest experienced declines.
Six states reported no inmates under
age 18, and another twelve states had
fewer than 10 inmates under age 18.

6/30/04
Connecticut
321
New York
225
Florida
214
Texas
210
North Carolina
192
California
123
South Carolina
114
Illinois
110

6/30/03
300
231
298
218
178
147
140
102

Total
91,789
90,566
88,677
87,917
89,676
88,811
77,099

Percent change,
2003-2004
1.4%

Number of State inmates under age
18 continues to decline

Number of prisoners under age 18

Table 6. Number of noncitizens held
in State or Federal prisons at midyear,
1998-2004

Percent
change
7.0%
-2.6
-28.2
-3.7
7.9
-16.3
-18.6
7.8

Noncitizen inmates
Federal
State
34,422
57,367
34,456
56,110
33,873
54,804
33,886
54,031
36,090
53,586
33,765
55,046
27,682
49,417
-0.1%

2.3%

At midyear 2004, 62% of noncitizen
prisoners held in State facilities;
38% in Federal facilities
On June 30, 2004, 91,789 noncitizens
were in the custody of State or Federal
correctional authorities, up from 90,566
at midyear 2003 (table 6). Overall,
6.5% of State and Federal inmates at
midyear 2004 were not U.S. citizens.
The noncitizen prisoner population
increased between 1998 and 1999,
and since then has remained nearly
stable, increasing about 3.4% between
midyear 1999 and midyear 2004.
At midyear 2004, 34,422 Federal
inmates were noncitizens, representing over 20% of all prisoners in Federal
custody. California (17,890), Texas
(9,048), New York (8,027), Florida
(4,834), and Arizona (3,924) held over
75% of all noncitizens confined in State
prison. Noncitizen prisoners
accounted for over 10% of the prison
populations of Arizona, New York,
Nevada, and California.

Federal
California
Texas
New York*
Florida

Noncitizens held in
prison
6/30/04 6/30/03
34,442
34,456
17,890
18,569
9,048
8,563
8,027
8,370
4,834
4,739

Percent of
inmates
6/30/04
20.3%
10.9
5.8
12.4
5.9

Arizona
3,924
3,670
12.6
Nevada
1,242
1,091
11.7
Georgia
1,204
1,030
2.5
Washington
1,076
1,262
6.3
Colorado
1,022
924
5.2
*New York reports foreign-born inmates rather
than noncitizens.

*The total number of prisoners with a
sentence of more than 1 year per
100,000 U.S. residents.

Prison and Jail Inmates at Midyear 2004

5

Growth continues as rising
admissions outpace releases
From 2000 to 2003 admissions to
State prison rose 9.1% (from 581,487
in 2000 to 634,149 in 2003). During
2003, 612,185 sentenced prisoners
were released from State prisons, up
from 569,599 in 2000 C an increase
of 7.5% (table 7).
Admissions to the Federal prison
system increased 19.6% between
2000 and 2003 (from 43,732 to
52,288); releases increased 25.2%
(35,259 to 44,135). The number of
admissions to Federal prison in 2003
exceeded releases by more than 8,000
inmates.
New court commitments on the rise
Prior to 1998 growth in prison admissions reflected increasing numbers
of offenders returning for parole violations. Between 1990 and 1998, the
number of returned parole violators
increased 54% (from 133,870 to
206,152), while the number of new
court commitments increased 7%
(from 323,069 to 347,270).
However, since 1998 parole violators
returned to prison increased by less
than 2%, while new court commitments
rose 15.1%.

State prison admissions
Parole
New court
Alla
commitments violatorsb
Year
1990
460,739
323,069
133,870
1995
521,970
337,492
175,726
1998
565,291
347,270
206,152
198,636
1999
575,415
345,648
2000
581,487
350,431
203,569
2001
593,838
365,714
215,450
2002
612,938
392,661
207,961
2003
634,149
399,843
209,753
a
Based on inmates with a sentence of more
than 1 year. Excludes escapes, AWOL’s, and
transfers to and from other jurisdictions.
b
Parole violators includes inmates with revoked
parole, other conditional release violators, and
intermediate sanctions imposed upon parolees
in lieu of revoking parole.

Table 7. Number of sentenced prisoners admitted and released from State
or Federal jurisdiction, by region and jurisdiction, 2000, and 2002-2003
Admissionsa

Region and
jurisdiction
U.S. total
Federal
State

Releasesa
Percent
Percent
change,
change,
2003
2002
2000 2000-03
2003
2002
2000 2000-03
686,437 661,082 625,219
9.8% 656,320 630,176 604,858
8.5%
52,288 48,144 43,732
634,149 612,938 581,487
71,171
6,571
931
2,185
1,139
14,398
26,040
14,039
3,881
1,987

70,879
7,169
1,026
1,833
1,113
14,576
26,216
13,401
3,760
1,785

67,765
6,185
751
2,062
1,051
13,653
27,601
11,777
3,701
984

Midwest
Illinois
Indiana
Iowa
Kansas
Michigan
Minnesota
Missouri
Nebraska
North Dakota
Ohio
South Dakota
Wisconsin

136,924
36,063
15,615
5,545
4,605
12,659
5,914
17,151
1,959
992
26,506
1,915
8,000

133,378
34,467
14,001
5,516
4,881
14,411
5,265
16,637
1,934
768
25,689
1,819
7,990

South
Alabama
Arkansas
Delawareb
Florida
Georgia
Kentucky
Louisiana
Maryland
Mississippi
North Carolina
Oklahoma
South Carolina
Tennessee
Texas
Virginia
West Virginia

243,826
9,524
7,132
2,212
39,500
17,575
9,595
15,353
10,170
8,421
9,494
8,139
9,934
13,059
69,921
11,700
2,097

230,283
7,033
7,080
-36,500
18,078
8,731
15,079
10,027
5,655
9,661
8,269
9,834
15,022
63,446
11,392
2,161

West
Alaska
Arizona
California
Colorado
Hawaii
Idaho
Montana
Nevada
New Mexico
Oregon
Utah
Washingtonb
Wyoming

Northeast
Connecticut
Maine
Massachusetts
New Hampshire
New Jersey
New York
Pennsylvania
Rhode Island
Vermontb

19.6
9.1
5.0%
6.2
24.0
6.0
8.4
5.5
-5.7
19.2
4.9
101.9

44,135 42,339 35,259
612,185 587,837 569,599
72,609
6,890
782
2,302
1,188
15,043
27,467
13,268
3,684
1,985

67,803
6,209
799
2,290
1,052
14,827
26,829
10,628
3,312
1,857

70,646
5,918
677
2,889
1,044
15,362
28,828
11,759
3,223
946

2.8%
16.4
15.5
-20.3
13.8
-2.1
-4.7
12.8
14.3
109.8

117,776
29,344
11,876
4,656
5,002
12,169
4,406
14,454
1,688
605
23,780
1,400
8,396

16.3% 136,590 129,803 114,382
22.9
35,372 36,162 28,876
31.5
14,146 13,337 11,053
19.1
6,074
5,748
4,379
-7.9
4,405
4,524
5,231
4.0
13,910 12,771 10,874
34.2
5,437
4,706
4,244
18.7
16,967 15,127 13,346
16.1
1,953
1,840
1,503
64.0
870
770
598
11.5
27,369 25,322 24,793
36.8
1,980
1,797
1,327
-4.7
8,107
7,699
8,158

19.4%
22.5
28.0
38.7
-15.8
27.9
28.1
27.1
29.9
45.5
10.4
49.2
-0.6

217,950
6,296
6,941
2,709
35,683
17,373
8,116
15,735
10,327
5,796
9,848
7,426
8,460
13,675
58,197
9,791
1,577

11.9% 231,896 221,733 210,777
51.3
10,167
7,472
7,136
2.8
7,120
7,640
6,308
-18.3
2,129
-2,260
10.7
34,679 33,728 33,994
1.2
17,333 16,608 14,797
18.2
9,208
8,313
7,733
-2.4
13,841 14,847 14,536
-1.5
10,207
9,617 10,004
45.3
7,679
5,592
4,940
-3.6
9,116
8,606
9,687
9.6
8,164
8,375
6,628
17.4
9,829
8,604
8,676
-4.5
13,768 13,541 13,893
20.1
65,169 64,720 59,776
19.5
11,606 10,033
9,148
33.0
1,881
1,807
1,261

10.0%
42.5
12.9
-5.8
2.0
17.1
19.1
-4.8
2.0
55.4
-5.9
23.2
13.3
-0.9
9.0
26.9
49.2

182,228 178,398 177,996
2,805
2,315
2,427
11,957 11,468
9,560
125,312 124,179 129,640
7,998
7,953
7,036
1,832
1,892
1,594
3,168
3,049
3,386
1,910
1,510
1,202
4,865
4,844
4,929
4,160
4,009
3,161
5,095
5,041
4,059
3,301
3,064
3,270
9,034
8,305
7,094
791
769
638

2.4% 171,090 168,498 173,794
15.6
2,736
2,230
2,599
25.1
10,391 10,056
9,100
-3.3
118,646 119,683 129,621
13.7
7,113
6,588
5,881
14.9
1,504
1,735
1,379
-6.4
3,033
2,855
2,697
58.9
1,642
1,518
1,031
-1.3
4,800
4,734
4,374
31.6
3,943
3,809
3,383
25.5
4,483
4,339
3,371
0.9
3,088
2,864
2,897
-9,067
7,401
6,764
24.0
644
686
697

-1.6%
5.3
14.2
-8.5
20.9
9.1
12.5
59.3
9.7
16.6
33.0
6.6
--7.6

Note: Excludes escapes, AWOL’s, and transfers to or from other jurisdictions.
--Data not reported or percent change not calculated.
a
Based on inmates under jurisdiction with a sentence of more than 1 year.
b
Data not comparable from year to year due to changing reporting methods.

6 Prison and Jail Inmates at Midyear 2004

25.2
7.5

At midyear the Nation’s jails
supervised 784,538 persons
As defined in this report, jails are
locally operated correctional facilities
that confine persons before or after
adjudication. Inmates sentenced to jail
usually have a sentence of 1 year or
less, but jails also incarcerate persons
in a wide variety of other categories.
(See box below.)
Based on the 2004 Annual Survey
of Jails, the Nation’s local jails held or
supervised 784,538 offenders on June
30, 2004 (table 8). Jail authorities
supervised 9% of these offenders
(70,548) in alternative programs
outside the jail facilities. A total
of 713,990 persons were housed
in local jails.
Jails C
y receive individuals pending arraignment and hold them awaiting trial,
conviction, or sentencing
y readmit probation, parole, and bailbond violators and absconders
y temporarily detain juveniles pending
transfer to juvenile authorities
y hold mentally ill persons pending
their movement to appropriate health
facilities
y hold individuals for the military, for
protective custody, for contempt,
and for the courts as witnesses
y release convicted inmates to the
community upon completion of
sentence
y transfer inmates to Federal, State,
or other authorities
y house inmates for Federal, State,
or other authorities because of
crowding of their facilities
y sometimes operate communitybased programs as alternatives to
incarceration

Among persons under community
supervision by jail staff in 2003, 19%
were required to perform community
service (13,171) and 16% participated
in a weekend reporting program
(11,589). Seventeen percent of offenders in the community were under
electronic monitoring; 20% were under
other pretrial supervision; 3% were in a
drug, alcohol, mental health, or other
type of medical treatment program;
and 14% were participating in a work
release or other alternative work
program.

Number of jail inmates rose 22,700
in 12 months ending June 30, 2004
Between July 1, 2003, and June 30,
2004, the number of persons held in
local jail facilities grew 3.3% C from
691,301 to 713,990. The 12-month
increase was similar to the average
annual growth (3.9%) from midyear
1995 to midyear 2004 (figure 2). The
3.3% growth in 2003 was less than last
year’s increase of 3.9%. In absolute
numbers, the total increase of 22,689
inmates in 2004 was 3,100 less than
the increase in 2003 (25,826).

Table 8. Persons under jail supervision, by confinement status
and type of program, midyear 1995, 2000, and 2002-04
Confinement status
and type of program
Total

1995
541,913

Held in jail

507,044

621,149

665,475

691,301

713,990

34,869

65,884

72,437

71,371

70,548

Supervised outside
a jail facilitya

Number of persons under jail supervision
2000
2002
2003
2004
687,033
737,912
762,672
784,538

Weekender programs
1,909
14,523
17,955
12,111
Electronic monitoring
6,788
10,782
9,706
12,678
Home detentionb
1,376
332
1,037
594
Day reporting
1,283
3,969
5,010
7,965
Community service
10,253
13,592
13,918
17,102
Other pretrial supervision
3,229
6,279
8,702
11,452
Other work programsc
9,144
8,011
5,190
4,498
d
Treatment programs
-5,714
1,256
1,891
Other/unspecified
887
2,682
9,663
3,080
--Not available.
a
Excludes persons supervised by a probation or parole agency.
b
Includes only those without electronic monitoring.
c
Includes persons in work release programs, work gangs, and other
work alternative programs.
d
Includes persons under drug, alcohol, mental health, and other medical treatment.

11,589
11,689
1,173
6,627
13,171
14,370
7,208
2,208
2,513

12-month growth rates for local jails, 1995-2004
Percent change in local jail population
from previous year, 1995-2004
10%
8%
6%
4%
2%
0%
1995 1996 1997 1998 1999 2000 2001 2002 2003 2004

Figure 2

y hold inmates sentenced to short
terms (generally under 1 year).
Prison and Jail Inmates at Midyear 2004

7

Jail incarceration rates rose in last
12-month period
Since 1995 the Nation’s jail population
on a per capita basis has increased
26%. During this period the number of
jail inmates per 100,000 residents rose
from 193 to 243.
Year
2004
2003
2002
2001
2000
1999b
1995

Number held
in jail

Jail incarceration
ratea

713,990
691,301
665,475
631,240
621,149
605,943
507,044

243
238
231
222
220
215
193

a

Number of jail inmates per 100,000
U.S. residents on July 1 of each year.
Rate for 1999 adjusted using the 2000
Census of Population and Housing to
estimate the July 1 resident population.
b

When individuals under community
supervision by jail authorities are
included with those in custody, the rate
was 267 persons per 100,000 U.S.
residents at midyear 2004.

convicted or were being held for trial as
adults in criminal court. The average
daily population for the year ending
June 30, 2004, was 706,242, an
increase of 3.7% from 2003 and 38.5%
from 1995.
Characteristics of jail inmate
population changing gradually
Male inmates made up 87.7% of the
local jail inmate population at midyear
2004 — 2.1 percentage points lower
than at midyear 1995 (table 10).
During the 12-month period ending
June 30, 2004, the number of adult
female inmates rose 6.6%, while the
number of adult male inmates
increased 2.8%. On average the adult
female jail population has grown 7.0%
annually in the past 10 years, while the
adult male inmate population has
grown 4.2%.

At midyear 2004 nearly 6 in 10 persons
in local jails were racial or ethnic
minorities. Whites made up 44.4% of
An estimated total of 7,083 persons
the jail population; blacks, 38.6%;
under age 18 were housed in adult jails
Hispanics, 15.2%; and other races
on June 30, 2004 (table 9). Nearly 9 in
(Asians, American Indians, Alaska
10 of these young inmates had been
Table 9. Average daily population and the number of men,
women, and juveniles in local jails, midyear 1995, 2000, and
2003-04
Average daily populationa

1995
509,828

2000
618,319

2003
680,760

2004
706,242

Number of inmates, June 30
Adults
Male
Female
Juvenilesb
Held as adultsc
Held as juveniles

507,044
499,300
448,000
51,300
7,800
5,900
1,800

621,149
613,534
543,120
70,414
7,615
6,126
1,489

691,301
684,431
602,781
81,650
6,869
5,484
1,385

713,990
706,907
619,908
86,999
7,083
6,159
924

Note: Data are for June 30. Detailed data for 1995 were estimated and
rounded to the nearest 100.
a
The average daily population is the sum of the number of inmates in a jail
each day for a year, divided by the total number of days in the year.
b
Juveniles are persons held under the age of 18.
c
Includes juveniles who were tried or awaiting trial as adults.

Natives, Native Hawaiians, and other
Pacific Islanders), 1.8%.
On a per capita basis, men were over
7 times more likely than women to
have been held in a local jail on June
30, 2004. Blacks were nearly 5 times
more likely than whites, nearly 3 times
more likely than Hispanics, and over 8
times more likely than persons of other
races to have been in jail.
Estimated
count
713,990

Total
Gender
Male
Female

Jail incarceration ratea
243

626,407
87,583

433
59

Race/Hispanic origin
Whiteb
317,400
Blackb
275,400
Hispanic
108,300
c
Other
12,900

160
765
262
88

Note: Inmate counts were estimated and
rounded to the nearest 100. Resident population
figures were estimated for July 1, 2004, based
on the 2000 Census of Population and Housing.
Non-Hispanic residents identifying two or more
races were excluded.
a
Number of jail inmates per 100,000 residents
in each group.
b
Non-Hispanic only.
c
Includes Asians, American Indians, Alaska
Natives, Native Hawaiians, and other Pacific
Islanders.

Table 10. Gender, race, Hispanic origin, and
conviction status of local jail inmates, midyear
1995, 2000, and 2003-04
Characteristic
Total

Percent of jail inmates
1995
2000
2003
2004
100%
100%
100%
100%

Gender
Male
Female

89.8%
10.2

88.6%
11.4

88.1%
11.9

87.7%
12.3

Race/Hispanic origin
Whitea
Blacka
Hispanic
Otherb

40.1%
43.5
14.7
1.7

41.9%
41.3
15.1
1.6

43.6%
39.2
15.4
1.8

44.4%
38.6
15.2
1.8

Conviction status
Convicted
Male
Female
Unconvicted
Male
Female

44.0%
39.7
4.3
56.0
50.0
6.0

44.0%
39.0
5.0
56.0
50.0
6.0

39.4%
34.7
4.7
60.6
53.5
7.1

39.7%
34.8
4.9
60.3
53.0
7.3

Note: Detail may not add to total because of rounding.
a
Non-Hispanic only.
b
Includes Asians, American Indians, Alaska Natives, Native
Hawaiians, and other Pacific Islanders.

8 Prison and Jail Inmates at Midyear 2004

On June 30, 2004, 60% of the Nation’s
jail inmates were awaiting court action
on their current charge. An estimated
283,500 inmates held in local jails were
serving a sentence in jail, awaiting
sentencing, or serving time for a probation or parole violation. As a percent of
all jail inmates, the percent convicted
has dropped from 44.0% at midyear
2000 to 39.7% at midyear 2004.
At midyear 2004, 94% of jail
capacity occupied
In the 12 months ending June 30,
2004, fewer beds than inmates were
added to the Nation’s jails. At midyear
2004 the rated capacity of local jails
was estimated at 755,603 beds, an
increase of 19,132 in 12 months (table
11). In the same 12 month period, an
additional 22,689 inmates were added
to the local jail population.
Rated capacity is the maximum
number of beds or inmates allocated
by State or local rating officials to each
jail facility. The growth in jail capacity
during the 12-month period ending on
June 30, 2004, (22,572) was less than
the average growth of 25,128 beds
every 12 months since midyear 1995,
but was more than the growth in the
number of beds during 2001 (21,522)
and 2002 (14,590).
As of June 30, 2004, 94% of the local
jail capacity was occupied.* As a ratio
of all inmates housed in jail facilities to
total capacity, the percentage occupied
decreased by 10 percentage points
from 1990 to 2004. At midyear 1990
local jails operated at 4% above their
rated capacity.
*On December 31, 2003, State prisons were
estimated to be at capacity to 16% above
capacity, while Federal prisons were operating
at 39% above capacity. See Prisoners in 2003,
November 2004, NCJ 205335.

Jail jurisdictions with an average daily
population greater than 250 reported
the highest occupancy rates (97%). At
the same time, jail jurisdictions with an
average daily population of fewer than
50 inmates were operating at 64% of
rated capacity, compared to 66% in at
midyear 2003.
Size of
jurisdiction*
Total

Percent of
capacity occupied
2004
2000
94%
92%

Fewer than 50 inmates
50-99
100-249
250-499
500-999
1,000 or more

64
87
95
97
97
97

66
80
94
96
94
94

*Based on the average daily population
in the year ending June 30.

Table 11. Rated capacity of local
jails and percent of capacity
occupied, 1990 and 1995-2004

Year
2004

Amount Percent of
Rated
of capac- capacity
capacitya ity addedb occupiedc
755,603 19,132
94%

2003
2002
2001
2000
1999
1998
1997
1996
1995

736,471
713,899
699,309
677,787
652,321
612,780
586,564
562,971
545,763

1990

389,171

Average annual
increase,
1995-2004
3.8%

22,572
14,590
21,522
25,466
39,541
26,216
23,593
17,208
41,439

94
93
90
92
93
97
97
92
93
104

25,128

Note: Capacity data for 1990, 1995-98, and
2000-04 are survey estimates subject to
sampling error.
a
Rated capacity is the number of beds or
inmates assigned by a rating official to
facilities within each jurisdiction.
b
The number of beds added during the
12 months ending June 30 of each year.
c
The number of inmates divided by the rated
capacity times 100.

The 50 largest jail jurisdictions
housed about a third of jail inmates
On June 30, 2004, the Nation’s 50
largest jail jurisdictions held 30.9%
(220,556) of all jail inmates (table 12).
Twenty States had at least one jurisdiction which ranked in the top 50 for
average daily population. States with
more than one jurisdiction among the
50 largest jail jurisdictions are California (10), Florida (8), Texas (7), Georgia
(4), Ohio (2), Pennsylvania (2), and
Tennessee (2).
The 2 jurisdictions with the most
inmates, Los Angeles County and New
York City, together held approximately
32,400 inmates, or nearly 5% of the
national total.
Seventeen jurisdictions among the 50
largest experienced a decrease
in the number of inmates held between
July 1, 2003, and June 30, 2004.
Jurisdictions with double-digit
decreases were De Kalb, Georgia
(down 16.8%), Essex County, New
Jersey (down 12.6%), and Orange
County, Florida (down 10.2%).
Excluding the District of Columbia (see
footnote in table 12), 8 jail jurisdictions
among the 50 largest experienced
double-digit growth. The jurisdiction
with the largest increase in jail population was Clark County, Nevada (up
20.5%). Other jail jurisdictions with
substantial population increases were
Fulton County, Georgia (up 20.2%),
Orange County, California (up 20.1%),
Milwaukee County, Wisconsin (up
16.5%), and Baltimore City, Maryland
(up 15.4%).
Twenty of the 50 largest jail jurisdictions operated over their rated capacities. On June 30, 2004, Maricopa
County, Arizona, operated at 176% of
their capacity; Polk County, Florida,
operated at 138%; and Fulton County,
Georgia, operated at 131% of capacity.

Prison and Jail Inmates at Midyear 2004

9

Table 12. The 50 largest local jail jurisdictions: Number of inmates held,
average daily population, and rated capacity, midyear 2002-04
Jurisdiction
Total
Los Angeles County, CA
New York City, NY
Cook County, IL
Maricopa County, AZ
Harris County, TX

Number of inmates helda
2002
2003
2004
208,936 216,138 220,556

Average daily populationb
2002
2003
2004
206,916 214,445 219,657

Rated capacityc
2002
2003
2004
228,916 233,104 234,657

Percent of capacity
occupied at midyeard
2002 2003
2004
91% 93%
94%

19,867
14,201
10,990
7,919
7,153

19,572
14,115
10,674
8,209
7,240

18,600
13,818
10,155
9,148
7,902

19,258
13,952
10,888
8,008
6,641

21,184
14,533
10,864
8,044
7,300

18,512
13,751
10,535
8,657
8,200

24,440
20,793
9,798
5,201
8,721

24,440
20,793
9,798
5,201
9,409

21,667
20,793
10,252
5,201
9,409

81
68
112
152
82

80
68
109
158
77

86
66
99
176
84

Philadelphia City, PA
Dallas County, TX
Dade County, FL
Orleans Parish, LA
Orange County, CA

7,383
6,805
6,746
6,482
5,086

7,189
6,686
6,847
6,282
5,095

7,404
7,090
6,581
5,778
6,117

7,221
6,567
6,680
5,875
4,561

6,540
6,814
6,856
6,062
5,096

7,376
7,090
6,619
5,923
5,569

5,600
8,187
8,179
7,477
5,410

5,600
7,284
6,005
7,673
4,517

7,118
7,284
8,052
7,673
4,517

132
83
82
87
94

128
92
114
82
113

104
97
82
75
135

San Bernardino County, CA
Broward County, FL
San Diego County, CA
Shelby County, TN
Baltimore City , MD

5,049
5,053
4,656
4,627
3,721

5,476
5,023
5,209
4,770
3,847

5,494
5,264
5,243
4,939
4,440

4,977
5,116
4,872
4,835
3,637

5,337
4,981
4,933
4,682
3,811

5,299
5,203
5,163
4,854
4,305

4,957
5,198
4,634
6,216
3,861

4,874
5,198
4,666
6,216
4,204

4,874
5,656
4,768
6,216
3,783

102
97
100
74
96

112
97
112
77
92

113
93
110
79
117

Hillsborough County, FL
Santa Clara County, CA
Alameda County, CA
Sacramento County, CA
Bexar County, TX

3,406
3,884
3,719
3,295
3,742

4,057
4,047
3,857
3,650
3,720

4,464
4,054
4,116
3,958
3,856

3,501
3,915
3,886
3,293
3,638

3,800
3,867
3,840
3,634
3,597

4,269
4,187
4,056
4,004
3,776

3,373
3,629
3,811
3,885
4,294

3,710
3,629
3,601
4,318
4,294

4,190
3,849
4,634
4,751
4,131

101
107
98
85
87

109
112
107
85
87

107
105
89
83
93

District of Columbiae
Orange County, FL
Tarrant County, TX
Jacksonville City, FL
Milwaukee County, WI

1,989
3,759
3,043
2,895
2,973

3,135
3,930
3,482
3,084
2,589

3,555
3,529
3,147
3,375
3,015

1,749
3,792
3,119
2,965
3,105

3,172
3,896
3,414
3,052
3,226

3,521
3,456
3,437
3,428
3,383

2,050
3,426
4,739
3,137
3,790

3,319
4,352
4,739
3,137
3,790

3,825
4,352
4,040
3,137
3,000

97
110
64
92
78

94
90
73
98
68

93
81
78
108
100

Riverside County, CA
Davidson County, TN
Fulton County, GA
Pinellas County, FL
Fresno County, CA

3,282
2,988
2,389
3,058
2,194

3,220
3,088
2,931
2,907
3,140

3,250
3,097
3,524
2,922
3,124

3,283
2,853
2,746
2,884
2,273

3,204
2,939
2,597
2,938
2,655

3,222
3,220
3,152
3,087
2,980

3,005
2,654
2,698
3,303
2,482

3,007
2,654
2,698
3,119
3,778

2,884
2,654
2,698
3,119
3,542

109
113
89
93
88

107
116
109
93
83

113
117
131
94
88

Clark County, NVf
Palm Beach County, FL
Allegheny County, PA
Franklin County, OH
Oklahoma County, OK

2,475
2,418
2,646
2,626
2,208

2,537
2,600
2,698
2,751
2,337

3,056
2,848
2,802
2,681
2,582

2,749
2,585
2,474
2,514
2,245

2,561
2,471
2,616
2,674
2,538

2,906
2,753
2,733
2,659
2,640

1,488
3,231
2,971
2,659
2,975

2,441
3,365
3,271
2,659
2,975

2,855
3,365
3,271
2,659
2,975

166
75
89
99
74

104
77
82
103
79

107
85
86
101
87

Polk County, FL
De Kalb County, GA
Suffolk County, MA
Wayne County, MI
Marion County, IN

1,824
2,745
2,492
2,649
2,468

2,432
3,154
2,504
2,500
2,720

2,491
2,623
2,479
2,497
2,593

1,864
2,651
2,444
2,700
2,467

2,112
2,766
2,427
2,606
2,775

2,637
2,600
2,539
2,483
2,470

1,808
3,636
2,299
2,685
2,405

1,808
3,636
2,291
2,721
2,465

1,808
3,636
2,932
2,721
2,510

101
75
108
99
103

135
87
109
92
110

138
72
85
92
103

Gwinnett County, GA
King County, WA
Travis County, TX
El Paso County, TX
Cobb County, GA

1,962
2,660
2,564
2,275
2,156

2,015
2,440
2,166
2,421
2,467

2,187
2,407
2,341
2,539
2,405

1,860
2,714
2,544
2,398
2,200

1,777
2,400
2,459
2,384
2,201

2,454
2,423
2,407
2,400
2,339

1,729
3,641
2,275
2,464
2,581

1,964
2,388
2,847
2,448
2,581

1,964
2,527
2,847
2,448
2,634

113
73
113
92
84

103
102
76
99
96

111
95
82
104
91

Essex County, NJ
Hamilton County, OH
Kern County, CA
Reeves County, TX
Bernalillo County, NM

2,532
2,059
2,384
2,045
1,394

2,612
2,309
2,264
2,167
1,973

2,284
2,335
2,099
2,212
2,136

2,450
1,999
2,560
1,998
1,410

2,700
2,124
2,221
2,085
1,680

2,300
2,242
2,189
2,153
2,096

2,410
2,470
2,698
2,185
1,358

3,410
2,470
2,324
2,969
2,048

2,410
2,470
2,324
2,184
2,048

105
83
88
94
103

77
93
97
73
96

95
95
90
101
104

Note: Jurisdictions are ordered by their average daily population in 2004.
a
Number of inmates held in jail facilities.
b
Based on the average daily population for the year ending June 30. The average daily population is the sum
of the number of inmates in jail each day for a year, divided by the number of days in the year.
c
Rated capacity is the number of beds or inmates assigned by a rating official to facilities within each jurisdiction.
d
The number of inmates divided by the rated capacity multiplied by 100.
e
Data for 2002 are not comparable to prior years due to changes in reporting methods. Figures in 2003-04 include the D.C. Detention Facility,
community corrections center, and contract housing under the Department of Corrections.
f
The confined population total for Clark County, NV, excludes those held in contract facilities.

10 Prison and Jail Inmates at Midyear 2004

An estimated 13% of black males
in their late twenties in prison or jail
in 2004
When total incarceration rates are
estimated separately by age group,
black males in their twenties and
thirties are found to have high rates
relative to other groups. Among the
more than 2.1 million offenders
incarcerated on June 30, 2004, an
estimated 576,600 were black males
between ages 20 and 39 (table 13).
Among males age 25 to 29, 12.6%
of blacks were in prison or jail,
compared to 3.6% of Hispanics and
about 1.7% of whites (table 14).
Although incarceration rates drop with
age, the percentage of black males
age 45 to 54 in prison or jail in 2004
was an estimated 4.5% C more than
twice the highest rate (1.7%) among
white males (age 30 to 34).
Female incarceration rates, though
significantly lower than male rates at
every age, reveal similar racial and
ethnic differences. Black females (with
a prison and jail rate of 359 per
100,000) were 2½ times more likely
than Hispanic females (143 per
100,000) and nearly 4½ times more
likely than white females (81 per
100,000) to be incarcerated in 2004.
These differences among white, black,
and Hispanic females were consistent
across all age groups.

Table 13. Number of inmates in State or Federal prisons and local jails,
by gender, race, Hispanic origin, and age, June 30, 2004
Number of inmates in State or Federal prisons or local jails
Male
Female
Blackb Hispanic
Age
Totala
Whiteb
Blackb Hispanic
Totala
Whiteb
Total
1,947,800 695,800 842,500 366,800 183,400
81,700 67,700 28,600
18-19
73,200
24,300 33,000
13,600
4,500
1,800
1,500
1,000
20-24
352,000 107,300 161,900
74,500
26,900
12,000
9,100
5,200
25-29
339,600
97,700 155,600
78,700
27,100
11,700
9,900
4,700
30-34
316,400 106,900 134,500
68,600
33,500
14,800 12,300
5,400
35-39
291,600 110,700 124,600
49,900
36,300
16,300 13,800
5,100
40-44
250,200 104,500 104,500
36,100
28,600
12,900 11,300
3,800
45-54
237,800 100,500 99,000
33,500
21,500
9,700
8,300
2,700
55 or older
71,900
39,900 21,400
9,300
4,000
2,300
1,000
600
Note: Based on custody counts from National Prisonto the nearest 100.
a
ers Statistics (NPS-1A), 2004 and Annual Survey of
Includes American Indians, Alaska
Jails, 2004. Estimates by age were obtained from
Natives, Asians, Native Hawaiians, and
Survey of Inmates in Local Jails, 2002, National
other Pacific Islanders. The total also
Corrections Reporting Program, 2002, and Federal
includes ages not shown.
b
Excludes Hispanics.
Justice Statistics Program (FJSP) for inmates
on September 30, 2002. Estimates were rounded

Table 14. Number of inmates in State or Federal prisons and local jails
per 100,000 residents, by gender, race, Hispanic origin, and age, June 30, 2004
Number of inmates per 100,000 residents of each group
Male
Female
Blackb
Hispanic
Age
Totala Whiteb Blackb Hispanic
Totala
Whiteb
Total
1,348
717
4,919
1,717
123
81
359
143
18-19
1,727
911
5,473
1,957
112
71
262
162
20-24
3,255 1,641
11,054
3,577
264
191
625
304
25-29
3,390 1,666
12,603
3,606
283
203
746
268
30-34
3,060 1,691
10,979
3,438
330
237
905
313
35-39
2,755 1,607
10,036
2,866
346
238
993
331
40-44
2,187 1,314
7,993
2,403
247
162
764
271
45-54
1,162
664
4,546
1,652
101
63
327
136
55 or older
247
170
898
473
11
8
29
25
a
Note: Based on the U.S. resident population for
Includes American Indians, Alaska
July 1, 2004, by gender, race and Hispanic origin.
Natives, Asians, Native Hawaiians, and
Detailed categories exclude persons identifying
other Pacific Islanders. The total also
with two or more races.
includes ages not shown.
b
Excludes Hispanics.

the 50 States and the Federal Bureau
of Prisons.

NPS distinguishes between prisoners
in custody from those under jurisdicAmong black females, the rate was
tion.
To have custody of a prisoner, a
highest (993 per 100,000) among
State
must hold that person in one of
those age 35 to 39. This rate was more
its
facilities.
To have jurisdiction, a
than 4 times higher than the rate
State
has
legal
authority over the
among white females in this age group
prisoner.
Prisoners
under a State’s
(238 per 100,000).
jurisdiction may be in the custody of a
local jail, another State’s prison, or
Methodology
other correctional facility such as a
privately operated institution. Some
National Prisoner Statistics (NPS)
States are unable to provide both
custody and jurisdiction counts.
The Bureau of Justice Statistics, with
the U.S. Census Bureau as its collecExcluded from NPS counts are
tion agent, obtains yearend and
persons confined in locally adminismidyear counts of prisoners from
tered confinement facilities who are
departments of correction in each of
under the jurisdiction of local authorities. NPS counts include all inmates

in State-operated facilities in Alaska,
Connecticut, Delaware, Hawaii, Rhode
Island, and Vermont, which have
combined jail-prison systems. (See
National Prisoner Statistics jurisdiction
notes, on the BJS Web site.)
Annual Survey of Jails, 2004
In each of the years between the full
censuses, a sample survey of jails is
conducted to estimate baseline characteristics of the Nation’s jails and the
inmates housed in these jails. Based
on information from the 1999 Census
of Jails, a sample of jail jurisdictions
was selected for the 2004 survey. A
jurisdiction is a county (parish in Louisiana) or municipal government that
administers one or more local jails.
The sample included all jail facilities
(940) in 878 jurisdictions.

Prison and Jail Inmates at Midyear 2004

11

In drawing the sample, all multijurisdictional (55) jails were included in
the sample with certainty. These jails
are operated jointly by two or more
jurisdictions. Other jurisdictions (356)
were included automatically in the
sample if their jails held juvenile
inmates on census day and had an
average daily population of 250 or
more inmates, or if their jails held only
adults and had an average daily
population of 500 or more.
The remaining jurisdictions were stratified into two groups: jurisdictions with
jails holding at least one juvenile on
June 30, 1999, and jurisdictions with
jails holding adults only. Using stratified
probability sampling, 467 jurisdictions
were then selected from 10 strata
based on the average daily population
in the 1999 census.
Data were obtained by mailed and
web-based survey questionnaires.

After follow-up phone calls to respondents, the response rate for the survey
was 100% for critical items such as
rated capacity, average daily population, and number of inmates confined.
(For standard errors, see Appendix
tables, Annual Survey of Jails 2004,
on the BJS Web site.)

This report in portable document
format and in ASCII, its tables, and
related statistical data are available
at the BJS World Wide Web Internet
site:
http://www.ojp.usdoj.gov/bjs/

Data collection and processing were
carried out by Pamela Butler (National
Prisoner Statistics) and Lisa McNelis
(Annual Survey of Jails), under the
supervision of Charlene Sebold,
BJS Bulletins present the first release
Governments Division, Census
of findings from permanent data
Bureau, U.S. Department of
collection programs such as the
Commerce.
National Prisoner Statistics program
and the Annual Survey of Jails.
April 2005, NCJ 208801
Paige M. Harrison and Allen J. Beck
wrote this report. Jennifer C. Karberg
verified the report and provided statis- Office of Justice Programs
tical assistance. Tom Hester edited
Partnerships for Safer Communities
the report.
http://www.ojp.usdoj.gov
The Bureau of Justice Statistics
is the statistical agency of the
U.S. Department of Justice.
Lawrence A. Greenfeld is director.

U.S. Department of Justice
Office of Justice Programs
Bureau of Justice Statistics
Washington, DC 20531
Official Business
Penalty for Private Use $300

12 Prison and Jail Inmates at Midyear 2004

PRESORTED STANDARD
POSTAGE & FEES PAID
DOJ/BJS
Permit No. G-91

National Prisoner Statistics
jurisdiction notes
Alaska C Prisons and jails form one
integrated system. All NPS data
include jail and prison populations.
Jurisdiction counts exclude inmates
held in local jails that are operated by
communities.
Arizona C Counts are based on
custody data.
California C Jurisdiction counts
include unsentenced inmates temporarily housed in local jails or in
hospitals.
Colorado C Counts include 71
inmates housed in local jails, 3,074
inmates in Colorado contract, and 235
inmates in the Youthful Offender
System, which was established primarily for violent juvenile offenders.
Counts of inmates with sentences of
more than 1 year include an undetermined number with a sentence of 1
year or less. Reports foreign-born
inmates rather than noncitizens.
Connecticut C Prisons and jails form
one integrated system. All NPS data
include jail and prison populations.
Delaware C Prisons and jails form one
integrated system. All NPS data
include jail and prison populations.
Federal C Custody counts include
inmates housed in privately operated
secure facilities under contract with
BOP or with a State or local government that has an intergovernmental
agreement. Also includes inmates held
in privately operated community
correctional centers. Racial categories
include 42,028 inmates of Hispanic
origin.

Illinois C Counts of inmates with
sentences of more than 1 year include
an undetermined number with a
sentence of 1 year.
Kansas C Counts of inmates with
sentences of more than 1 year include
an undetermined number with a
sentence of 1 year or less. Racial
categories include 722 inmates of
Hispanic origin.
Louisiana C Data system does not
include Hispanic origin.
Maryland C Counts by sentence
length are estimates extracted from
actual sentence length breakdowns
from automated data and applied to
totals based on manual data. Data
system does not include Hispanic
origin. Reports foreign-born inmates
rather than noncitizens.
Massachusetts C Jurisdiction counts
exclude approximately 6,200 male
inmates in the county system (local
jails and houses of correction) serving
a sentence of over 1 year. These male
inmates are included in Massachusetts' incarceration rate. By law offenders may be sentenced to terms up to
2½ years in locally operated jails and
correctional institutions.
Michigan C Jurisdictions counts
exclude inmates who are out to court
and inmates housed in local jails awaiting return to prison.

Oklahoma C Counts of inmates with
sentences of more than 1 year include
an undetermined number with a
sentence of 1 year or less.
Oregon C Counts of inmates with
sentences of more than 1 year include
an undetermined number with a
sentence of 1 year or less.
Rhode Island C Prisons and jails
form one integrated system. All NPS
data include jail and prison
populations.
Tennessee C Reports foreign-born
inmates rather than noncitizens.
Texas C Reports the use of intermediate sanctions in lieu of parole violation
for 11,048 inmates. The intermediate
sanction includes incarceration for a
period of 1 to 3 months; thus, these
inmates were included in the national
total for parole violators.
Vermont C Prisons and jails form an
integrated system. All NPS data
include jail and prison populations.
Inmates of Hispanic origin were
reported in racial categories only.
Wisconsin C Custody counts exclude
inmates held in non-Wisconsin DOC
facilities under contract. Racial categories include 1,630 inmates of Hispanic
origin.

Minnesota C Racial categories include
585 inmates of Hispanic origin.
New Hampshire C Racial categories
include 117 inmates of Hispanic origin.
New Jersey C Counts of inmates with
sentences of more than 1 year include
an undetermined number with a
sentence of 1 year.

Georgia C Counts are based on
custody data.

New York C Reports foreign-born
inmates rather than noncitizens.

Hawaii C Prisons and jails form one
integrated system. All NPS data
include jail and prison populations.

North Carolina C Data system does
not include Hispanic origin.
Ohio C Counts of inmates with
sentences of more than 1 year include
an undetermined number with a
sentence of 1 year or less.

Prison and Jail Inmates at Midyear 2004

13

Appendix table 1. Standard error estimates for the
Annual Survey of Jails, 2004

Characteristic
Total
Held in jail
Supervised outside a jail
facility
Excluding weekenders
Weekenders

Relative
Survey
Standard standard error
(percent)
estimates error
784,538
4,198
0.54%
713,990
3,919
0.55
70,548
1,186
1.68

Appendix table 2. Standard error estimates by selected
characteristic, Annual Survey of Jails, 2004

Characteristic
Gender
Male
Female

58,959
11,589

1,093
444

1.85
3.82

Adults

Average daily population

706,242

3,748

0.53

Rated capacity

755,603

4,800

0.64

Juveniles
Held as adults
Held as juveniles

*Detail may not sum to total due to rounding.

Race/Hispanic origina
White
Black
Hispanic
Otherb
Conviction status (adults)
Awaiting trial or in other
unconvicted category
Convicted

Total*

Relative
Survey
Standard standard error
estimates error
(percent)

626,407
87,583

626,407
87,583

3,471
665

0.55%
0.76

706,907

706,907

3,924

0.56%

7,083
6,159
924

7,083
6,159
924

188
162
95

2.65%
2.63
10.28

317,400
275,400
108,300
12,900

306,093
265,609
104,442
12,456

3,255
2,335
1,679
691

1.08%
0.88
1.61
5.55

424,200

413,985

3,171

0.77%

279,800

273,102

2,638

0.97

*Total estimates were based on reported data adjusted for non-response.
Detail may not sum to total due to rounding.
a
Excludes persons of unknown race or Hispanic origin.
b
Includes American Indians, Alaska Natives, Asians, and Pacific Islanders.

14 Prison and Jail Inmates at Midyear 2004