
State Indigent Defense Expenditures 2008-2012 BJS 2014
Download original document:
Document text
Document text
This text is machine-read, and may contain errors. Check the original document to verify accuracy.
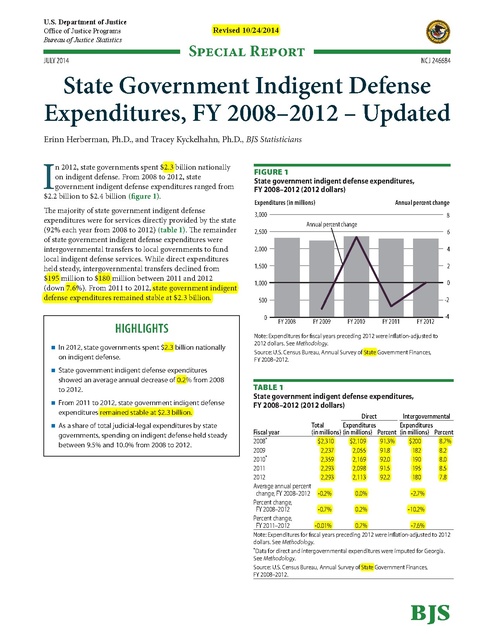
U.S. Department of Justice Office of Justice Programs Bureau of Justice Statistics JULY 2014 Revised 10/24/2014 Special Report NCJ 246684 State Government Indigent Defense Expenditures, FY 2008–2012 – Updated Erinn Herberman, Ph.D., and Tracey Kyckelhahn, Ph.D., BJS Statisticians I n 2012, state governments spent $2.3 billion nationally on indigent defense. From 2008 to 2012, state government indigent defense expenditures ranged from $2.2 billion to $2.4 billion (figure 1). The majority of state government indigent defense expenditures were for services directly provided by the state (92% each year from 2008 to 2012) (table 1). The remainder of state government indigent defense expenditures were intergovernmental transfers to local governments to fund local indigent defense services. While direct expenditures held steady, intergovernmental transfers declined from $195 million to $180 million between 2011 and 2012 (down 7.6%). From 2011 to 2012, state government indigent defense expenditures remained stable at $2.3 billion. HIGHLIGHTS In 2012, state governments spent $2.3 billion nationally on indigent defense. State government indigent defense expenditures showed an average annual decrease of 0.2% from 2008 to 2012. From 2011 to 2012, state government indigent defense expenditures remained stable at $2.3 billion. As a share of total judicial-legal expenditures by state governments, spending on indigent defense held steady between 9.5% and 10.0% from 2008 to 2012. Figure 1 State government indigent defense expenditures, FY 2008–2012 (2012 dollars) Expenditures (in millions) Annual percent change 3,000 8 Annual percent change 2,500 6 2,000 4 1,500 2 1,000 0 500 -2 0 FY 2008 FY 2009 FY 2010 FY 2011 FY 2012 -4 Note: Expenditures for fiscal years preceding 2012 were inflation-adjusted to 2012 dollars. See Methodology. Source: U.S. Census Bureau, Annual Survey of State Government Finances, FY 2008–2012. Table 1 State government indigent defense expenditures, FY 2008–2012 (2012 dollars) Direct Intergovernmental Total Expenditures Expenditures (in millions) (in millions) Percent (in millions) Percent $2,310 $2,109 91.3% $200 8.7% 2,237 2,055 91.8 182 8.2 2,359 2,169 92.0 190 8.0 2,293 2,098 91.5 195 8.5 2,293 2,113 92.2 180 7.8 Fiscal year 2008* 2009 2010* 2011 2012 Average annual percent change, FY 2008–2012 -0.2% Percent change, FY 2008–2012 -0.7% Percent change, FY 2011–2012 -0.01% 0.0% -2.7% 0.2% -10.2% 0.7% -7.6% Note: Expenditures for fiscal years preceding 2012 were inflation-adjusted to 2012 dollars. See Methodology. *Data for direct and intergovernmental expenditures were imputed for Georgia. See Methodology. Source: U.S. Census Bureau, Annual Survey of State Government Finances, FY 2008–2012. BJS From 2008 to 2012, state government spending on all judicial-legal services ranged from $22.8 to $23.6 billion (table 2). As a share of total judicial-legal expenditures by state governments, spending on indigent defense held steady between 9.5% and 10.0% during this period. The data used in this report are from a larger study funded by the Bureau of Justice Statistics (BJS) and produced by the Census Bureau. The study, Indigent Defense Services in the United States, FY 2008–2012 (NCJ 246683, BJS web, July 2014), contains information on— state legislation related to the provision of indigent defense the availability, quality, and sources of data for state government indigent defense expenditures for each state and the District of Columbia total, direct, and intergovernmental indigent defense expenditures by state limited information on indigent defense expenditures by some local governments. For this report, financial data for fiscal years 2008 to 2012 were inflation-adjusted to 2012 constant dollars (see Methodology). For the Census Bureau’s Indigent Defense Services (IDS) study, expenditure data are in nominal dollars. The Sixth and Fourteenth Amendments to the U.S. Constitution guarantee that people accused of crimes who cannot afford an attorney have the right to appointed counsel. In response to the U.S. Supreme Court mandate for appointed counsel, states enacted various methods to provide indigent defense services. Indigent defense funding, service delivery, and administration differ by state. Depending on the state, indigent defense expenditures are funded by the state or local governments, or a combination of both. Pennsylvania is the only state that does not provide any state-based funding for indigent defense, leaving all financial responsibility to the counties. States also have varying methods of service delivery for indigent defense, using different combinations of public defender offices, assigned counsel systems, or contract systems with private attorneys. In addition, the source of administration at the state or local levels for indigent defense services varies across states, including sources of governance, policy determinations, and operations. Some state-administered systems are not funded completely by the state. Some county-administered systems are funded entirely by the state government. Caution must be taken when comparing states on the total state government indigent defense expenditures presented in the Census Bureau’s IDS study, as the information may not encompass all resources spent on indigent defense. In addition, as this report focuses only on state government indigent defense expenditures, these data cannot be used to compare spending on indigent defense and prosecution. Table 2 State government judicial-legal expenditures, FY 2008–2012 (2012 dollars) Fiscal year 2008 2009 2010 2011 2012 Average annual percent change, FY 2008–2012 Percent change, FY 2008–2012 Percent change, FY 2011–2012 Total (in millions) $22,963 23,599 23,514 22,957 22,842 Direct Expenditures (in millions) $21,888 22,427 21,946 21,376 21,328 -0.1% -0.5% -0.5% -0.6% -2.6% -0.2% Percent 95.3% 95.0 93.3 93.1 93.4 Intergovernmental Expenditures (in millions) Percent $1,076 4.7% 1,172 5.0 1,568 6.7 1,581 6.9 1,514 6.6 8.5% 40.8% -4.3% Note: Expenditures for fiscal years preceding 2012 were inflation-adjusted to 2012 dollars. See Methodology. Source: U.S. Census Bureau, Annual Survey of State Government Finances, FY 2008–2012. State Government Indigent Defense Expenditures, FY 2008–2012 | july 2014 2 Comparing total indigent defense expenditures and spending by public defender offices Fiscal year 2008 data from the Census Bureau’s Indigent Defense Services (IDS) study were compared to calendar year 2007 data from the Bureau of Justice Statistics’ (BJS) Census of Public Defender Offices (CPDO), which collected office-level data from approximately 950 publicly funded public defender offices located in 49 states and the District of Columbia.1 The universe included all public defender offices principally funded by state or local governments that provided general criminal defense services, conflict services, or capital case representation. The CPDO collected operational expenditure data for the government-funded public defender offices, which represented one component of total indigent defense system. In comparison, the IDS study by the Census Bureau consisted of all spending on indigent defense, including contract attorneys, assigned counsel, and public defender office expenditures. 1In 2007, Maine did not have a publicly funded public defender office. The CPDO and IDS studies differed in other ways. The CPDO only contained operational expenditures, while the IDS study also included capital outlay, generally a small percentage of spending on indigent defense. The CPDO reported on calendar year 2007, while the Census Bureau’s IDS study collected data for fiscal year 2008, which included some of calendar year 2007.2 Among the 22 states classified as state-administered in the CPDO, state government expenditures for calendar year 2007 for (14) states were within 10% of expenditures from the Census FY 2008 data.3 Of the remaining seven states, four states contained 17% to 50% more expenditures than in the Census Bureau’s IDS study, and three states had 50% more expenditures in the IDS study than the CPDO (table 3). 2The degree to which CY 2007 expenditures was included in a state’s FY 2008 expenditures depended on the start of a state’s fiscal year, which varies by state. 3In the upcoming BJS 2013 National Survey of Indigent Defense, 29 states are classified as state-administered. Table 3 Comparison of Indigent Defense Expenditures in BJS’s Census of Public Defender Offices, CY 2007, and Census Bureau’s Indigent Defense Services Study, FY 2008 (2012 dollars) State Alaska Arkansas Colorado Connecticut Delaware Hawaii Iowa Kentucky Maryland Massachusetts Minnesota Missouri Montana New Hampshire New Jersey New Mexico North Dakota Rhode Island Vermont Virginia Wisconsin Wyoming BJS’s Census of Public Defender Offices, CY 2007 Expenditures (in thousands) $19,388 22,556 42,626 53,558 15,430 9,564 54,608 36,583 87,222 138,847 69,536 38,411 20,995 14,254 111,392 41,725 1,913 9,881 7,695 42,047 90,876 8,568 Census Bureau’s Indigent Defense Services Study, FY 2008 Expenditures (in thousands) $33,750 30,777 86,628 51,461 16,001 10,420 56,132 42,922 95,445 218,775 72,135 36,941 21,105 17,754 118,465 44,213 4,988 13,569 11,217 43,884 89,783 8,026 Expenditure difference (in thousands) $14,362 8,220 44,002 -2,097 571 856 1,523 6,339 8,223 79,929 2,599 -1,470 110 3,500 7,072 2,488 3,076 3,688 3,522 1,837 -1,093 -542 Percent difference 74.1% 36.4 103.2 -3.9 3.7 9.0 2.8 17.3 9.4 57.6 3.7 -3.8 0.5 24.6 6.3 6.0 160.8 37.3 45.8 4.4 -1.2 -6.3 Note: Expenditures for fiscal years preceding 2012 were inflation-adjusted to 2012 dollars. See Methodology. Sources: Bureau of Justice Statistics, Census of Public Defender Offices, CY 2007; and U.S. Census Bureau, Annual Survey of State Government Finances, FY 2008. State Government Indigent Defense Expenditures, FY 2008–2012 | july 2014 3 Methodology Imputation The data used for this report and in the Census Bureau study were extracted from the U.S. Census Bureau’s Annual Survey of State Government Finances for fiscal years 2008 through 2012. This report includes state government indigent defense expenditures and total judicial-legal expenditures compiled by U.S. Census Bureau representatives. Data were collected from government audits, budgets, and other financial reports. Differences in functional responsibilities from state to state may prohibit the comparability of expenditure data across all jurisdictions, and caution should be exercised when comparing government expenditures. For more detailed information on the functional responsibilities by state, see the previously referenced Census Bureau study, Indigent Defense Services in the United States, FY 2008–2012, (NCJ 246683, BJS web, July 2014). For 2008 and 2010, expenditure data for Georgia were only available for total indigent defense expenditures. Totals for direct and intergovernmental expenditures for Georgia for those 2 years were imputed by taking the average share for each category for 2009, 2011, and 2012, and applying it to 2008 and 2010. Adjusting for Inflation Terms and definitions Government expenditures for fiscal years preceding 2012 were inflation adjusted to 2012 dollars, as is standard for state government spending. Annual chain-type price indices for gross domestic product were employed as divisors, and unadjusted expenditures were employed as dividends to produce inflation adjusted expenditures in 2012 dollars. Expenditures—external cash payments made from any source of funds, including any payments financed from borrowing, fund balances, intergovernmental revenue, and other current revenue. The U.S. Department of Commerce, Bureau of Economic Analysis, developed the price indices used in all inflation adjustments, as published through their interactive data tool (http://www.bea.gov/iTable/index_nipa.cfm). (See Table 1.1.4, Price Indexes for Gross Domestic Product, March 27, 2014.) Expenditures for California were compiled using the State of California Governor’s Budget. However, only partial indigent defense expenditure information was available; therefore, California’s expenditures are likely an underestimate. Census Bureau data from Florida could not be fully validated. These states’ data were used to impute national totals. For FY 2009, Tennessee State Budget Publications were used to provide data for imputation to national totals. Intergovernmental transfers—the sum of payments made from one government entity to another, including grants-in-aid, shared revenues, payments in lieu of taxes, and amounts for services performed by one government for another on a reimbursable or cost-sharing basis (e.g., payments by one government to another for boarding prisoners). Excludes amounts paid to other governments for purchase of commodities, property, or utility services. Direct expenditures—all expenditures except those classified as intergovernmental. Includes direct current expenditures (e.g., salaries, wages, fees, and commissions and purchases of supplies, materials, and contractual services) and capital outlays (e.g., construction and purchase of equipment, land, and existing structures). Note that capital outlays are included for the year in which the direct expenditure was made, regardless of how the funds were raised (e.g., bond issue) or when they were paid back. Indigent defense services—the provision of legal services to individuals accused of crimes who cannot afford an attorney. State Government Indigent Defense Expenditures, FY 2008–2012 | july 2014 4 Appendix table 1 State government indigent defense expenditures, by state, FY 2008–2012 (2012 dollars) Alabama Alaska Arizona Arkansas California Colorado Connecticut Delaware Florida Georgiaa Hawaiib Idaho Illinois Indianab Iowa Kansas Kentucky Louisianac Maineb Maryland Massachusettsb Michigan Minnesotab Mississippi Missourib Montana Nebraska Nevada New Hampshired New Jerseyb New Mexico New Yorkb,e North Carolina North Dakota Ohio Oklahoma Oregon Pennsylvania Rhode Island South Carolina South Dakotaf Tennessee Texas Utahg Vermont Virginia Washington West Virginia Wisconsin Wyoming Total state government indigent defense expenditures (in thousands) FY 2008 FY 2009 FY 2010 FY 2011 FY 2012 72,540 73,973 66,590 66,221 59,707 33,750 35,682 36,794 37,957 40,036 2,796 2,627 2,287 2,189 1,378 30,777 24,046 31,146 34,816 37,600 -----86,628 99,127 98,036 92,324 100,714 51,461 52,087 50,453 51,269 64,002 16,001 15,622 14,804 15,251 18,792 -----76,075 66,457 69,524 68,706 69,539 10,420 10,708 9,491 8,869 9,275 2,197 2,238 2,018 2,018 1,990 26,151 26,984 24,527 23,313 20,266 23,318 24,504 24,920 24,352 24,906 56,132 59,397 58,436 55,492 55,726 25,084 25,252 24,845 23,117 22,714 42,922 41,466 46,061 44,995 43,586 30,360 29,923 71,479 71,349 67,964 14,946 14,104 13,141 13,483 14,448 95,445 97,423 89,869 87,268 87,952 218,775 206,999 208,858 200,136 191,228 14,585 14,549 13,415 12,950 12,866 72,135 72,771 69,241 68,218 64,509 3,009 3,329 3,416 3,638 4,307 36,941 38,239 37,541 36,713 35,739 21,105 21,982 21,259 21,742 23,335 3,573 3,727 3,902 3,662 3,533 2,063 2,314 2,376 2,686 3,234 17,754 19,252 19,316 19,255 18,038 118,465 124,142 118,796 117,501 117,628 44,213 45,882 42,889 41,160 38,519 93,851 85,827 93,075 96,888 109,256 124,308 136,244 137,343 138,097 125,603 4,988 5,523 5,711 5,919 6,140 92,164 69,831 71,128 75,399 70,413 18,589 19,333 17,965 17,105 16,581 114,154 107,994 123,410 110,371 112,269 0 0 0 0 0 13,569 13,543 13,245 13,645 13,805 25,444 29,842 25,822 22,058 21,938 823 806 728 656 624 66,548 / 72,864 72,262 74,032 20,609 28,863 31,754 36,095 26,981 7 103 118 171 108 11,217 11,762 11,772 11,832 12,103 43,884 45,138 42,494 42,101 43,257 28,926 28,811 27,613 26,721 25,564 40,193 41,363 53,858 46,547 42,681 89,783 82,995 90,938 78,586 90,592 8,026 10,451 10,345 9,591 10,258 Average annual percent change, Percent change, Percent change, FY 2008–2012 FY 2008–2012 FY 2011–2012 -4.9% -17.7% -9.8% 4.3 18.6 5.5 -17.7 -50.7 -37.0 5.0 22.2 8.0 ---3.8 16.3 9.1 5.5 24.4 24.8 4.0 17.4 23.2 ----2.2 -8.6 1.2 -2.9 -11.0 4.6 -2.5 -9.4 -1.4 -6.4 -22.5 -13.1 1.6 6.8 2.3 -0.2 -0.7 0.4 -2.5 -9.4 -1.7 0.4 1.5 -3.1 : : -4.7 -0.8 -3.3 7.2 -2.0 -7.9 0.8 -3.4 -12.6 -4.5 -3.1 -11.8 -0.7 -2.8 -10.6 -5.4 9.0 43.2 18.4 -0.8 -3.3 -2.7 2.5 10.6 7.3 -0.3 -1.1 -3.5 11.2 56.7 20.4 : : -6.3 -0.2 -0.7 0.1 -3.4 -12.9 -6.4 3.8 16.4 12.8 0.3 1.0 -9.0 5.2 23.1 3.7 -6.7 -23.6 -6.6 -2.9 -10.8 -3.1 -0.4 -1.7 1.7 0.0 0.0 0.0 0.4 1.7 1.2 -3.7 -13.8 -0.5 -6.9 -24.2 -4.9 2.7 11.2 2.4 6.7 30.9 -25.3 66.7 1,340.9 -36.7 1.9 7.9 2.3 -0.4 -1.4 2.7 -3.1 -11.6 -4.3 1.5 6.2 -8.3 0.2 -0.9 15.3 6.1 27.8 7.0 Note: Expenditures for fiscal years preceding 2012 were inflation-adjusted to 2012 dollars. See Methodology. / Not reported. : Not calculated due to changes in data reporting methods across years. -- Data are unreliable. For details, see Indigent Defense Services in the United States, FY 2008–2012 (NCJ 246683, BJS web, July 2014). aData from FY 2008 and 2010 are actual amounts from Georgia Budgetary Compliance Reports. bRetirement and other benefits are not included or only partially included. cData from FY 2010 to 2012 are the sum of Census Bureau query and judicial district expenditures from the Louisiana Public Defender Board’s Annual Reports. Data from FY 2008 and 2009 are missing amounts transferred to district courts. dData from FY 2008 are actual amounts from New Hampshire’s Operating Budget. eData from FY 2009 to 2011 are the sum of the Census Bureau query and nonpersonal service/indirect costs from New York’s Enacted Budget. fData from FY 2008 to 2012 are actual amounts from the South Dakota State Treasurer’s Fiscal Report. gData from FY 2008 to 2012 are actual amounts from Utah’s Comprehensive Annual Financial Report. Source: U.S. Census Bureau, Annual Survey of State Government Finances, FY 2008–2012. State Government Indigent Defense Expenditures, FY 2008–2012 | july 2014 5 The Bureau of Justice Statistics of the U.S. Department of Justice is the principal federal agency responsible for measuring crime, criminal victimization, criminal offenders, victims of crime, correlates of crime, and the operation of criminal and civil justice systems at the federal, state, tribal, and local levels. BJS collects, analyzes, and disseminates reliable and valid statistics on crime and justice systems in the United States, supports improvements to state and local criminal justice information systems, and participates with national and international organizations to develop and recommend national standards for justice statistics. William J. Sabol is acting director. This report was written by Erinn Herberman and Tracey Kyckelhahn. E. Ann Carson verified the report. Morgan Young and Jill Thomas edited the report. Tina Dorsey produced the report. July 2014, NCJ 246684 Office of Justice Programs Innovation • Partnerships • Safer Neighborhoods www.ojp.usdoj.gov