
Truth in Sentencing in State Prisons, DOJ BJS, 1999
Download original document:
Document text
Document text
This text is machine-read, and may contain errors. Check the original document to verify accuracy.
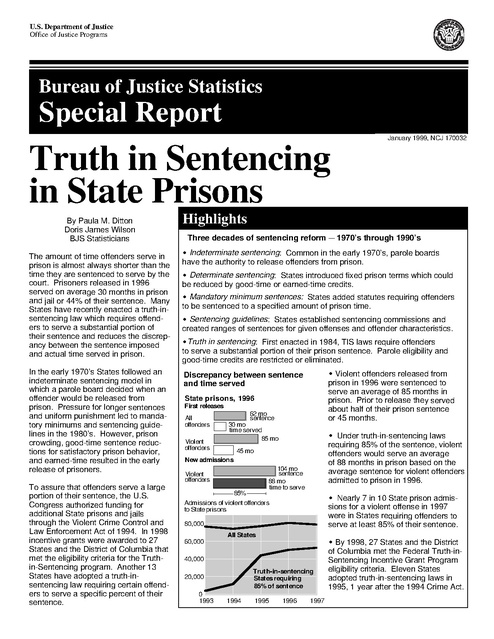
U.S. Department of Justice
Office of Justice Programs

Bureau of Justice Statistics

Special Report
January 1999, NCJ 170032

Truth in Sentencing
in State Prisons
By Paula M. Ditton
Doris James Wilson
BJS Statisticians
The amount of time offenders serve in
prison is almost always shorter than the
time they are sentenced to serve by the
court. Prisoners released in 1996
served on average 30 months in prison
and jail or 44% of their sentence. Many
States have recently enacted a truth-insentencing law which requires offenders to serve a substantial portion of
their sentence and reduces the discrepancy between the sentence imposed
and actual time served in prison.
In the early 1970’s States followed an
indeterminate sentencing model in
which a parole board decided when an
offender would be released from
prison. Pressure for longer sentences
and uniform punishment led to mandatory minimums and sentencing guidelines in the 1980’s. However, prison
crowding, good-time sentence reductions for satisfactory prison behavior,
and earned-time resulted in the early
release of prisoners.
To assure that offenders serve a large
portion of their sentence, the U.S.
Congress authorized funding for
additional State prisons and jails
through the Violent Crime Control and
Law Enforcement Act of 1994. In 1998
incentive grants were awarded to 27
States and the District of Columbia that
met the eligibility criteria for the Truthin-Sentencing program. Another 13
States have adopted a truth-insentencing law requiring certain offenders to serve a specific percent of their
sentence.

Highlights
Three decades of sentencing reform & 1970’s through 1990’s
ù Indeterminate sentencing: Common in the early 1970’s, parole boards
have the authority to release offenders from prison.
ù Determinate sentencing: States introduced fixed prison terms which could
be reduced by good-time or earned-time credits.
ù Mandatory minimum sentences: States added statutes requiring offenders
to be sentenced to a specified amount of prison time.
ù Sentencing guidelines: States established sentencing commissions and
created ranges of sentences for given offenses and offender characteristics.
ùTruth in sentencing: First enacted in 1984, TIS laws require offenders
to serve a substantial portion of their prison sentence. Parole eligibility and
good-time credits are restricted or eliminated.
ù Violent offenders released from
prison in 1996 were sentenced to
serve an average of 85 months in
prison. Prior to release they served
about half of their prison sentence
or 45 months.

Discrepancy between sentence
and time served
State prisons, 1996
First releases
All
offenders
Violent
offenders

62 mo
sentence
30 mo
time served
85 mo

ù Under truth-in-sentencing laws
requiring 85% of the sentence, violent
offenders would serve an average
of 88 months in prison based on the
average sentence for violent offenders
admitted to prison in 1996.

45 mo

New admissions
104 mo
sentence
88 mo
time to serve

Violent
offenders

85%
Admissions of violent offenders
to State prisons

ù Nearly 7 in 10 State prison admissions for a violent offense in 1997
were in States requiring offenders to
serve at least 85% of their sentence.

80,000
All States
60,000
40,000
Truth-in-sentencing
States requiring
85% of sentence

20,000
0
1993

1994

1995

1996

1997

ù By 1998, 27 States and the District
of Columbia met the Federal Truth-inSentencing Incentive Grant Program
eligibility criteria. Eleven States
adopted truth-in-sentencing laws in
1995, 1 year after the 1994 Crime Act.

Data were compiled from multiple
sources

Table 1. Truth-in-sentencing requirements, by State
Meet Federal 85% requirement

The findings in this report are based
primarily on data from the Bureau of
Justice Statistics, National Corrections
Reporting Program (NCRP), and data
collected through the Violent Offender
Incarceration and Truth-in-Sentencing
(VOI/TIS) Incentive Grants program,
administered by the Office of Justice
Programs Corrections Program Office.
Since 1983 BJS has compiled the
NCRP data series that collects individual inmate records for prison admissions and releases and parole
discharges. It is the only national level
data base with information on sentence
length, time to be served in prison,
actual time served by released prisoners, time served on parole, type of
parole discharge, and offense composition of inmates entering and exiting
prison and parole. The annual series
includes prison population movement
data and parole population data,
providing a comprehensive description
of offenders as they enter and exit
correctional custody and supervision.
During the 1990’s between 35 and 41
States have participated in NCRP.
In 1996, 37 States and the California
Youth Authority reported 469,650
admissions that represented 91% of all
admissions to State prisons, based on
data from the BJS National Prisoner
Statistics data collection. The releases
reported (427,627) represented 91% of
all releases from State prison in 1996.
All 50 States and the District of Columbia reported data through the VOI/TIS
incentive grants program as part of the
data collection for determining grant
eligibility. The VOI/TIS data provide an
additional State-level indicator of time
served with a common definition of
violent offenses. For each year
between 1993 and 1997, States
reported the number of admissions and
releases for Part 1 violent offenses and
sentence length and time served by
released violent offenders. Part 1
violent crimes include murder/
nonnegligent manslaughter, rape,
robbery, and aggravated assault.

2 Truth in Sentencing in State Prisons

Arizona
California
Connecticut
Delaware
District of Col.
Florida
Georgia
Illinoisa
Iowa
Kansas
Louisiana
Maine
Michigan
Minnesota
Mississippi

Missouri
New Jersey
New York
North Carolina
North Dakota
Ohio
Oklahomab
Oregon
Pennsylvania
South Carolina
Tennessee
Utah
Virginia
Washington

50%
requirement

100% of minimum Other
requirement
requirements

Indiana
Maryland
Nebraska
Texas

Idaho
Nevada
New Hampshire

a

Qualified for Federal funding in 1996 only.
Effective July 1, 1999, offenders will be
required to serve 85% of the sentence.
c
Two-part sentence structure (2/3 in prison;
1/3 on parole); 100% of prison term required.
d
Mandatory 70% of sentence for certain
violent offenses and manufacture of methamphetamine.
e
Violent offenders with 2 prior violent
b

Sentencing reforms parallel “get
tough on crime” attitude
Sentencing reform policies have paralleled the mood of the country on crime
and punishment, shifting between
requiring a fixed prison time prior to
release or allowing discretionary
release of offenders by judges, parole
boards, or corrections officials. Over
the last two decades, sentencing
requirements and release policies have
become more restrictive, primarily in
response to widespread “get tough on
crime” attitudes in the Nation. (See
References on page 15 for sources
on sentencing reform.)
In the early 1970's, States generally
permitted parole boards to determine
when an offender would be released
from prison. In addition, good-time
reductions for satisfactory prison
behavior, earned-time incentives for
participation in work or educational
programs, and other time reductions to
control prison crowding resulted in the
early release of prisoners. These
policies permitted officials to individualize the amount of punishment or
leniency an offender received and
provided means to manage the prison
population.

Alaskac
Arkansasd
Coloradoe
Kentuckyf
Massachusettsg
Wisconsinh

convictions serve 75%; 1 prior violent conviction, 56.25%.
Effective July 15, 1998, offenders are required
to serve 85% of the sentence.
g
Requires 75% of a minimum prison sentence.
h
Effective December 31, 1999, two-part
sentence: offenders serve 100% of the prison
term and a sentence of extended supervision
at 25% of the prison sentence.
f

Such discretion in sentencing and
release policies led to criticism that
some offenders were punished more
harshly than others for similar offenses
and to complaints that overall sentencing and release laws were too soft on
criminals. By the late 1970's and early
1980’s, States began developing
sentencing guidelines, enacting
mandatory minimum sentences and
adopting other sentencing reforms to
reduce disparity in sentencing and to
toughen penalties for certain offenses,
specifically drug offenses (as part of
the “war on drugs”), offenses with
weapons, and offenses committed
by repeat or habitual criminals.1
Washington State enacted the first
truth-in-sentencing law in 1984
States continued to increase the severity of sentencing laws (primarily for
violent offenders) by enacting restrictions on the possibility of early release,
which became known as truth in
sentencing. Truth-in-sentencing laws
1

For the additional information on sentencing
reform see the 1996 National Survey of State
Sentencing Structures, Bureau of Justice
Assistance, NCJ 169270, September 1998.

require offenders to serve a substantial
portion of the prison sentence imposed
by the court before being eligible for
release. Previous policies which
reduced the amount of time an offender
served on a sentence, such as goodtime, earned-time and parole board
release, are restricted or eliminated
under truth-in-sentencing laws. The
definition of truth in sentencing varies
among the States, as do the percent of
sentence required to be served and the
crimes covered by the laws. Most
States have targeted violent offenders
under truth in sentencing.
A few States, such as Florida, Mississippi, and Ohio, require all offenders to
serve a substantial portion of the sentence before being eligible for release.
The percent of sentence required to be
served under truth in sentencing in
general spans from 50% to 100% of a
minimum sentence (table 1).
Most truth-in-sentencing States
require offenders to serve 85%
of the prison sentence
In response to prison crowding and
public dismay with the early release of
prisoners, the U.S. Congress authorized incentive grants to build or expand
correctional facilities through the
Violent Offender Incarceration and
Truth-in-Sentencing Incentive Grants
Program in the 1994 Crime Act (Pub.L.
No. 103-322, 108 Stat. 1796 (1994)).
To qualify for the truth-in-sentencing
grants, States must require persons
convicted of a Part 1 violent crime to
serve not less than 85% of the prison
sentence. Along with other exceptions,
States may qualify by demonstrating
that the average time served in prison
is not less than 85% of the sentence.2
Twenty-seven States and the District of
Columbia qualified for the Federal grant
program in 1998 (table 1). Five States
(Delaware, Minnesota, Tennessee,
Utah and Washington) adopted truth in
sentencing prior to the 1994 Crime Act.
Arizona, California, Missouri, and North
2

For additional information on eligibility criteria
and other program requirements see Violent
Offender Incarceration and Truth-in-Sentencing
Incentive Grants: Program Guidance and
Application Kit, FY98, Office of Justice Programs
Corrections Program Office, U.S. Department of
Justice, Solicitation Number 244, NCJ 168942.

Carolina enacted truth in sentencing in
1994, and 11 States enacted laws in
1995, 1 year after the Crime Act
(Connecticut, Florida, Georgia, Kansas,
Maine, Michigan, Mississippi, New
York, North Dakota, Oregon, and
Virginia).
Several States have not adopted the
Federal 85% standard. Maryland and
Texas have a 50%-requirement for
violent offenders. Nebraska and
Indiana require all offenders to serve
50% of the sentence. Arkansas
requires certain offenders to serve
70%. Colorado requires violent offenders with 2 prior violent convictions to
serve 75% and with 1 prior violent
conviction, 56%. Massachusetts
requires 75% of a minimum prison
sentence.
14 States have abolished parole
board release for all offenders
Fourteen States have abolished early
release by discretion of a parole board
for all offenders. Seven States
abolished parole board release within
the last 10 years. Eight States
abolished parole board release during
the same year a truth-in-sentencing
Abolished discretionary parole board releasea
State
Arizona
Delaware
Floridab
Illinois
Indiana
Kansasc
Maine
Minnesota
Mississippi
North Carolina
Ohiod
Oregon
Washington
Wisconsin

Year
1994
1990
1983
1978
1977
1993
1975
1980
1995
1994
1996
1989
1984
1999

law was passed (Arizona, Delaware,
Kansas, Mississippi, Ohio, Virginia,
Washington, and Wisconsin). Parole
boards still have discretion over
inmates who were sentenced for
crimes committed prior to the effective
date of the law that eliminated parole
board release.
A few other States have abolished
parole board release for certain violent
or felony offenders (Alaska, New York,
Tennessee, and Virginia) or for certain
crimes against a person (Louisiana).
California allows discretionary release
by a parole board only for offenders
with indeterminate life sentences. In
general, States restrict the possibility
of parole board release based on the
offender’s criminal history or the
circumstances of the offense.
While discretionary release from prison
by a parole board has been eliminated
by some States, post-release supervision still exists and is generally referred
to as community or supervised release.
Parole boards, in various forms, have
the responsibility to set conditions of
release for offenders under conditional
or supervised release, the authority to
return an offender to prison for violating
the conditions of parole or supervised
release, and the power to grant parole
for medical reasons.
Between 1990 and 1997 the number
of offenders in State prison
increased 7% annually
As a result of truth-in-sentencing
practices, the State prison population is
Table 2. Trends in State prison
population and admissions, 1990-97

a

For offenses committed after the effective
date of the law.
b
In 1995, parole eligibility was abolished for
offenses with a life sentence and a 25-year
mandatory term.
c
Excluded a few offenses, primarily first degree
murder and intentional second degree murder.
Truth in sentencing passed in 1993, amended
in 1995 to meet the 85%-requirement.
d
Excluded murder and aggravated murder.

Year

Yearend
populationa

Number of
admissionsb

460,739
1990
689,577
466,285
1991
732,914
480,676
1992
780,571
475,100
1993
857,675
498,919
1994
936,896
521,970
1995
1,001,359
512,618
1996
1,048,004
1997
1,100,850
540,748
Note: Includes only offenders with a sentence
of more than 1 year.
a
Sentenced prisoners under State jurisdiction.
b
Excludes escapees, AWOLs returned, and
transfers to other jurisdictions.

Truth in Sentencing in State Prisons 3

expected to increase through the incarceration of more offenders for longer
periods of time. One purpose of the
VOI/TIS incentive grants is to enable
States to manage prison capacity by
providing funds to increase prison beds
for violent offenders.
On average, between 1990 and 1997
the prison population grew by 7%
annually. State prison inmates totaled
1,100,850 in 1997, up from 689,577 in
1990 (table 2). Most of the growth
occurred among violent offenders who
accounted for 50% of the total increase
in State prison inmates. Drug offenders comprised about 19% of the growth
and property offenders, 16%.

new sentence, increased
slightly between 1990 and
1997 (from 323,069 to
334,630), while parole violators
represented an increased
portion of prison admissions.

Offense

The most recent data on admissions by offense type (table
3) reveal that offenders incarcerated for violent offenses
increased, up from 86,600 in
1990 to 96,300 in 1996. New
court commitments for
property and drug offenders
decreased between 1990 and
1996.

Most serious offense

During this period the source of admissions to prison also changed. New
court commitments to State prison, or
offenders admitted to prison under a

Two-thirds of parole violators were
drug or property offenders. A third of
parole violators were drug offenders,
and 16% were burglary offenders.
Violent offenders accounted for 25% of
those returned to prison on a parole
revocation; nearly 11% were originally
sentenced to prison for robbery.

4 Truth in Sentencing in State Prisons

689,577 1,048,004

Violent
315,900
Property
175,000
Drug
149,700
Public-order 45,800

495,400
240,000
237,600
71,300

New court
commitments
to State prison
1990
1996
323,069 326,547
86,600
104,400
102,400
26,000

96,300
94,800
98,700
34,600

Note: Sentenced prisoners under State jurisdiction by
offense were estimated. See Methodology for details.

Number of adult arrests
1980
1990
1996

Number of new court commitments
to State prison per 1,000 arrests
1980
1990
1996

Violent offenses
Murder
Rape
Other sexual assault
Robbery
Aggravated assault

18,200
26,700
55,600
102,200
236,600

19,800
33,300
90,500
127,400
410,800

16,100
27,400
78,600
106,700
445,005

621
182
61
245
45

460
229
112
233
56

613
219
177
277
62

Property offenses
Burglary
Larceny/theft
Motor vehicle theft
Fraud

282,800
745,300
75,600
358,800

290,000
1,088,700
119,800
382,100

229,700
983,900
102,600
565,400

107
14
40
19

160
24
72
24

165
27
72
24

Drug offenses

471,200

1,008,300

1,294,700

19

103

77

Weapons offenses

141,200

181,000

163,400

11

34

55

Note: Arrest data were obtained from the FBI’s Uniform Crime Reporting Program.
Data on new court commitments by offense were estimated and include offenders
with a sentence of more than 1 year. (See Methodology for details.)

Over a third of prison admissions
in 1997 were parole violators
The percent of prison admissions who
were returned for a parole violation
has steadily increased since 1985.
Parole violators accounted for 23%
of prison admissions in 1985, 29% in
1990, 34% in 1994, and by 1997, 35%
of admissions were parole violators.

Total

Sentenced
prisoners under
State jurisdiction
1990
1996

Table 4. Adult arrests and new court commitments to State prison
per 1,000 arrests, by offense, 1980, 1990, and 1996

State prison admission rates
have dropped
While the number of inmates held
in State prisons increased 60% since
1990, the number admitted to prison
increased about 17%. In 1997,
540,748 offenders were admitted to
State prison, up from 460,739 in 1990.
The number of admissions relative to
the number of inmates in prison
dropped from 73 per 100 State prisoners in 1990 to 52 per 100 in 1997.

Table 3. Sentenced prisoners under State
jurisdiction and new court commitments
to State prison, by offense, 1990 and 1996

Year
1985
1990
1991
1992
1993
1994
1995
1996
1997

Percent of admissions
to State prison
New court
Parole
commitments violators
76.1%
70.1
68.0
69.5
66.9
64.7
64.7
63.7
61.9

23.4%
29.1
30.5
29.5
30.8
33.8
33.7
33.7
34.5

Note: Includes only offenders
with a sentence of more than
1 year. Excludes escapees,
AWOLS returned, and transfers
to other jurisdictions.

Most serious offense

Percent of admissions
to State prison, 1996
New court
Parole
commitments revocations
100.0%

100.0%

Violent offenses
Murder/nonnegligent
manslaughter
Rape
Other sexual assault
Robbery
Assault

29.5%

24.5%

Property offenses
Burglary
Larceny/theft
Motor vehicle theft

29.0%
12.0
7.5
2.1

35.1%
15.7
9.7
3.7

Drug offenses
Possession
Trafficking

30.2%
8.0
17.2

31.0%
7.0
16.1

All offenses

2.7
1.9
4.1
9.1
8.7

1.4
1.4
2.4
10.9
6.7

10.6%
8.1%
Public-order offenses
Note: Includes only offenders with a sentence
of more than 1 year. Detail may not add to total.

The commitment rate for murder
rose from 460 per 1,000 arrests
in 1990 to 613 per 1,000 in 1996

dropped 19%; rape, 18%; other sexual
assault, 13%; and robbery, 16%. There
was also a sharp decline of burglary
arrests (21%) (table 4).

State prison for murder per 1,000
arrests rose from 460 in 1990 to 613 in
1996, almost reaching the high of 621
admissions per 1,000 arrests in 1980.

In contrast to the increase in the
number of incarcerated violent offenders and the slight increase in admissions overall, arrests for the major
violent crimes (except for aggravated
assault) actually declined between
1990 and 1996. Arrests for murder

At the same time, the commitment rate,
or the number of new court commitments to State prison relative to the
number of arrests, increased for most
violent offenses between 1990 and
1996. The number of admissions to

The likelihood of going to prison upon
arrest for drug offenses substantially
increased between 1980 and 1990 as
the commitment rate soared from 19
per 1,000 arrests to 103 per 1,000. The
rate dropped to 77 commitments per

The implementation of truth-insentencing laws

In Nevada nearly 80% of prison admissions were under truth-insentencing requirements, 3 years after implementation of the law

The phase-in of truth-in-sentencing
requirements, or the number of offenders sentenced under the new law,
may vary considerably by State.
Differences in the effective date of the
law, court backlogs, case processing,
and the type of offenders covered
under the law (violent offenders versus
all offenders) may affect the number of
prison admissions sentenced under
truth in sentencing.

Effective for crimes
under truth in sentencing, 1995-98
committed after
100%
July 1, 1995,
Nevada’s truth-in80%
sentencing law
requires all offenders to serve 100%
60%
of the minimum
prison term prior to
40%
becoming eligible
for parole release.
Offenders are
20%
allowed to earn
good-time reduc0%
tions off the
July 95 Jan. 96
July 96 Jan. 97 July 97
Jan. 98 July 98
maximum prison
Note:
include
violators
returned
without a new
Note: Admissions
Effective 7/1/96,
truthparole
in sentencing
covers
all offenders.
sentence, but not
sentence,
under Department
an offense committed
prior to truth in sentencing.
Source:
Nevada
of
Prisons
the minimum.
Source: Nevada Department of Prisons
Six months after
the effective date, 28% of offenders
the number increased to 43%, and
admitted to Nevada’s prisons were
after 2 years, 60%. After 3 years,
sentenced under the truth-in79% of prison admissions were
sentencing law. After 1 year
sentenced under truth in sentencing.

Monthly data on the percent of prison
admissions sentenced under truth-insentencing laws in Nevada, Virginia,
and New York demonstrate the lag
between the effective date of truth-insentencing and the subsequent admission of offenders to prison covered
under the new law.
At 12 months, 57% of New York’s
violent felony prison admissions
were under truth in sentencing
Under a truth-in-sentencing law which
became effective October 1, 1995,
New York requires repeat violent
felony offenders to serve at least 85%
of the sentence. The law requires firsttime violent felony offenders to serve
85% based on a presumptive sentence
set at 2/3 of the maximum.
By August 1998, 3 years after the
effective date, 94% of violent felony
offenders admitted to prison were
sentenced under the 1995 truth-insentencing law. A more recent law,
effective September 1, 1998, requires
first-time violent felons to serve 85% of
a determinate sentence.

Percent of Nevada prison admissions sentenced

Virginia estimates 100% truth-in-sentencing admissions by yearend 1999
Virginia implemented a truth-inFive years after implementation,
sentencing law on January 1, 1995,
or yearend 1999, Virginia estimates
requiring all felony offenders to serve
100% of admissions will be sentenced
85% of the sentence. A year after the under truth in sentencing.
effective date, 74% of prison
admissions were sentenced Percent of Virgina prison admissions sentenced
under truth in sentencing, 1996-2003
under truth in sentencing.
100%
39% were admitted under
Both TIS and
truth in sentencing only and 80% old
law
Truth in
about 35% under both truth- 60%
sentencing
(TIS) only
in-sentencing and the old
40%
parole system. These
offenders were returned for 20%
a new offense sentenced
0%
under truth-in-sentencing
June 96 June 98 June 00 June 02 June 03
and a prior offense under
Note: Truth in sentencing covers felonies committed after 1/1/95.
the parole system (old law). Source: Virginia Criminal Sentencing Commission

Truth in Sentencing in State Prisons 5

Nearly 40% of all female, black,
and Hispanic prison admissions
were drug offenders
Thirty-seven percent of black offenders, 40% of Hispanics, and 39% of
females admitted to prison in 1996
had committed a drug offense. Black
and Hispanic inmates were nearly
twice as likely as white inmates to be
admitted to prison for a drug offense.
Women were most likely to be admitted to prison for a drug offense (39%)
or property offense (36%). Almost
31% of all males admitted to prison
in 1996 had committed a violent
offense, compared to 17% of women.
Slightly less than a third of admissions
in each racial and ethnic group had
committed a violent offense. White
offenders were more likely to be
admitted to prison for a property
offense (38%), particularly burglary
(16%).
1,000 arrests in 1996. For property
offenders, the commitment rate also
increased between 1980 and 1990 and
remained relatively constant between
1990 and 1996.
Nearly 7 in 10 violent offenders are
in a State that requires 85% of the
sentence be served
Based on data reported through the
VOI/TIS program, State facilities
reported that 78,917 new court commitments were admitted to prison for a
Part 1 violent offense in 1997. About
two-thirds (54,023) of those admissions
were in a truth-in-sentencing State
which met the Federal standard, requiring violent offenders to serve at least
85% of their sentence prior to release.
Over 90% of Part 1 violent offenders
admitted to prison in 1997 were in a
State which had passed a law requiring
at least 50% of the sentence be served
prior to release.
Despite the large proportion of offenders being admitted in States with truthin-sentencing laws, not all of these
offenders were sentenced under truth
in sentencing. Due to the time lag
between commission of the offense,
6 Truth in Sentencing in State Prisons

New court commitments to State prison, 1996:
Offense, by sex, race, and Hispanic origin
Male

Female

White*

Black* Hispanic

100%

100%

100%

100%

100%

Violent offenses
Murder/nonnegligent manslaughter
Negligent manslaughter
Rape
Other sexual assault
Robbery
Assault
Other violent

30.8%
2.9
1.1
2.1
4.5
9.6
9.0
1.7

17.3%
2.2
1.4
0.2
0.5
5.0
6.0
1.9

28.7%
2.3
1.4
2.9
6.7
5.4
7.9
2.2

29.5%
2.9
1.0
1.3
2.0
12.2
8.8
1.4

30.2%
3.3
0.9
1.4
4.3
8.9
9.7
1.7

Property offenses
Burglary
Larceny/theft
Motor vehicle theft
Fraud
Other property

28.3%
12.6
6.8
2.2
3.1
3.6

36.0%
5.9
13.6
1.0
12.8
2.8

38.1%
16.1
9.0
2.2
6.0
4.8

24.9%
9.5
7.3
1.7
3.5
2.9

20.0%
9.7
4.1
2.7
1.3
2.2

Drug offenses
Possession
Trafficking
Other/unspecified drug

29.3%
7.7
17.0
4.6

39.1%
11.2
19.3
8.6

18.7%
6.1
9.1
3.6

36.8%
9.9
20.8
6.1

39.7%
8.0
26.8
5.0

Public-order offenses

11.0%

6.8%

13.7%

8.2%

9.3%

0.6%

0.7%

0.8%

0.5%

0.8%

All offenses

Other offenses

Note: Includes only offenders with a sentence of more than 1 year.
Detail may not add to total.
*Excludes inmates of Hispanic origin.

arrest, and conviction, some offenders
entering prison in 1997 committed the
offense prior to the effective date of
recently enacted truth-in-sentencing
laws. In 1997 an estimated 42% of all
Part 1 violent offenders admitted to
prison were actually sentenced under a
truth-in-sentencing law that met the
Federal standard requiring at least 85%
of the sentence be served in prison.
Offenders admitted to prison in 1996
for robbery were expected to serve
7 months longer than in 1990
Though recent sentencing reforms are
linked to increasing time served, the
average (or mean) sentence length
imposed on offenders entering prison
decreased, from 72 months in 1990 to
68 months in 1996 (table 5). Consistent with sentencing policy change, the
projected minimum time expected to be
served by persons entering prison
increased slightly. If parole eligibility
requirements, good-time credits, and
early release policies are taken into
account, persons entering State
prisons in 1996 were expected to serve
a minimum of 42 months in prison, up
from 40 months in 1990.

For violent offenders the average
imposed sentence decreased from 107
months in 1990 to 104 months in 1996,
while the expected time to be served
increased. On average, violent offenders admitted to prison in 1996 were
expected to serve about 3 months
longer than those admitted in 1990 (or
a minimum term of 70 months versus
67 months).
By offense, the average sentence
length for murder (excluding offenders
sentenced to life) showed the largest
increase between 1990 and 1996,
up from 233 months to 253 months.
Offenders admitted to prison in 1996
for murder, without a life sentence,
were expected to serve about 40
months longer (215 months) than
offenders admitted in 1990 (176
months). Just over a third of offenders
admitted to prison in 1996 for murder/
nonnegligent manslaughter were
sentenced to life in prison. Another 6%
were sentenced to life without parole,
and about 2% were sentenced to
death.

Table 5. New court commitments to State prison, 1990 and 1996:
Average sentence length and minimum time to be served
Mean maximum
sentence lengtha
1990
1996

Most serious offense

Mean minimum
time to be servedb
1990
1996

72 mo

68 mo

40 mo

42 mo

107 mo
233
106
153
97
101
74
96

104 mo
253
117
140
107
101
72
82

67 mo
176
63
90
62
53
49
70

70 mo
215
61
72
64
60
46
54

Property offenses
Burglary
Larceny/theft
Motor vehicle theft
Fraud

62 mo
75
50
51
54

54 mo
67
43
41
47

31 mo
37
24
27
23

30 mo
37
25
29
22

Drug offenses
Possession
Trafficking

63 mo
62
66

57 mo
51
62

30 mo
24
33

32 mo
30
34

Public-order offenses

41 mo

44 mo

26 mo

25 mo

278,417

266,705

129,489

128,863

All offenses
Violent offenses
Murder/nonnegligent manslaughter
Negligent manslaughter
Rape
Other sexual assault
Robbery
Assault
Other violent

Number of admissions

Note: Includes only offenders with a sentence of more than 1 year. Excludes
sentences of life without parole, life plus additional years, life, and death.
a
Maximum sentence length an offender may be required to serve for the most serious offense.
b
Minimum time to be served is the jurisdiction’s estimate of the shortest time each admitted
prisoner must serve before becoming eligible for release.

prison prior to release. Public order
offenders were expected to serve 49%
percent of their sentence.
Since many States are unable to report
the minimum time to be served by
offenders admitted to prison, estimates
of minimum time to be served and
percent of sentence to be served were
calculated with data from 26 States or
about half of State prison admissions.
The projected percent of sentence to
be served is expected to increase as
the number of offenders entering prison
who were sentenced under recently
enacted truth-in-sentencing laws
continues to grow.
Percent of sentence to be served by new court
commitments to State prison, 1996*
Most serious
offense
All offenses

Percent
49%

Violent
Property
Drug
Public-order

51%
46
46
49

*Based on total sentence length.

Table 6. Estimated average time to be served under truth-in-sentencing laws

Most serious offense
Selected violent offenses
Murder/nonnegligent
manslaughter
Rape
Robbery
Assault

New court
commitments, 1996
Maximum Minimum
sentence
time to be
length
served
104 mo
253
140
101
72

73 mo
214
72
60
45

Estimated time to be served
85% of
75% of
50% of
sentence
sentence
sentence
88 mo
215
119
86
61

78 mo
190
105
76
54

52 mo
127
70
51
36

Note: Includes only offenders with a sentence of more than 1 year.
Excludes sentences of life without parole, life plus additional years, life, and death.

Both the average sentence length and
minimum time to be served in prison
decreased for rape offenders admitted
between 1990 and 1996. The average
sentence length for rape dropped from
153 months to 140 months. The
minimum time to be served for rape
offenders decreased, from 90 months
in 1990 to 72 months in 1996.
Offenders admitted to prison in 1996
for drug law violations were sentenced
to an average of 57 months in prison,
a 6 month decrease from 1990. Drug

offenders were expected to serve 2
months longer in prison (32 months
in 1996 versus 30 months in 1990).
Violent offenders admitted to prison
in 1996 were expected to serve
about half of their sentence
Based on the average sentence length
and minimum time to be served, violent
offenders admitted to prison in 1996
were expected to serve at minimum
51% of their sentence. Drug and
property offenders were expected to
serve about 46% of their sentence in

Truth-in-sentencing laws would
increase the minimum prison term
by 15 months for violent offenders
Under a truth-in-sentencing law requiring 85% of the sentence, violent offenders would be expected to serve an
estimated 15 months longer than the
projected average minimum time to be
served by offenders entering prison in
1996 (table 6). Assuming the average
sentence length for those sentenced
under truth in sentencing remains the
same as that for new court commitments to State prison in 1996, violent
offenders required to serve 85% of their
sentence would serve a minimum of 88
months in prison prior to becoming
eligible for release.
Offenders in prison for murder (excluding offenders sentenced to life) are
projected to serve about the same
amount of time in prison under an 85%
requirement, compared to the current
projected minimum prison term for
1996 (215 months). Offenders in
prison for rape are estimated to serve a
minimum of 119 months in prison if

Truth in Sentencing in State Prisons 7

sentenced under an 85% requirement,
or 47 months longer than the 1996
projected minimum term of 72 months.
Based on the maximum sentence
length of offenders entering prison for
robbery, a minimum 86-month prison
term would be expected under an 85%
requirement, compared to the current
60-month projected minimum prison
term for 1996.

sentencing requirement, violent offenders would serve on average a minimum
of 52 months in prison prior to becoming eligible for release.
For releases, average time served in
prison increased from 22 months in
1990 to 25 months in 1996

Violent offenders would serve
about 10 months less under
a 75%-requirement than
an 85%-requirement

State prisoners released for the first
time on their current offense served on
average 30 months, or 25 months in
prison and 5 months in jail in 1996.
Offenders released in 1990 served on
average 28 months, or 22 months in
prison and 6 months in jail (table 7).

Assuming sentence length remains
constant, violent offenders would be
expected to serve on average 78
months in prison under a 75% requirement, or 10 months less than offenders
under an 85% truth-in-sentencing
requirement. Under a 50% truth-in-

Between 1990 and 1996 total time
served by released prisoners increased
for every offense, except robbery,
which decreased slightly from 48
months in 1990 to 46 months in 1996,
and a small category of other violent
offenses, which dropped from 38

months in 1990 to 35 months in 1996.
Violent prisoners released in 1996
served on average 45 months in prison
and jail, or about 50% of the average
sentence prior to release, up from 44%
in 1990. Offenders released from
prison for rape in 1996 served a total of
66 months, up from 62 months for
those released in 1990. Offenders
released for other sexual assault
offenses in 1996 served 45 months or
9 months longer than those released
in 1990. Offenders released for assault
also served longer in 1996 compared
to 1990 (33 months versus 30 months).
Offenders released for motor vehicle
theft during 1996 served on average 24
months in prison and jail, a 4-month
increase from those released in 1990.
Drug offenders released in 1996 served
nearly 6 months longer in prison than
offenders released for a drug offense
in 1990 (20 months versus 14 months).

Table 7. Mean sentence length and time served for first releases from State prison, 1990 and 1996

Most serious offense

Mean maximum
sentence lengtha
1990
1996

Mean time served for first releases
Jailb
Prison
1990
1996
1990
1996

Total time servedc
1990
1996

Percent of
sentence servedd
1990
1996

All offenses

69 mo

62 mo

6 mo

5 mo

22 mo

25 mo

28 mo

30 mo

38.0%

44.4%

Violent offenses
Murdere
Negligent manslaughter
Rape
Other sexual assault
Robbery
Assault
Other violent

99 mo
209
88
128
77
104
64
80

85 mo
180
97
116
81
92
61
67

7 mo
9
5
7
5
7
6
6

6 mo
11
6
6
5
6
6
6

39 mo
83
31
55
30
41
23
33

39 mo
84
41
61
39
40
28
29

46 mo
92
37
62
36
48
30
38

45 mo
95
47
66
45
46
33
35

43.8%
43.1
41.0
45.5
43.8
42.8
43.9
43.5

49.6%
50.9
46.6
52.6
51.7
47.0
51.7
48.9

Property offenses
Burglary
Larceny/theft
Motor vehicle theft
Fraud
Other property

65 mo
79
52
56
56
55

56 mo
68
47
45
51
48

6 mo
6
6
7
6
4

5 mo
5
4
5
4
4

18 mo
22
14
13
14
18

22 mo
26
18
19
18
20

24 mo
29
20
20
20
22

26 mo
31
22
24
22
24

34.4%
33.9
35.5
33.1
33.2
37.6

43.0%
42.4
43.2
49.1
38.2
46.1

Drug offenses
Possession
Trafficking
Other/unspecified drug

57 mo
61
60
42

57 mo
55
62
45

6 mo
6
6
4

5 mo
4
5
5

14 mo
12
16
12

20 mo
17
22
17

20 mo
18
22
16

24 mo
22
26
23

32.9%
29.0
34.8
34.8

39.8%
37.6
39.3
46.7

Public-order offenses

40 mo

41 mo

5 mo

4 mo

14 mo

17 mo

18 mo

21 mo

42.6%

45.9%

Other offenses

51 mo

50 mo

6 mo

6 mo

16 mo

19 mo

23 mo

25 mo

39.2%

45.6%

Total

212,166

252,238

174,161

203,167

Note: Includes only offenders with a sentence of more than 1 year
released for the first time on the current sentence. Excludes prisoners
released from prison by escape, death, transfer, appeal or detainer.
Data were reported on maximum sentence length for 93.4% of the
227,100 first releases reported to NCRP in 1990 and 97.6% of the
258,480 first releases reported in 1996. Data were reported on time
served in jail for 76.7% in 1990 and 78.6% in 1996, and time served
in prison for 94.6% in 1990 and 98.4% in 1996.

8 Truth in Sentencing in State Prisons

214,871
a

254,217

Maximum sentence length an offender may be required to serve
for the most serious offense. Excludes sentences of life without
parole, life plus additional years, life and death.
b
Average time spent in jail credited towards the current offense.
c
Based on mean time served in jail and mean time served in prison
by offense.
d
Based on the mean total time served and mean total sentence length by
offense. Details may not add to total because of rounding.
e
Includes nonnegligent manslaughter.

Overall, offenders released from prison
in 1996 served about 44% of their
sentence, up from 38% in 1990. Drug
offenders served the smallest percentage of their sentence, about 40% for
those released in 1996, up from 33%.

Time served by released Part 1
violent offenders increased in 38
States between 1993 and 1997
Data on the average time served
reported to the VOI/TIS incentive
grants program vary from the NCRP

data due to differences in the definition
of violent crimes. NCRP time served
statistics for violent offenders include
Part 1 violent crimes and a number of
other violent crimes such as kidnaping,
simple assault, sexual assault, and
reckless endangerment.

Table 8. Part 1 violent offenders released from State prison, 1993, 1995, and 1997
1993
Mean
maximum
sentencea
All Statesc
Alabama
Alaska
Arizona
Arkansas
Californiad
Colorado
Connecticut
Delawaree
Floridad
Georgiad
Hawaii
Idaho
Illinois
Indiana
Iowae,f
Kansase,f
Kentuckyf
Louisianad,e
Mained
Marylandd
Massachusettsd
Michigan
Minnesota
Mississippi d,e
Missouri
Montanae
Nebraskae
Nevada
New Hampshiree
New Jersey
New Mexicoe
New Yorkd
North Carolina
North Dakota
Ohio
Oklahoma
Oregon
Pennsylvania
Rhode Island
South Carolina
South Dakota
Tennessee
Texasd
Utahe
Vermonte
Virginia
Washington
West Virginiae
Wisconsin
Wyomingd,e

1995

Percent of
Mean time sentence
served
servedb

Mean
maximum
sentencea

1997

Percent of
Mean time sentence
served
servedb

Mean
maximum
sentencea

Percent of
Mean time sentence
served
servedb

98 mo

43 mo

47%

95 mo

46 mo

51%

93 mo

49 mo

54%

-115 mo
69
131
58
98
71
-67
150
138
104
91
108
192
-242
104
-118
123
-50
105
92
163
118
-98
121
70
94
136
47
237
104
111
117
80
100
101
130
150
121
93
107
41
171
83
140

-65 mo
43
35
33
39
38
41
28
63
64
59
40
54
39
29
77
67
43
63
51
46
34
45
72
54
55
-36
47
37
50
33
31
61
34
43
54
44
44
36
48
52
43
32
41
31
76
41
69

-57%
62
27
57
40
54
-42
42
47
57
44
50
20
-32
64
-53
42
-68
43
78
33
47
-37
39
54
53
24
66
26
33
39
46
55
44
35
37
35
36
34
38
76
44
49
49

-95 mo
66
137
62
99
71
-71
134
139
119
90
109
155
-210
113
-110
119
-54
117
87
117
109
-98
123
62
94
127
34
230
106
64
115
72
102
78
121
142
111
107
91
47
175
84
76

-61 mo
43
38
35
51
45
43
40
64
66
72
40
57
40
31
80
65
35
61
59
50
36
54
68
43
52
-37
50
38
52
39
26
68
38
38
59
45
46
37
54
61
51
44
44
33
80
41
43

-64%
65
28
57
52
64
-56
48
48
61
45
52
26
-38
58
-55
50
-66
46
78
37
48
-38
41
61
55
31
77
29
36
60
51
63
45
47
45
43
46
41
49
70
46
49
56

-83 mo
70
150
62
97
77
-84
110
134
104
106
115
130
-180
117
-108
99
-50
122
82
105
134
83
95
102
67
96
117
74
192
98
60
108
70
91
88
127
114
109
94
105
49
160
87
124

-55 mo
52
38
36
50
53
44
50
68
61
51
46
55
49
41
87
59
49
60
58
54
35
57
71
49
60
37
42
46
38
57
47
47
63
42
38
64
46
46
41
56
59
46
82
55
36
65
48
54

-67%
74
25
58
51
68
-59
62
46
49
44
48
38
-49
51
-56
58
-69
46
86
47
45
45
44
45
57
60
40
64
33
43
63
59
66
51
47
44
52
43
87
52
74
41
55
44

Note: Data were obtained from the Violent Offender Incarceration and Truth-inSentencing Incentive Grants Program. Includes only offenders with a sentence of
more than 1 year released for the first time on the current sentence. Excludes
persons released from prison by escape, death, transfer, appeal or detainer. Part I
violent crimes include murder/nonnegligent manslaughter, rape, robbery and aggravated assault
--Not reported.
a
Excludes sentences of life or death.

b

Based on States which reported both mean maximum
sentence and mean time served.
c
Mean sentence length, mean time served, and percent
of sentence served are weighted averages.
d
Used broader definition of violent crime approved
for the grant program.
e
Jail time not included in time served data.
f
Time served includes released offenders sentenced
to life or death.

Truth in Sentencing in State Prisons 9

VOI/TIS data generally include only
Part 1 violent crimes (murder/ nonnegligent manslaughter, rape, robbery, and
aggravated assault) (table 8). Some
States used an alternative definition of
violent crime approved through the
grant program, based on the NCRP
definition.

average time served in prison and jail
was 49 months, or 54% of the average
total maximum sentence. Overall, the
average percent of sentence served
increased from 47% in 1993 to 51% in
1995, and by 1997 released Part 1
violent offenders had served 54% of
the average sentence.

ranged from 49 months in Washington
to nearly four times that in Ohio (192
months).

Part of the variation in sentence length
and percent of sentence served is due
to differences between determinate and
indeterminate sentencing. Offenders in
indeterminate sentencing States may
Through the VOI/TIS program, 38
The percent of sentence served by
be sentenced to a relatively long
States reported an increase in the
released violent offenders varied widely maximum prison term and a short
average time served by released Part 1 among reporting States, ranging from
minimum term, compared to the fixed
prisoners between 1993 and 1997.
25% in Arkansas to 87% in Vermont for sentence of a determinate sentencing
Vermont reported the largest increase
1997. Variations in the percent of
State. Variations by State in the
in time served (up 50 months) between sentence served are due to State differ- percent of sentence served may also
1993 and 1997, followed by Florida (22 ences in both time served and the
reflect other State-specific sentencing
months) and North Dakota (16
maximum sentence length of released
practices, a differing mix of the type of
months). Overall, time served for
offenders. The average sentence
violent offenders being released, and
released Part 1 violent offenders
length of released violent prisoners
changing release policies.
increased from 43 months in 1993 to
46 months in 1995 and 49 months by
Table 9. Type of release from State prison,
1990, 1993-1997
1997. The average time served for
Part 1 violent offenders released in
1990
1993
1994
1995
1996
1997*
1997 ranged from 35 months in
86.0%
86.0%
85.9%
84.1%
81.4%
81.4%
Conditional releases
Minnesota to 87 months in Kentucky.
Part I violent offenders released in
1997 served between 25% and 87%
of their sentence
Among prisoners released in 1997, the
average sentence for a Part 1 violent
crime was about 93 months and the
Black offenders released in 1996
served 2 months longer than white
offenders

Parole
Mandatory
Other

40.5
29.6
15.9

14.0%
14.0%
Unconditional
Expiration of sentence
13.0
12.2
Other
1.0
1.8
Note: Data were obtained from the National Prisoners
Statistics data collection.
*Preliminary.

Females released in 1996 served an
average of 8 months less than males.
Females served 9 months less than
males for a violent offense, about 8
months less for a property offense,
and 4 months less for a drug offense.

10 Truth in Sentencing in State Prisons

36.1
36.8
13.0

33.4
40.2
10.5

31.5
39.4
10.5

29.3
41.2
10.9

14.1%
12.9
1.2

15.9%
15.0
0.9

18.6%
17.4
1.2

18.6%
17.5
1.1

Mean time served in prison by first releases from State
prison, by sex and race, 1996
Male

Black offenders released in 1996
served about 41 months in prison for a
violent offense, compared to 38 months
for white offenders. For murder white
offenders served 90 months, compared
to 86 months for black offenders and 76
months for Hispanics. Black offenders
sentenced to prison for rape served
about 14 months longer than whites
(70 months versus 56 months).

39.9
32.5
13.7

First releases from State prison
Female
White*
Black* Hispanic

26 mo

18 mo

24 mo

26 mo

23 mo

Violent offenses
Murder/nonnegligent
manslaughter
Rape
Robbery
Assault

39 mo

30 mo

38 mo

41 mo

33 mo

86
61
41
28

67
48
28
23

90
56
42
25

86
70
42
30

76
51
30
27

Property offenses
Burglary
Larceny/theft
Motor vehicle theft

23 mo
27
19
19

15 mo
18
15
14

21 mo
25
18
19

23 mo
29
19
21

22 mo
26
19
17

Drug offenses
Possession
Trafficking

20 mo
18
22

16 mo
15
18

18 mo
15
20

20 mo
18
22

20 mo
21
21

Public-order offenses

17 mo

15 mo

16 mo

18 mo

15 mo

All offenses

Note: Data were obtained from the National Corrections Reporting Program.
Includes only offenders with a sentence of more than 1 year
released for the first time on the current sentence. Excludes persons
released from prison by escape, death, transfer, appeal, or detainer.
*Excludes inmates of Hispanic origin.

Prisoners released in 4 States
served over 70% of the sentence
Part 1 violent offenders released in
Vermont, Missouri, Washington, and
Arizona during 1997 served on average
over 70% of the average sentence.
Time served in these four States
ranged from an average of 36 months
for offenders released in Washington to
82 months for prisoners released in
Vermont. Part 1 violent offenders
released from Kentucky served the
longest amount of time in prison and jail
(87 months), which represented 49%
of the average maximum sentence.
Top 10 States, by percent
of sentence served, 1997
Time
served
Vermont
Missouri
Washington
Arizona
Minnesota
Connecticut
Alaska
Rhode Island
North Dakota
Oregon

Percent of
sentence

82 mo
71
36
52
35
53
55
46
47
38

Release type

1990
1991
1992
1993
1994
1995
1996

Parole
board
23 mo
23
23
23
24
24
25

About 81% of prisoners released in
1997 were conditionally released to
community supervision (table 9). The
remaining 19% were released into the
community without further correctional
supervision, up from 14% in 1990.
Consistent with recent trends in requiring longer portions of the sentence to
be served, more released prisoners in
1997 served their entire prison term
(18%), compared to 1990 (13%). Also,
more offenders were released to
mandatory parole (release supervision
mandated by law rather than granted
by a parole board) during 1997,
compared to 1990 (41% versus 30%).
Time served increased for parole
board releases between 1990 and
1996

87%
86
74
74
69
68
67
66
64
63

Table 10. Time served in prison
for first releases from State prison,
by release type, 1990-96

Year

Nearly 18% of released offenders
served their entire prison sentence

Mandatory
parole

Expiration
of
sentence

20 mo
20
19
19
20
23
24

27 mo
27
22
23
26
25
26

Note: Includes only offenders with a
sentence of more than 1 year released
for the first time on the current sentence.
Excludes persons released from prison by
escape, death, transfer, appeal or detainer.

Parole boards have followed the trend
toward increasing the amount of time
offenders serve in prison. The average
time served among offenders released
by a parole board increased from 23
months in 1990 to 24 months in 1994

and 25 months in 1996 (table 10). The
time served for those released under
nondiscretionary mandatory parole also
increased from 20 months in 1990 to
23 months in 1995 and 24 months in
1996.
Violent offenders released by parole
boards served 4 months longer than
other conditional releases
During 1996, violent offenders released
by the discretion of a parole board
served 42 months while other conditional releases (mandatory parole and
other non-discretionary conditional
releases) served 38 months in prison
(table 11). Offenders released by a
parole board who were in prison for
murder/nonnegligent manslaughter
served 21 months longer than other
conditional releases (96 months versus
75 months). Offenders serving time for
assault who were released by a parole
board served 30 months, or 5 months
longer than other conditional releases
(25 months).
Property offenders served about 22
months under both types of release.
Drug offenders released by a parole

Table 11. Sentence length, time served, and percent of sentence served, for first
releases, by offense and release type, 1996

Most serious offense
All offenses
Violent offenses
Murder/nonnegligent
manslaughter
Rape
Other sexual assault
Robbery
Assault

Maximum sentence
Parole Other
board
conditional*

Time served in prison
Parole Other
board conditional*

Percent of sentence
served in prison
Parole Other
board conditional*

79 mo

47 mo

25 mo

25 mo

29.1%

47.0%

113 mo

65 mo

42 mo

38 mo

34.0%

53.2%

96
65
44
42
30

75
64
41
40
25

35.6
37.6
35.5
32.4
35.1

52.3
57.2
50.0
56.9
51.5

229
157
117
118
81

138
94
75
63
45

Property offenses
Burglary
Larceny/theft
Motor vehicle theft

73 mo
88
59
61

43 mo
50
39
36

23 mo
27
18
19

22 mo
28
19
18

28.0%
28.3
27.9
28.7

45.7%
49.3
43.3
41.8

Drug offenses
Possession
Trafficking

74 mo
66
80

40 mo
42
42

21 mo
18
22

19 mo
18
21

25.6%
24.5
25.3

41.8%
39.6
44.4

Public-order offenses

47 mo

36 mo

16 mo

17 mo

29.9%

42.8%

Other offenses

60 mo

33 mo

20 mo

14 mo

31.2%

36.5%

Note: Data were obtained from the National Corrections Reporting Program. Includes only offenders with a sentence of more than 1 year released for the first time on the current sentence.
Excludes persons released from prison by escape, death, transfer, appeal or detainer.
*Includes mandatory parole releases and other nondiscretionary conditional releases for select
States.

Truth in Sentencing in State Prisons 11

board served 21 months and other
conditional releases served about 19
months in prison. Persons in prison for
a public-order offense served about the
same amount of time whether released
by a parole board (16 months) or other
conditional releases (17 months).

sentence served was the result of
longer sentences for offenders who
were eligible for discretionary parole
board release. Offenders released in
1996 by a parole board had an average
sentence of 79 months, 32 months
longer than other conditional releases
(47 months).

Parole board releases served 29%
of the sentence, and other
conditional releases, 47%

Prisoners are serving more time
than release data indicate

Offenders released by a parole board
during 1996 served a smaller percent
of their sentence than other conditional
releases (29% versus 47%). Offenders
in prison for a violent offense who were
released by a parole board served 34%
of their sentence, and other conditional
releases served just over half (53%) of
their sentence. The difference between
the two release types in percent of

The average time-served data reported
for released prisoners understate the
actual time that will be served by
persons entering prison. The numbers
reflect the time served by prisoners
actually released without accounting for
those who will never be released. In
addition, prisoners with extremely long
sentences will not show up in the
release statistics for many years.
Current time-served data
are based on released
offenders who were generally sentenced under past
or “old law” sentencing
policies. Offenders
sentenced under recently
implemented truth in
sentencing or “new laws”

State prison population
and admissions, 1990-97
1,200,000
Yearend
population
800,000
Admissions
400,000

0
1990

1992

1994

1996
Most serious offense

Note: Numbers for 1997 are preliminary.

Mean maximum sentence length
All
Publicorder
offenders Violent
Property Drug
65 mo
66
60
66
64
61
62

The State prison population dramatically increased between 1990 and
1997 (figure 1). Since 1990 the State
prison custody population has
increased by 57%, reaching a high of
1,075,052 inmates in 1997, up from
684,544 in 1990. The growth has not
been entirely the result of more offenders entering State prison. The number
of offenders admitted each year has
remained fairly constant in recent
years. Admissions to State prisons
have increased by about 17% since
1990, up from 460,739 to 540,748 in
1997. An increasing amount of time
served by offenders is contributing to
the growth in State prison populations.
(See Blumstein and Beck, 1999.)
The sentences of released offenders
decreased between 1990 and 1996
Another indicator of increasing time
served is a shorter average sentence
length of those actually released from

94 mo
92
89
90
85
84
84

61 mo
63
53
61
60
56
56

54 mo
59
53
61
60
57
57

37 mo
38
35
39
42
39
40

Note: Includes only offenders with a sentence of more
than 1 year released for the first time on the current
sentence. Excludes persons released from prison
by escape, death, transfer, appeal, or detainer.

12 Truth in Sentencing in State Prisons

Number of releases
1990
1996

Release rate*
1990
1996

405,400

467,200

37.0

30.9

Violent offenses
Murder/nonnegligent
manslaughter
Negligent manslaughter
Rape
Other sexual assault
Robbery
Assault
Other violent

103,000

115,300

24.8

19.0

7,700
4,100
7,700
9,700
46,600
23,900
4,100

6,100
4,200
7,000
13,500
44,800
33,100
6,100

9.7
22.2
23.8
20.4
31.8
31.6
24.4

5.2
20.1
15.4
17.4
23.9
25.4
21.9

Property offenses
Burglary
Larceny/theft
Motor vehicle theft
Fraud
Other property

158,900
75,800
42,200
11,400
17,800
11,800

154,000
65,800
41,100
14,000
18,200
14,900

46.8
45.8
53.2
44.2
46.1
38.6

38.5
36.2
43.9
38.9
39.3
35.0

Drug offenses

105,800

148,900

41.6

38.8

30,000

44,800

40.6

38.8

Total

Table 12. Mean sentence length of first releases
from State prison, 1990-96

1990
1991
1992
1993
1994
1995
1996

State prison population growth is
linked to increasing time served

Table 13. Rate of release from State prison,
by offense, 1990 and 1996

Source: Correctional Populations in the United
States, 1996. BJS report, NCJ 170013, January 1999.

Year

requiring large portions of the sentence
to be served do not show up in current
release statistics.

Public-order offenses

7,700
4,200
71.8
54.9
Other offenses
Note: Releases exclude escapees, AWOL’s, and transfers, and
include prisoners with a sentence of more than 1 year.
*Number of releases per 100 State prisoners. The prisoner count includes
inmates at the beginning of each year plus those admitted during the year.

prison. As a result of changes in
sentencing and release policies, the
more serious offenders with long
sentences are being held in prison, and
less serious offenders with shorter
sentences make up an increasing
fraction of the released prisoners.
Overall, the average sentence length
of offenders released from prison in
1996 was 62 months, down from 65
months in 1990 (table 12). The
average sentence length of violent
offenders released in 1996 was 10
months shorter than those released in
1990 (84 months versus 94 months).
Property offenders released in 1996
had a 5-month shorter average
sentence length. Offenders with long
sentences for violent and property
offenses may be serving longer periods
of time in prison.

The release rate for rape offenders
dropped from 24 per 100 to 15 per
100 State prison inmates
While the actual number of prisoners
released each year continues to
increase, the rate of release (or the
number of releases relative to the
number of inmates in prison) dropped.
In 1996 an estimated 467,200 offenders were released from prison up from
405,400 in 1990 (table 13). However,
the release rate dropped from 37 per
100 State prisoners in 1990 to 31 per
100 in 1996.
The overall decline in the release rate
was also due to a declining rate of
release for violent and property offenders. The violent offender release rate
dropped from 25 per 100 State prisoners in 1990 to 19 per 100 in 1996. The
release rate for murder showed the

Table 14. Part I violent offenders admitted and released from State prison
under truth in sentencing, for selected States, 1997
New court commitments
Average
Maximum time to be
a
Number sentence
served
Determinate
Arizona
Connecticut
Delawareb
Floridac,d
Illinoise,f
Minnesotag
New Yorkd,h
Ohio
Virginia

First releases
Maximum
Number sentence

1,359
561
264
3,720
936
748
1,107
2,660
932

74 mo
128
82
72
208
46
100
54
140

64 mo
/
/
61
192
46
86
/
126

360
2
68
465
0
433
0
165
110

Indeterminate
Californiad
5,277
Iowa
66
d,e
Massachusetts
753
Missouri
464
Nevadae
483
1,805
New Yorkd,h
North Dakota
29
South Carolina
515
i
Tennessee
346

123 mo
233
80
201
173
64
92
183
207

105 mo
198
59
171
/
54
/
160
184

0
186
0
48
98
4
2
9

Note: Data were obtained from the Violent
Offender Incarceration and Truth-in-Sentencing
Incentive Grants Program.
/Not reported.
--Not applicable.
a
Excludes prisoners sentenced to life or death.
b
Jail time not included in time served data.
c
Releases serving less than 85% are the result
of a judicial action impacting sentencing
structure.
d
Used a broader definition of violent crime.
e
Not a Federally funded truth-in-sentencing
State.
f
Includes only select violent crimes (primarily
murder).

g

/

Percent of
Time
sentence
served served

30 mo
29
35
19
-22
-9
25

27 mo
25
31
15
-22
-9
22

/
--

/
--

36
-43
24
21
18
10

26
-18
19
19
15
6

90%
88
88
80
-100
-100
88

/
--

71
-42
80
88
83
59

Average executed sentence (which includes
the maximum supervised release term) was 68
months for admissions and 33 months for
releases.
h
Under New York’s 1995 truth-in-sentencing law
first felony offenders are given an indeterminate
sentence, second felony offenders a determinate sentence. For indeterminate cases the
statutory presumptive release date is reported
rather than the maximum sentence.
i
All 9 releases were either judicially released or
sentenced under a split confinement and
released on probation.

most dramatic decline, cut nearly in half
from about 10 per 100 in 1990 to 5
per 100 in 1996. Robbery and assault
decreased from a release rate of 32
per 100 in 1990 to about 25 per 100
in 1996. The release rate for property
offenders decreased from 47 per 100
State prisoners in 1990 to 39 per 100
in 1996. The rate for drug and publicorder offenses decreased slightly from
about 41 per 100 prisoners in 1990 to
39 per 100 in 1996.
Few offenders admitted under truthin-sentencing laws are being
released from prison
Through the VOI/TIS program, 15
Federally funded truth-in-sentencing
States and 3 non-Federally funded
States reported 1997 admission and
release data on offenders sentenced
under truth in sentencing (table 14).
Three States reported that none of the
offenders admitted under a truth-insentencing law was released from
prison during 1997 (Illinois, Iowa, and
Missouri). Four States reported fewer
than 10 offenders were released
(Connecticut, North Dakota, South
Carolina, and Tennessee).
Among the reporting States, prisoners
admitted under truth-in-sentencing and
released from prison during 1997 had
both short sentences and prison terms.
The average sentence of released
offenders ranged from 9 months in
Ohio where offenders served 9 months
in prison to 43 months in Nevada
where offenders served 18 months.
Since the small number of truth-insentencing prisoners who were
released during 1997 had short
sentences, the average time served by
these offenders is not comparable to
national time served data. Due to the
estimated time to be served by offenders admitted under truth-in-sentencing,
these offenders are not expected to be
released from prison for many years.
Six States projected an average
10-year prison term under truth
in sentencing
Both the sentence length and projected
average time to be served by Part 1

Truth in Sentencing in State Prisons 13

violent offenders admitted to prison
during 1997 under a truth-in-sentencing
law vary greatly by State. Of the 17
States able to report data, the average
maximum sentence length ranged from
46 months in Minnesota to 233 months
in Iowa. Generally, the average
maximum sentence of indeterminate
sentencing States was longer than that
of determinate sentencing States.
For the 12 States reporting data, the
average projected time to be served
for Part 1 violent offenders admitted
under a truth-in-sentencing law during
1997 ranged from 46 months in Minnesota to 198 months in Iowa. Six of the
12 States projected that offenders
admitted under a truth-in-sentencing
law would serve on average over 10
years in prison prior to becoming eligible for release.

Methodology
The National Corrections Reporting
Program (NCRP) collects individual
level data for persons admitted to and
released from State prisons and
offenders exiting parole supervision, by
calendar year. The data cover prisoners admitted to or released from
custody regardless of the jurisdiction
where the prisoner was sentenced.
While NCRP collects data on all offenders, this report includes data on prisoners with a total sentence of more than a
year.

The NCRP datasets are available from
the National Archive of Criminal Justice
Data at the University of Michigan and
can be downloaded via the Internet.
A codebook, explanatory notes, and
sample SPSS and SAS statistical setup
files are included with each dataset.
The datasets for 1983 through 1995
7 States reported an average percent are also available on a series of eight
CD-ROM’s.
of sentence served above 85%
Violent offenders sentenced and
released under truth-in-sentencing
requirements are serving a large
portion of their sentence. For Part 1
violent offenders sentenced under a
truth-in-sentencing law and released
during 1997, seven States reported an
average percent of sentence served
above 85% (Arizona, Connecticut,
Delaware, Minnesota, Ohio, North
Dakota, and Virginia). An additional
four States reported an average
percent of sentence served between
70% and 80% (Florida, Massachusetts,
New York, and South Carolina).
As the number of offenders sentenced
under truth in sentencing continues to
grow, the national average percent of
sentence served by violent offenders
should also continue to increase.
Because truth-in-sentencing laws are
relatively recent, however, the majority
of offenders sentenced under them will
not be released from prison for many
years. Statistics based on current
release data may underestimate
changes in time served due to truth in
sentencing.

14 Truth in Sentencing in State Prisons

Estimating the admission and release
rates by offense
The admission and release rates for
sentenced prisoners under State jurisdiction by offense were estimated using
the yearend custody population derived
through the forward and backward
estimation procedure outlined in BJS
report Prisoners in 1996 (NCJ 164619).
Data from the BJS State and Federal
inmate surveys, conducted in March
1986 and August 1991, were used to
estimate a custody population by type
of offense for each year from 1986
through 1996.

To obtain the base year jurisdiction
population, the proportion of the
estimated 1989 and 1995 custody
numbers by type of offense was
applied to the sentenced jurisdiction
population from the National Prisoners
Statistics (NPS) collection. For the
1990 and 1996 admissions and
releases, the offense distribution (in
percentages) from NCRP were multiCaution should be used for year-to-year plied by the total number of admissions
comparisons of NCRP data to account and releases of sentenced prisoners
reported in NPS. The final estimates of
for differences based on State particithe number of inmates by offense for
pation and valid data reported. Varia1990 and 1996 were calculated by
tions in the ability of a State to report
adding admissions and subtracting
certain variables (such as sentence
length and minimum time to be served) releases from the 1989 and 1995
yearend jurisdiction estimates.
and in definitions used by participating
jurisdictions are reported in the
The admission rate was calculated by
explanatory notes.
dividing all admissions during the year
by the yearend population of the
NCRP participating States
preceding year. The rate of release
was calculated by dividing the number
The number of jurisdictions reporting
of inmates released during the year by
data varies from year to year. In 1996
admissions and releases were reported the number in prison at the beginning
of the year plus the number admitted
by the following 37 States and the
during the year.
California Youth Authority: Alabama,
Arkansas, California, Colorado, Florida,
Truth-in-sentencing reform
Georgia, Hawaii, Illinois, Iowa,
Kentucky, Louisiana, Maine, Maryland,
BJS contacted each State for verificaMichigan, Minnesota, Mississippi,
tion of all truth-in-sentencing State-level
Missouri, Nebraska, Nevada, New
references in this report. Truth-inHampshire, New Jersey, New York,
sentencing laws vary from State to
North Carolina, North Dakota, Ohio,
State on effective date, offenses
Oklahoma, Oregon, Pennsylvania,
covered by the law, and percent of
South Carolina, South Dakota,
sentence required to be served prior
Tennessee, Texas, Utah, Virginia,
to release, among other requirements.
Washington, West Virginia, and
The Violent Offender Incarceration and
Wisconsin. Except for Florida and
Truth in Sentencing Incentive grants
Maine, these States and Massachuprogram provided State-validated
setts also reported in 1990.
sentence length and time served data.

All 50 States reported data on admissions and releases with a common
definition of Part 1 violent offenses.
Weighted averages were used to
calculate the average sentence, time
served, and percent of sentence served
from State-level VOI/TIS data. A
weighted average for time served is
calculated by multiplying the mean time
served for each State by the number of
releases in the State. The results were
summed and divided by the total
number of releases.
Definition of terms

New court commitments — persons
entering prison directly from a sentence
by a court and not from an unsuccessful period of community supervision
(parole). Includes new court admissions, probation revocations, and
admissions after the imposition of a
suspended sentence.
Violent offenses — Crimes involving
personal injury, threat of injury and theft
of property or attempted theft by force
or threat of force. Includes murder,
manslaughter, rape, other sexual
assault, robbery, assault, extortion,
intimidation, criminal endangerment,
child abuse, and other offenses involving confrontation, force, or threat of
force.
Maximum sentence length — the
sentence for the most serious offense,
as determined by the offense with the
longest sentence. Whenever a
sentence had both a minimum and a
maximum term, the maximum was
used to define the sentence length.
Total sentence length — the longest
time that an offender could be required
to serve for all offenses.
Minimum time to be served — the jurisdiction’s estimate of the shortest time
that each admitted prisoner must serve
before becoming eligible for release.
Factors used in this estimate include
minimum sentence length, good-time
credits, earned-time credits, parole
eligibility requirements, and early
release requirements and allowances.

References
Association of Paroling Authorities, International. 1997 Parole Board Survey. St.
Louis, Missouri: APAI Publications, May 1998.
Blumstein, Alfred, and Allen J. Beck. “Factors Contributing to the Growth in U.S. Prison
Populations,” in Crime and Justice: A Review of Research on Corrections, Michael
Tonry and Joan Petersilia, eds. Chicago, Illinois: University of Chicago Press, forthcoming (1999).
Beck, Allen J., and Lawrence Greenfeld. Violent Offenders in State Prison: Sentences
and Time Served. BJS Selected Findings, NCJ 154632, July 1995.
Bureau of Justice Assistance. 1996 National Survey of State Sentencing Structures.
Washington, D.C.: NCJ 169270, September 1998.

The National Assessment of Structured Sentencing.
Washington, D.C.: NCJ 153853, February 1996.
Corrections Program Office, Office of Justice Programs. Violent Offenders and TruthIn-Sentencing Incentive Grants: Program Guidance and Application Kit. FY98.
Washington, D.C.: U.S. Department of Justice, 1998.
Gilliard, Darrell, and Allen J. Beck. Prisoners in 1997. BJS Bulletin,
NCJ 170014, August 1998.
General Accounting Office. Truth in Sentencing: Availability of Federal Grants Influenced Laws in Some States. Washington, D.C.: U.S. Congress, GAO/GGD-98-42,
February 1998.
National Center for State Courts. Sentencing Digest, Examining Current Sentencing
Issues and Policies. Williamsburg, Virginia: NCSC Publications, Number R-204, 1998.
National Institute of Corrections. State Legislative Actions on Truth in Sentencing.
Washington, D.C.: U.S. Department of Justice, NCJ 157895, May 1995.
Tonry, Michael, ed. Crime and Justice, A Review of Research. Chicago, Illinois:
University of Chicago Press, 1992.
Wicharay, Tamasak. Simple Theory, Hard Reality: The Impact of Sentencing Reforms
on Courts, Prisons, and Crime. New York: State University of New York Press, 1995.

Life sentence — any prison sentence
with a fixed or maximum term of life in
prison, regardless of the possibility of
parole.
First release from prison — anyone
released for the first time on the current
sentence. Excluded from first releases
from prison are persons who had previously been conditionally released from
prison for the same offense and then
were returned to prison for violating the
conditions of that release.
Subsequent release from prison —
persons released from prison after
having been admitted to prison for a
violation of parole or other conditional
release.

Conditional release — anyone released
from prison into community supervision
with a set of conditions for remaining
on parole, which, if violated, can cause
the person to be returned to prison.
This subsequent incarceration can be
for any of the remaining portion of the
sentence the inmate may have on the
current offense.
Unconditional release — anyone
released from any further correctional
supervision who cannot be returned to
prison for any remaining portion of the
sentence for the current offense.
Total time served — calculated by
adding the average time spent in prison
and the average time spent in jail.

Truth in Sentencing in State Prisons 15

The Bureau of Justice Statistics is the
statistical agency of the U.S. Department of Justice. Jan M. Chaiken,
Ph.D., is director.
BJS Special Reports address a
specific topic in depth from one or
more datasets that cover many topics.
Doris James Wilson and Paula M.
Ditton wrote this report under the
supervision of Allen J. Beck, Ph.D.
Tom Bonczar provided statistical
review. Tom Hester edited the report,
assisted by Tina Dorsey. Marilyn
Marbrook, assisted by Yvonne Boston
and Jayne Robinson, prepared the
report for publication.

16 Truth in Sentencing in State Prisons

Tammy Anderson, Elizabeth K. Griffin,
Marc Roemer, and Laarni Verdolin,
Demographic Surveys Division, U.S.
Bureau of the Census, carried out
data collection and processing under
the supervision of Kathleen P. Creighton and Gertrude B. Odom. Ruth
Breads and Dave Pysh under the
supervision of Stephen T. Phillips
provided programming assistance for
data processing. These affiliations
date to the time of the data collection.
January 1999, NCJ 170032

This report in portable document
format and in ASCII, its tables, and
related statistical data are available at
the BJS World Wide Web site:
http://www.ojp.usdoj.gov/bjs/
The data from the National Corrections Reporting Program, 1996 can
be obtained from the National Archive
of Criminal Justice Data at the
University of Michigan, 1-800-9990960. The archive can also be
accessed through the BJS web site.
When at the archive site, search for
data set ICPSR 2017.