
U.S. Department of Justice Special Report: Sexual Victimization Reported by Adult Correctional Authorities, 2012-15, 2018
Download original document:
Document text
Document text
This text is machine-read, and may contain errors. Check the original document to verify accuracy.
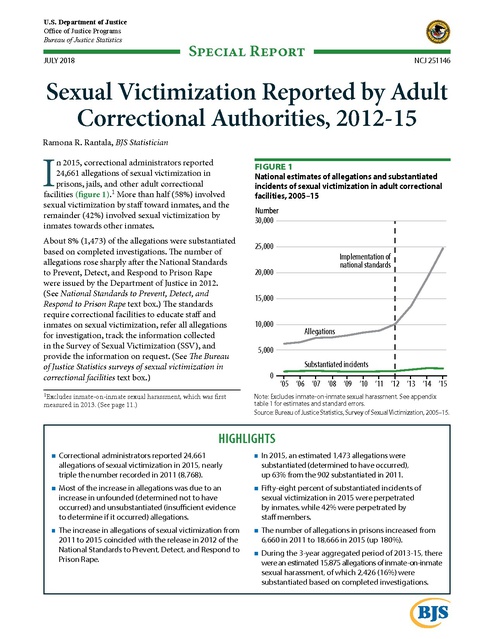
U.S. Department of Justice Office of Justice Programs Bureau of Justice Statistics JULY 2018 Special Report NCJ 251146 Sexual Victimization Reported by Adult Correctional Authorities, 2012-15 Ramona R. Rantala, BJS Statistician I n 2015, correctional administrators reported 24,661 allegations of sexual victimization in prisons, jails, and other adult correctional facilities (fgure 1).1 More than half (58%) involved sexual victimization by staf toward inmates, and the remainder (42%) involved sexual victimization by inmates towards other inmates. About 8% (1,473) of the allegations were substantiated based on completed investigations. Te number of allegations rose sharply afer the National Standards to Prevent, Detect, and Respond to Prison Rape were issued by the Department of Justice in 2012. (See National Standards to Prevent, Detect, and Respond to Prison Rape text box.) Te standards require correctional facilities to educate staf and inmates on sexual victimization, refer all allegations for investigation, track the information collected in the Survey of Sexual Victimization (SSV), and provide the information on request. (See Te Bureau of Justice Statistics surveys of sexual victimization in correctional facilities text box.) 1Excludes inmate-on-inmate sexual harassment, which was frst measured in 2013. (See page 11.) FIGURE 1 National estimates of allegations and substantiated incidents of sexual victimization in adult correctional facilities, 2005–15 Number 30,000 25,000 Implementation of national standards 20,000 15,000 10,000 Allegations 5,000 Substantiated incidents 0 ’05 ’06 ’07 ’08 ’09 ’10 ’11 ’12 ’13 ’14 ’15 Note: Excludes inmate-on-inmate sexual harassment. See appendix table 1 for estimates and standard errors. Source: Bureau of Justice Statistics, Survey of Sexual Victimization, 2005–15. HIGHLIGHTS Correctional administrators reported 24,661 allegations of sexual victimization in 2015, nearly triple the number recorded in 2011 (8,768). In 2015, an estimated 1,473 allegations were substantiated (determined to have occurred), up 63% from the 902 substantiated in 2011. Most of the increase in allegations was due to an increase in unfounded (determined not to have occurred) and unsubstantiated (insufcient evidence to determine if it occurred) allegations. Fifty-eight percent of substantiated incidents of sexual victimization in 2015 were perpetrated by inmates, while 42% were perpetrated by staf members. The increase in allegations of sexual victimization from 2011 to 2015 coincided with the release in 2012 of the National Standards to Prevent, Detect, and Respond to Prison Rape. The number of allegations in prisons increased from 6,660 in 2011 to 18,666 in 2015 (up 180%). During the 3-year aggregated period of 2013-15, there were an estimated 15,875 allegations of inmate-on-inmate sexual harassment, of which 2,426 (16%) were substantiated based on completed investigations. Defnitions The Bureau of Justice Statistics uses uniform defnitions for each sexual act and investigative outcome. Each sexual act is classifed by the perpetrator (i.e., inmate or staf ) and the type of act. In 2013, BJS modifed the survey to align the defnitions with the national standards. BJS began collecting data on inmate-on-inmate sexual harassment in 2013. Inmate-on-inmate sexual victimization involves nonconsensual sexual acts or abusive contact with a victim without his or her consent or with a victim who cannot consent or refuse. Nonconsensual sexual acts are the most serious victimizations and include— | contact between the penis and the vulva or the penis and the anus including penetration, however slight | contact between the mouth and the penis, vulva, or anus | penetration of the anal or genital opening of another person, however slight, by a hand, fnger, object, or other instrument. Staf-on-inmate sexual victimization includes sexual misconduct or sexual harassment perpetrated on an inmate by staf. Staf includes an employee, volunteer, contractor, ofcial visitor, or other agency representative. Family, friends, and other visitors are excluded. Abusive sexual contact is less serious and includes intentional touching, either directly or through the clothing, of the genitalia, anus, groin, breast, inner thigh, or buttocks of any person. Incidents in which the contact was incidental to a physical altercation are excluded. Substantiated allegation means the event was investigated and determined to have occurred, based on a preponderance of the evidence (28 C.F.R. §115.72). Unfounded allegation means the investigation determined that the event did not occur. Unsubstantiated allegation means the investigation concluded that evidence was insufcient to determine whether or not the event occurred. Staf sexual misconduct includes any consensual or nonconsensual behavior or act of a sexual nature directed toward an inmate by staf, including romantic relationships. Such acts include— | intentional touching, either directly or through the clothing, of the genitalia, anus, groin, breast, inner thigh, or buttocks that is unrelated to ofcial duties or with the intent to abuse, arouse, or gratify sexual desire | completed, attempted, threatened, or requested sexual acts | occurrences of indecent exposure, invasion of privacy, or staf voyeurism for reasons unrelated to ofcial duties or for sexual gratifcation. Staf sexual harassment includes repeated verbal comments or gestures of a sexual nature to an inmate by staf. Such statements include— | demeaning references to an inmate’s gender or sexually suggestive or derogatory comments about his or her body or clothing | repeated profane or obscene language or gestures. SEXUAL VICTIMIZATION REPORTED BY ADULT CORRECTIONAL AUTHORITIES, 2012-15 | JULY 2018 2 Te SSV (formerly the Survey of Sexual Violence) is an annual collection conducted by the Bureau of Justice Statistics (BJS) since 2004, and is based on the ofcial administrative records of correctional systems and facilities. Te SSV helps BJS to meet its mandates under the Prison Rape Elimination Act of 2003 (PREA). data were collected from facilities holding 1.96 million inmates in 2012, 1.97 million inmates in 2013, 1.93 million inmates in 2014, and 1.92 million inmates in 2015. (See Methodology for more information about sampling procedures, systems and facilities from which data were collected, and standard errors.) Te surveys include all federal and state prisons, all facilities operated by the U.S. military and ICE, and a representative sample of jail jurisdictions, privately operated jails and prisons, and jails holding adults in Indian country. Responses are weighted to provide national estimates for jails and privately operated facilities. Because the estimates for jails and private facilities are based on a sample rather than a complete enumeration, they are subject to sampling error. Standard errors are provided in the appendix. In total, Administrators provided annual counts for each type of victimization that was alleged or frst discovered during the prior calendar year. Tey also indicated how many were substantiated or determined to have occurred; unfounded or determined not to have occurred; unsubstantiated or had insufcient evidence to make a fnal determination; or under investigation at the time of data collection. In addition to requiring all allegations to be investigated, the national standards include criteria for substantiating incidents based on a preponderance of the evidence. National Standards to Prevent, Detect, and Respond to Prison Rape The Prison Rape Elimination Act of 2003 (PREA) includes a requirement to develop national standards.2 Following the process outlined in PREA, the Department of Justice published the National Standards to Prevent, Detect, and Respond to Prison Rape (28 C.F.R. §115) on June 20, 2012. The national standards were efective immediately for the Federal Bureau of Prisons (BOP) and outlined a 3-year phase-in period for audits. The standards address numerous issues, practices, and requirements to prevent, detect, and respond to sexual abuse in confnement settings. The standards include defnitions of terms related to sexual abuse (§115.6), prevention planning (§115.11-18), responsive planning (§115.11-22), training and education of staf and inmates (§115.31-35), reporting allegations (§115.51-54), investigation of allegations (§115.71-73), data collection via the Survey of Sexual Violence (SSV, §115.87), and audits (§115.93 and §115.401-405).3 In 2013, the SSV was renamed the Survey of Sexual Victimization and was updated to better refect the national standards. Defnitions were modifed for each type of victimization and investigative outcome. Questions about inmate-on-inmate sexual harassment were added. Changes to the substantiated incident forms included asking whether the incident 2Prison Rape Elimination Act of 2003, P.L. 108-79 §§ 7-8. Retrieved from www.gpo.gov/fdsys/pkg/PLAW-108publ79/pdf/ PLAW-108publ79.pdf 3Prison and Jail Standards, 28 C.F.R. Part 115. Retrieved from www.prearesourcecenter.org/sites/default/fles/library/ prisonsandjailsfnalstandards.pdf location was subject to video monitoring, expanding victim and inmate perpetrator demographic characteristics to include transgender and intersex, and expanding answer categories to capture common written responses. When the standards were published, it was anticipated that the number of allegations might increase and that such an increase— might refect increased abuse, or it might just refect inmates’ increased willingness to report abuse, due to the facility’s success at assuring inmates that reporting will yield positive outcomes and not result in retaliation. Likewise, an increase in substantiated incidents could mean either that a facility is failing to protect inmates, or else simply that it has improved its efectiveness at investigating allegations.4 To provide administrators more time to conduct investigations, SSV data are collected after the reference year has ended. For example, 2012 data were collected from July to December 2013, after the standards came into efect for the BOP and during the implementation period for other facilities. Audits can also afect the numbers reported via SSV. For example, audits may reveal a miscategorization of type of victimization, and a facility may revise numbers previously reported to the Bureau of Justice Statistics. 4National Standards to Prevent, Detect, and Respond to Prison Rape, 77 Fed. Reg. 37107 (June 20, 2012) 28 C.F.R. Part 115. Retrieved from www.gpo.gov/fdsys/pkg/FR-2012-06-20/ pdf/2012-12427.pdf SEXUAL VICTIMIZATION REPORTED BY ADULT CORRECTIONAL AUTHORITIES, 2012-15 | JULY 2018 3 Each sexual victimization is classifed by the type of perpetrator (i.e., inmate or staf) and act, which is defned by BJS in conjunction with the national standards. Inmate-on-inmate sexual victimization includes nonconsensual sexual acts, abusive sexual contact, and sexual harassment (as of 2013). Staf-on-inmate sexual victimization includes sexual misconduct and sexual harassment. FIGURE 2 National estimates of outcomes of alleged sexual victimization in adult correctional facilities, 2010–15 Number 12,000 10,000 Allegations of sexual victimization 8,000 Allegations of sexual victimization increased in both prisons and jails 6,000 Afer the national standards were issued in 2012, the number of allegations of sexual victimization that were substantiated increased for 2 years, then leveled of. Te number of allegations that were unfounded (determined not to have occurred) and unsubstantiated (insufcient evidence to determine if it occurred) rose sharply. Of the 24,661 allegations of sexual victimization in 2015, a total of 1,473 (6%) were substantiated and 2,733 (11%) were under investigation during data collection (fgure 2). Prior to 2014, more allegations were unsubstantiated than were unfounded. In 2014, for the frst time in 11 years of collecting SSV data, allegations that were unfounded (8,372) exceeded those that were unsubstantiated (7,783). In 2015, the number of unfounded allegations (10,142) was nearly equal to the number of unsubstantiated allegations (10,313). Implementation of national standards Unfounded Unsubstantiated 4,000 Under investigation 2,000 Substantiated 0 2010 2011 2012 2013 2014 2015 Note: Excludes inmate-on-inmate sexual harassment. See appendix table 2 for estimates and standard errors. Source: Bureau of Justice Statistics, Survey of Sexual Victimization, 2010–15. Te Bureau of Justice Statistics surveys of sexual victimization in correctional facilities Section 4(a)(1) of the Prison Rape Elimination Act of 2003 (PREA) requires the Bureau of Justice Statistics to “carry out, for each calendar year, a comprehensive statistical review and analysis of the incidence and efects of prison rape” (P.L. 108-79). BJS has developed a multiple-measure, multiple-mode data collection strategy to fully implement requirements under PREA, including three surveys relating to inmate sexual victimization. The Survey of Sexual Victimization annually collects administrative data on the incidence of sexual victimization in adult and juvenile correctional facilities. The National Inmate Survey and the National Survey of Youth in Custody gather data on the prevalence of sexual assault as reported by inmates in prisons and jails and by youth held in juvenile correctional facilities. (For more information on BJS's PREA data collection activities, see the BJS website.) SEXUAL VICTIMIZATION REPORTED BY ADULT CORRECTIONAL AUTHORITIES, 2012-15 | JULY 2018 4 Correctional administrators reported 24,661 allegations of sexual victimization in 2015, an increase from the 18,891 allegations reported in 2014 (table 1). Te total allegations in 2015 were nearly triple the number reported in 2011 (8,768 allegations), the year before the national standards were implemented. Te standards specifed not only what data must be tracked and reported to BJS, but also required inmate education, medical and mental health care for victims, and investigations of each allegation, all of which may have encouraged victims and increased their willingness to report sexual abuse. Increases between 2011 and 2015 occurred for all types of correctional facilities. Te number of allegations in prisons increased from 6,660 allegations in 2011 to 18,666 in 2015 (up 180%). Te number of allegations in jails increased from 2,047 in 2011 to 5,809 in 2015 (up 184%). TABLE 1 National estimates of allegations of sexual victimization, by type of facility, 2005 and 2010–15 Type of facility Total Prisonsa Public - federal Public - state Jailsc Other adult facilities Military Immigration and Customs Enforcement Indian country jailsd 2015* 24,661 18,666 740 16,940 5,809 2014 18,891 † 13,794 † 776 † 12,186 † 4,905 † 2013 13,568 † 9,850 † 879 † 8,394 † 3,577 † 2012 10,047 † 7,575 † 718 † 6,433 † 2,411 † 2011 8,768 † 6,660 † 488 † 5,765 † 2,047 † 2010 8,404 † 6,648 † 479 † 5,812 † 1,700 † 2005 6,241 † 4,791 † 268b 4,341 † 1,406 † 35 151 0 37 † 148 † 7† 16 † 125 † 0 7† 54 † 0 4† 50 † ^ 6† 46 † ^ 8† 4† 32 † Note: Excludes inmate-on-inmate sexual harassment. See appendix table 3 for standard errors. *Comparison year. †Diference with comparison year is signifcant at the 95% confdence level. Federal prisons, state prisons, military facilities and ICE facilities are complete enumerations rather than a sample, so any diference with comparison year is signifcant. See footnote b for one exception. ^Too few cases to provide a reliable estimate. aIncludes federal, state, and private prisons. bEstimates for federal prisons in 2005 are not comparable to those for other years due to a change in reporting. cIncludes local and private jails. dExcludes facilities housing only juveniles. Source: Bureau of Justice Statistics, Survey of Sexual Victimization, 2005 and 2010–15. SEXUAL VICTIMIZATION REPORTED BY ADULT CORRECTIONAL AUTHORITIES, 2012-15 | JULY 2018 5 Te overall rate of reported allegations nearly tripled during the same period, from 3.9 allegations per 1,000 inmates in 2011 to 11.0 per 1,000 in 2015 (table 2). Allegation rates increased for all types of facilities. Rates for prisons rose from 4.5 allegations per 1,000 inmates in 2011 to 12.6 per 1,000 in 2015. Jails consistently had lower rates than prisons, rising from 2.7 allegations per 1,000 inmates in 2011 to 8.0 in 2015. FIGURE 3 National estimates of allegations of sexual victimization in adult correctional facilities, by type of victimization, 2010–15 Number 10,000 Implementation of national standards Staf-on-inmate victimization accounted for 63% of the increase in allegations from 2011 to 2015 8,000 Afer implementation of the national standards, allegations of staf-on-inmate sexual misconduct increased from 2,800 in 2011 to 8,151 in 2015 (up 191%) (fgure 3). Allegations of staf-on-inmate sexual victimization increased more than inmate-on-inmate victimization, accounting for 63% of the total increase. During the same period, inmate-on-inmate nonconsensual sexual acts accounted for the smallest relative increase (up 101%), from 2,986 to 5,992. 6,000 4,000 Sta˜ sexual misconduct Nonconsensual sexual acts Abusive sexual contact 2,000 0 Sta˜ sexual harassment 2010 2011 2012 2013 2014 2015 Note: Excludes inmate-on-inmate sexual harassment. See appendix table 5 for estimates and standard errors. Source: Bureau of Justice Statistics, Survey of Sexual Victimization, 2010–15. TABLE 2 Rates per 1,000 inmates of allegations of sexual victimization, by type of facility, 2005 and 2010–15 Type of facility Total Prisonsa Public - federal Public - state Jailsc Other adult facilities Military Immigration and Customs Enforcement Indian country jailsd 2015* 11.04 12.58 4.61 14.63 8.03 2014 8.37 † 9.28 † 4.58 † 10.35 † 6.56 † 2013 5.95 † 6.55 † 5.06 † 7.13 † 4.73 † 2012 4.49 † 5.16 † 4.07 † 5.50 † 3.22 † 2011 3.90 † 4.49 † 2.77 † 4.81 † 2.73 † 2010 3.65 † 4.40 † 2.77 † 4.74 † 2.20 † 2005 2.83 † 3.33 † 1.71b 3.68 † 1.86 † 25.17 8.12 0.00 26.81 † 8.14 † 2.35 † 11.40 † 7.22 † 0.00 4.96 † 2.92 † 0.00 2.63 † 3.41 † ^ 3.95 † 2.67 † ^ 3.08 † 0.61 † ^ Note: Excludes inmate-on-inmate sexual harassment. See appendix table 4 for standard errors. *Comparison year. †Diference with comparison year is signifcant at the 95% confdence level. Federal prisons, state prisons, military facilities and ICE facilities are complete enumerations rather than a sample, so any diference with comparison year is signifcant. See footnote b for one exception. ^Too few cases to provide a reliable estimate. aIncludes federal, state, and private prisons. bEstimates for federal prisons in 2005 are not comparable to those for other years due to a change in reporting. cIncludes local and private jails. dExcludes facilities housing only juveniles. Source: Bureau of Justice Statistics, Survey of Sexual Victimization, 2005 and 2010–15. SEXUAL VICTIMIZATION REPORTED BY ADULT CORRECTIONAL AUTHORITIES, 2012-15 | JULY 2018 6 Outcomes of sexual victimization investigations Overall, 8% of completed investigations were substantiated from 2012-15 During the 4-year aggregated period of 2012-15, investigations were completed for 61,316 (91%) of the 67,168 total allegations (table 3). For inmate-on-inmate sexual victimization, investigations were completed for 28,507 of the 30,590 allegations (93%), and for staf-on-inmate victimization, investigations were completed for 32,809 of the 36,578 allegations (90%) during the 4-year period. Overall, 5,187 (8%) of completed investigations were substantiated. TABLE 3 National estimates of outcomes of investigations into allegations of sexual victimization, by type of facility, 2012–15 Type of victimization and outcome Inmate-on-inmate Substantiated Unsubstantiated Unfounded Under investigation Nonconsensual sexual acts Substantiated Unsubstantiated Unfounded Under investigation Abusive sexual contact Substantiated Unsubstantiated Unfounded Under investigation Staf-on-inmate Substantiated Unsubstantiated Unfounded Under investigation Sexual misconduct Substantiated Unsubstantiated Unfounded Under investigation Sexual harassment Substantiated Unsubstantiated Unfounded Under investigation Total All facilities* 30,590 2,982 14,596 10,928 2,076 18,235 1,137 8,333 7,142 1,620 12,356 1,845 6,263 3,786 456 36,578 2,205 14,746 15,858 3,771 22,268 1,678 8,076 10,040 2,477 14,310 527 6,671 5,819 1,294 67,168 Number of allegations Federal and state prisons 19,202 1,523 9,696 6,397 1,587 11,298 631 5,288 4,100 1,280 7,904 892 4,408 2,297 307 27,864 1,419 11,667 11,474 3,305 16,244 1,078 6,129 6,950 2,088 11,620 341 5,538 4,524 1,217 47,066 Local jails 9,586 1,282 3,908 3,998 388 5,938 461 2,494 2,702 277 3,648 822 1,414 1,296 111 6,585 598 1,997 3,636 354 4,574 446 1,265 2,562 301 2,011 152 731 1,074 53 16,171 Note: Excludes inmate-on-inmate sexual harassment, which BJS began collecting in 2013. Detail may not sum to total due to discrepancies in reporting. See appendix table 6 for standard errors. *Includes private prisons and jails, jails in Indian country, and facilities operated by the U.S. military and Immigration and Customs Enforcement. Source: Bureau of Justice Statistics, Survey of Sexual Victimization, 2012–15. SEXUAL VICTIMIZATION REPORTED BY ADULT CORRECTIONAL AUTHORITIES, 2012-15 | JULY 2018 7 During the 4-year aggregated period of 2012-15, investigations were completed for 16,612 of the 18,235 allegations (91%) of inmate-on-inmate nonconsensual sexual acts. Fewer than 1 in 10 (7%) or 1,137 of these completed investigations were substantiated. More than 4 in 10 (43%) completed investigations of nonconsensual sexual acts were unfounded, and half (50%) were unsubstantiated (table 4). More than half (53%) of the completed investigations of inmate-to-inmate abusive sexual contact were unsubstantiated. An estimated 16% of the completed investigations were substantiated, and 32% were unfounded. In local jails, 23% of the completed investigations were substantiated, 37% were unfounded, and 40% were unsubstantiated. In state and federal prisons, 12% of completed investigations were substantiated, 30% were unfounded, and 58% were unsubstantiated. Fewer than 1 in 20 (4%) completed investigations of staf sexual harassment were substantiated. Fewer than 1 in 10 (8%) of the completed investigations of staf sexual misconduct were substantiated. TABLE 4 Outcomes of completed investigations of sexual victimization, by type of facility, 2012–15 All facilitiesb Percent by outcomea Federal and state prisons* 100% 8.6% 55.0% 36.3% 17,616 100% 6.3% 52.8% 40.9% 10,019 Type of victimization and outcome Inmate-on-inmate Substantiated Unsubstantiated Unfounded Number of completed investigations Nonconsensual sexual acts Substantiated Unsubstantiated Unfounded Number of completed investigations 100% 10.5% 51.2% 38.3% 28,507 100% 6.8% 50.2% 43.0% 16,612 Local jails 100% 14.0% † 42.5% † 43.5% † 9,189 100% 8.1% † 44.1% † 47.8% † 5,657 Abusive sexual contact Substantiated Unsubstantiated Unfounded Number of completed investigations 100% 15.5% 52.7% 31.8% 11,895 100% 11.7% 58.0% 30.2% 7,597 100% 23.3% † 40.0% † 36.7% † 3,532 Staf-on-inmate Substantiated Unsubstantiated Unfounded Number of completed investigations 100% 6.7% 44.9% 48.3% 32,809 100% 5.8% 47.5% 46.7% 24,560 100% 9.6% † 32.0% † 58.4% † 6,230 Sexual misconduct Substantiated Unsubstantiated Unfounded Number of completed investigations 100% 8.5% 40.8% 50.7% 19,794 100% 7.6% 43.3% 49.1% 14,157 100% 10.4% † 29.6% † 60.0% † 4,273 Sexual harassment Substantiated Unsubstantiated Unfounded Number of completed investigations 100% 4.0% 51.3% 44.7% 13,016 100% 3.3% 53.2% 43.5% 10,403 100% 7.8% † 37.4% † 54.9% † 1,957 Note: Detail may not sum to 100% due to rounding. See appendix table 7 for standard errors. *Comparison group. †Diference with comparison group is signifcant at the 95% confdence level. aPercentages based on allegations for which investigations have been completed. bIncludes private prisons and jails, jails in Indian country, and facilities operated by the U.S. military and Immigration and Customs Enforcement. Source: Bureau of Justice Statistics, Survey of Sexual Victimization, 2005 and 2010–15. SEXUAL VICTIMIZATION REPORTED BY ADULT CORRECTIONAL AUTHORITIES, 2012-15 | JULY 2018 8 The annual number of substantiated incidents of sexual victimization increased by 63% from 2011 to 2015 Correctional administrators reported 1,473 substantiated incidents of sexual victimization in 2015 (table 5). Although this was fewer than the 1,522 substantiated incidents reported in 2014, it was more than the number reported in all other years and represented a 63% increase from the 902 incidents substantiated in 2011. Jails saw a greater percentage increase than prisons. Te number of substantiated incidents in jails doubled from 284 in 2011 to 576 in 2015 (up 103%). In comparison, the number of substantiated incidents in prisons rose from 605 to 873 (up 44%). Rates of substantiated incidents of sexual victimization showed minimal year-to-year changes until one year afer the standards were issued in 2012 (table 6). Rates of substantiated incidents in jails doubled from 0.4 per 1,000 inmates in 2011 to 0.8 per 1,000 in 2015. TABLE 5 National estimates of substantiated incidents of sexual victimization, by type of facility, 2005 and 2010–15 Type of facility Total Prisonsa Public - federal Public - state Jailsc Other adult facilities Military Immigration and Customs Enforcement Indian country jailsd 2015* 1,473 873 19 810 576 2014 1,522 888 13 † 771 † 616 2013 1,239 † 782 † 13 † 704 † 441 † 2012 953 † 656 † 24 † 588 † 292 † 2011 902 † 605 † 9† 537 † 284 † 2010 856 † 603 † 16 † 541 † 244 † 2005 885 † 524 † 41b 459 † 348 † 3 21 0 3 15 † ^ 1† 15 † 0 1† 5† 0 2† 5† ^ 2† 2† ^ 2† 1† ^ Note: Excludes inmate-on-inmate sexual harassment. Detail may not sum to total due to rounding. See appendix table 8 for standard errors. *Comparison year. †Diference with comparison year is signifcant at the 95% confdence level. Federal prisons, state prisons, military facilities and ICE facilities are complete enumerations rather than a sample, so any diference with comparison year is signifcant. See footnote b for one exception. ^Too few cases to provide a reliable estimate. aIncludes federal, state, and private prisons. bEstimates for federal prisons in 2005 are not comparable to those for other years due to a change in reporting. cIncludes local and private jails. dExcludes facilities housing only juveniles. Source: Bureau of Justice Statistics, Survey of Sexual Victimization, 2005 and 2010–15. TABLE 6 Rates per 1,000 inmates of substantiated incidents of sexual victimization, by type of facility, 2005 and 2010–15 Type of facility Total Prisonsa Public - federal Public - state Jailsc Other adult facilities Military Immigration and Customs Enforcement Indian country jailsd 2015* 0.66 0.59 0.12 0.70 0.80 2014 0.67 0.60 0.08 † 0.65 † 0.82 2013 0.54 † 0.52 † 0.07 † 0.60 † 0.58 † 2012 0.43 † 0.45 † 0.14 † 0.50 † 0.39 † 2011 0.40 † 0.41 † 0.05 † 0.45 † 0.38 † 2010 0.37 † 0.40 † 0.09 † 0.44 † 0.32 † 2005 0.40 † 0.36 † 0.26b 0.39 † 0.46 † 2.16 1.13 0.00 2.17 0.83 † ^ 0.71 † 0.87 † 0.00 0.71 † 0.27 † 0.00 1.31 † 0.34 † ^ 1.32 † 0.12 † ^ 0.77 † 0.15 † ^ Note: Excludes inmate-on-inmate sexual harassment. See appendix table 9 for standard errors. *Comparison year. †Diference with comparison year is signifcant at the 95% confdence level. Federal prisons, state prisons, military facilities and ICE facilities are complete enumerations rather than a sample, so any diference with comparison year is signifcant. See footnote b for one exception. ^Too few cases to provide a reliable estimate. aIncludes federal, state, and private prisons. bEstimates for federal prisons in 2005 are not comparable to those for other years due to a change in reporting. cIncludes local and private jails. dExcludes facilities housing only juveniles. Source: Bureau of Justice Statistics, Survey of Sexual Victimization, 2005 and 2010–15. SEXUAL VICTIMIZATION REPORTED BY ADULT CORRECTIONAL AUTHORITIES, 2012-15 | JULY 2018 9 From 2014 to 2015, the number of substantiated incidents did not change signifcantly From 2011 to 2015, the overall number of substantiated incidents increased from 902 to 1,473 (table 7). Te number of substantiated incidents decreased from 1,522 in 2014 to 1,473 in 2015, but the change was not statistically signifcant. Inmate-on-inmate sexual victimizations made up more than half (58%) of the incidents that were substantiated in 2015. Inmate-on-inmate abusive sexual contact more than doubled, from 250 substantiated incidents in 2011 to 557 in 2015, which was the largest increase in substantiated incidents. Substantiated incidents of staf sexual misconduct increased from 327 in 2011 to 467 in 2015. Each year from 2010 to 2012, staf sexual misconduct had the largest number of substantiated incidents; however, from 2013 to 2015, the number of substantiated incidents of inmate-on-inmate abusive sexual contact exceeded substantiated incidents of staf sexual misconduct. TABLE 7 National estimates of substantiated incidents of sexual victimization, by type of victimization, 2005 and 2010–15 Type of victimization Total Inmate-on-inmate Nonconsensual sexual acts Abusive sexual contact Staf-on-inmate Sexual misconduct Sexual harassment 2015* 1,473 852 295 557 621 467 154 2014 1,522 863 308 555 659 499 160 2013 1,239 † 756 293 464 † 482 † 359 † 123 † 2012 953 † 511 † 241 † 269 † 442 † 353 † 89 † 2011 902 † 473 † 224 † 250 † 429 † 327 † 102 † 2010 856 † 437 † 198 † 239 † 418 † 319 † 99 † 2005 885 † 499a 326 173 † 386a 338 † 48 † Note: Excludes inmate-on-inmate sexual harassment. Detail may not sum to total due to rounding. See appendix table 10 for standard errors. *Comparison year. †Diference with comparison year is signifcant at the 95% confdence level. aStandard errors are not available. Source: Bureau of Justice Statistics, Survey of Sexual Victimization, 2005 and 2010–15. SEXUAL VICTIMIZATION REPORTED BY ADULT CORRECTIONAL AUTHORITIES, 2012-15 | JULY 2018 10 Inmate-on-inmate sexual harassment Sexual harassment of one inmate by another was frst measured in the Survey of Sexual Victimization (SSV) in 2013. Inmate-on-inmate sexual harassment includes— repeated and unwelcome sexual advances requests for sexual favors verbal comments, gestures, or actions of a derogatory or ofensive sexual nature by one inmate directed toward another. During the 3-year aggregated period of 2013-15, an estimated 15,875 allegations of inmate-on-inmate sexual harassment were made (table 8). More than 10,000 of these allegations occurred in prisons and more than 5,000 occurred in jails. Overall, the rate of allegations of inmate-on-inmate sexual harassment was 2.2 per 1,000 inmates in prisons and 2.5 per 1,000 inmates in jails. During 2013-15, more than 2,400 allegations of inmate-on-inmate sexual harassment were substantiated. Approximately half (1,201) were in prisons and half (1,196) were in jails. Overall, the rate of substantiated incidents of inmate-on-inmate sexual harassment was 0.3 per 1,000 inmates in prisons and 0.5 per 1,000 inmates in jails. TABLE 8 National estimates of allegations, substantiated incidents, and rates per 1,000 of inmate-on-inmate sexual harassment, by type of facility, 2013–15 Type of facility Total Prisonsa Public - federal Public - state Jailsb Other adult facilities Military Immigration and Customs Enforcement Indian country jailsc Number 15,875 10,065 158 9,318 5,671 Allegations Rate per 1,000 2.34 2.25 0.31 2.65 2.55 19 110 10 4.55 2.03 0.73 Substantiated incidents Number Rate per 1,000 2,426 0.36 1,201 0.27 8 0.02 1,136 0.32 1,196 0.54 1 23 5 0.24 0.43 0.35 Note: Detail may not sum to total due to rounding. See appendix table 11 for standard errors. aIncludes federal, state, and private prisons. bIncludes local and private jails. cExcludes facilities housing only juveniles. Source: Bureau of Justice Statistics, Survey of Sexual Victimization, 2013–15. Continued on next page SEXUAL VICTIMIZATION REPORTED BY ADULT CORRECTIONAL AUTHORITIES, 2012-15 | JULY 2018 11 Inmate-on-inmate sexual harassment (continued) Of the estimated 15,875 allegations of inmate-on-inmate sexual harassment reported during the 3-year period, 2,426 were substantiated, 4,996 were unfounded, 7,979 were unsubstantiated, and 469 were still under investigation (table 9). Based on allegations with completed investigations, a sixth (16%) were substantiated, a third (32%) were unfounded, and more than half (52%) were unsubstantiated. Outcomes difered by type of facility. Among allegations with completed investigations in state and federal prisons (excluding those under private contract), 13% of allegations of inmate-on-inmate sexual harassment were substantiated and 55% were unsubstantiated. In local jails, 21% of completed investigations of inmate-on-inmate sexual harassment were substantiated and 44% were unsubstantiated. TABLE 9 National estimates of outcomes of investigations into allegations of inmate-on-inmate sexual harassment, by type of facility, 2013–15 Outcome Total Substantiated Unsubstantiated Unfounded Under investigation Number of allegations Federal and All facilitiesb state prisonsc Local jailsc 15,875 9,476 5,550 2,426 1,144 1,174 7,979 5,057 2,445 4,996 2,928 1,885 469 347 43 Percent by outcomea Federal and All facilitiesb state prisonsc Local jailsc 15.7% 51.8 32.4 12.5% 55.4 32.1 21.3% † 44.4 † 34.2 Note: Detail may not sum to total due to discrepancies in reporting. Detail may not sum to 100% due to rounding. See appendix table 12 for standard errors. *Comparison group. †Diference with comparison group is signifcant at the 95% confdence level. aPercentages based on allegations for which investigations have been completed. bIncludes private prisons and jails, jails in Indian country, and facilities operated by the U.S. military and Immigration and Customs Enforcement. cExcludes facilities under private contract. Source: Bureau of Justice Statistics, Survey of Sexual Victimization, 2013–15. SEXUAL VICTIMIZATION REPORTED BY ADULT CORRECTIONAL AUTHORITIES, 2012-15 | JULY 2018 12 Methodology Te Bureau of Justice Statistics (BJS) began the Survey of Sexual Violence (renamed the Survey of Sexual Victimization) in 2004. It is an annual collection mandated by the Prison Rape Elimination Act of 2003 (PREA) to measure the incidence of prison rape. Te survey is based on ofcial administrative records of correctional systems and facilities, and covers all federal prisons, state prisons, and facilities operated by the U.S. military and Immigration and Customs Enforcement, and a representative sample of local jails, jails in Indian country, and privately operated jails and prisons. Te U.S. Census Bureau currently serves as the data collection agent. Sampling Te sample designs for BJS's 2012, 2013, 2014, and 2015 Survey of Sexual Victimization (SSV, formerly Survey of Sexual Violence) varied for each type of facility covered by the Prison Rape Elimination Act of 2003. Federal and state prisons For each year, the survey included the Federal Bureau of Prisons and all 50 state adult prison systems. Prison administrators reported on allegations and substantiated incidents of sexual victimization that occurred within publicly operated adult prison facilities only, and excluded allegations and incidents involving federal or state inmates in other facilities, such as privately operated prisons or jails. Privately operated state and federal prisons For each year, a sample of 125 privately operated state and federal prison facilities was drawn from BJS’s Census of State and Federal Adult Correctional Facilities (CSFACF), which was updated annually to include new privately operated facilities and to exclude facilities that had closed or were no longer privately operated. For SSV 2012, the CSFACF 2005 was used as the sampling frame. Afer updating, the frame contained 402 records for privately operated state and federal prisons. Te number of inmates confned on June 30, 2005, was used as the measure of size. Facilities with 450 inmates or more on this date were selected with certainty (i.e., given a 100% chance of selection) due to size. Tere were 74 facilities selected with certainty in 2012. For SSV 2013, 2014, and 2015, the CSFACF 2012 was used as the sampling frame. Te number of inmates confned on December 31, 2012, was used as the measure of size. Facilities with 450 inmates or more on this date were selected with certainty due to size. For SSV 2013, there were 471 privately operated state and federal prisons in the frame, and 90 were selected with certainty. For SSV 2014, there were 458 privately operated state and federal prisons in the updated frame, and 82 were selected with certainty. For SSV 2015, there were 537 privately operated state and federal prisons in the updated frame. Te sample size was increased to 155, and 109 were selected with certainty. Te remaining facilities were sorted by region (Northeast, Midwest, South, or West), state, and size, then sampled systematically with probabilities proportional to their size. Tat is, larger facilities had a greater probability of selection. Fify-one private prisons were selected in the sample for SSV 2012, 35 were selected for SSV 2013, 43 were selected for SSV 2014, and 46 were selected for SSV 2015. Among the privately operated prisons selected for the 2012 survey, 13 closed prior to data collection and 2 were out of scope, meaning the facility was no longer privately operated and the data would be reported by the state or jail jurisdiction that was operating it. For the 2013 survey, 5 privately operated prisons closed prior to data collection and 4 were out of scope; for the 2014 survey, 4 closed and 4 were out of scope; and for the 2015 survey, 6 closed and 2 were out of scope. All active privately operated prisons selected for SSV 2013 responded to the survey. Two active privately operated prisons selected for SSV 2012, one selected for 2014, and fve selected for 2015 did not respond to the survey: Catalyst Behavioral Services Cameo, OK (2014) Delaney Hall, NJ (2015) Dismas Charities, El Paso, TX (2015) Dismas House of Atlanta West, GA (2015) San Luis Valley Community Center, CO (2012) Talbert House, Spring Grove Center, OH (2015) Terapeutic Community of Southern Colorado, CO (2015) Volunteers of America, Northwest Ohio, OH (2012). SEXUAL VICTIMIZATION REPORTED BY ADULT CORRECTIONAL AUTHORITIES, 2012-15 | JULY 2018 13 Public jails A sample of 700 publicly operated jail jurisdictions was drawn each year from BJS’s Deaths in Custody Reporting Program (DCRP) data. For each SSV data collection, the preceding year of DCRP was used as the sampling frame. For example, DCRP 2014 was used for SSV 2015. For SSV 2012, there were 2,844 jail jurisdictions on the frame. In 2013, there were 2,921; in 2014, there were 2,918; and in 2015, there were 2,904. Each year, the largest jail jurisdiction was selected with certainty in 45 states and the District of Columbia.5 Jail jurisdictions with average daily populations (ADP) greater than or equal to 1,000 inmates were also selected with certainty (116 for SSV 2012, 118 for 2013, 117 for 2014, and 111 for 2015). Te remaining jail jurisdictions on each frame were then grouped into three strata based on ADP, then sorted by region and state. For the SSV 2012 sample, 186 jail jurisdictions were selected from 1,481 jurisdictions with an ADP of 87 or less in the frst stratum, 119 from 770 jurisdictions with an ADP of 88 to 268 were selected in the second stratum, and 233 from 431 with an ADP of 269 to 999 were selected in the third stratum. For the SSV 2013 sample, 215 jail jurisdictions were selected from 1,456 jurisdictions with an ADP of 81 or less in the frst stratum, 108 from 830 jurisdictions with an ADP of 82 to 265 were selected in the second stratum, and 213 from 471 with an ADP of 266 to 999 were selected in the third stratum. For the SSV 2014 sample, 282 jail jurisdictions were selected from 1,513 jurisdictions with an ADP of 89 or less in the frst stratum, 85 from 792 jurisdictions with an ADP of 90 to 273 were selected in the second stratum, and 170 from 450 with an ADP of 274 to 999 were selected in the third stratum. For the SSV 2015 sample, 178 jail jurisdictions were selected from 1,452 jurisdictions with an ADP of 81 or less in the frst stratum, 195 from 834 jurisdictions with an ADP of 82 to 261 were selected in the second stratum, and 170 from 461 with an ADP of 262 to 999 were selected in the third stratum. 5Five states with combined jail/prison systems had no public jails: Connecticut, Delaware, Hawaii, Rhode Island, and Vermont. Among the public jail jurisdictions selected in the samples, one closed prior to the 2012 data collection and one closed prior to 2015. Tree active jail jurisdictions selected in the sample did not respond to the 2012 survey, three did not respond to the 2013 survey, four did not respond to the 2014 survey, and four did not respond to the 2015 survey: Clinton County Jail, KY (2015) Coahoma County Sherif ’s Ofce, MS (2012) Crittenden County Sherif ’s Ofce, AR (2013) Cumberland County Sherif ’s Ofce, ME (2013) Eau Claire County Sherif ’s Ofce, WI (2014) Harmon County Sherif ’s Ofce, OK (2014) Lawrence County Sherif ’s Ofce, MO (2012) Morgan County Sherif ’s Ofce, AL (2015) Pettis County Sherif ’s Ofce, MO (2015) Pierce County Detention and Corrections Center, WA (2013, 2014) Ponca City Police Department, OK (2014) Tate County Sherif ’s Ofce, MS (2015) Vigo County Sherif ’s Ofce, IN (2012). Privately operated jails For SSV 2012, a sample of 15 private jails was selected from the 33 in DCRP 2011. Five were selected with certainty because they were large compared to other private jails. Te remaining 10 were selected with probability proportional to size afer sorting the fle by region, state, and ADP. For SSV 2013, all 32 private jails on the DCRP 2012 were selected with certainty. For SSV 2014, all 29 private jails on the DCRP 2013 were selected with certainty. For SSV 2015, a sample of 15 private jails was selected from the 39 in DCRP 2014. Seven were selected with certainty due to size. Te remaining eight were selected with probability proportional to size afer sorting the fle by region, state, and ADP. Among the private jails selected for SSV 2012, one had closed prior to data collection. For SSV 2014, one closed prior to data collection and two were out of scope. During the 4 years, one active private jail selected in the sample did not respond to the survey: Bay County Jail Facility, FL (2013). SEXUAL VICTIMIZATION REPORTED BY ADULT CORRECTIONAL AUTHORITIES, 2012-15 | JULY 2018 14 Other correctional facilities Nonresponse adjustments A sample of jails in Indian country was selected each year using BJS’s Annual Survey of Jails in Indian Country from the previous year as the frame. Facilities that held only adults or adults and juveniles were eligible to be sampled for the adult SSV data collection. Facilities that held only juveniles were eligible for the juvenile SSV data collection. Survey responses were weighted to produce national estimates by type of correctional facility. Data from the Federal Bureau of Prisons and all state prison systems, U.S. military facilities, and dedicated ICE facilities were given a weight of 1.00 because they were all selected with certainty and had 100% survey participation. Each year, large jails were selected with certainty. Te measure of size was ADP, which was adjusted to one for jails whose average was less than one. For SSV 2012, a sample of 20 jails was selected from a total of 60 on the frame. Tree had an ADP of 140 or more and were selected with certainty. For SSV 2013, a sample of 20 jails was selected from a total of 59. Four had an ADP of 124 or more and were selected with certainty. For SSV 2014, a sample of 25 jails was selected from a total of 58. Eight had an ADP of 68 or more and were selected with certainty. For SSV 2015, a sample of 25 jails was selected from a total of 57. Seven had an ADP of 83 or more and were selected with certainty. Te remaining sample was selected using probability proportional to size for each survey year. All of the selected adult jails in Indian country were active. Two did not respond to SSV 2012, two did not respond to SSV 2013, and one did not respond to SSV 2014: Choctaw Justice Complex Adult Detention, MS (2012) Navajo Department of Corrections -Tuba City, AZ (2012) Tohono O’odham Adult Detention Center, AZ (2013, 2014) White Mountain Apache Detention Center, AZ (2013). A census of all military facilities operated by the U.S. Air Force, U.S. Army, U.S. Navy and the U.S. Marine Corps was taken. A second census of all facilities operated by or exclusively for Immigration and Customs Enforcement (ICE), that is, dedicated ICE facilities, was taken. Tis list was updated annually by ICE. Tere were 23 dedicated ICE facilities for the 2012 survey, 22 for the 2013 and 2014 surveys, and 24 for the 2015 survey. All active U.S. military facilities and dedicated ICE facilities participated in the survey each of the 4 years. Among public jails, private jails, Indian country jails, and private prisons, facilities were assigned an initial weight equal to the inverse of the probability of selection. In each survey year, weights for responding public jail jurisdictions were adjusted for nonresponse by multiplying initial weights by the ratio of the sum of initial weights of active jurisdictions in each stratum to the sum of weights for participating jurisdictions. As a result, the sum of the fnal weights in each stratum equaled the sum of weights for active jails in each stratum. Nonresponse adjustments for samples of private jails, private prisons, and jails in Indian country were based on the ratio of the sum of weights times the measure of size for each afected stratum. Within each stratum the number of active jails or prisons was multiplied by the measure of size of each facility, and then summed. Te ratio of the frst sum to the latter sum equaled the nonresponse adjustment factor for the afected stratum. Overall, afer adjusting for nonresponse and summing across all strata, multiplying the adjusted weight by the sum of the measure of size equaled the total number of inmates held in private jails, private prisons, and jails in Indian country. National estimates and accuracy When national estimates are derived from a sample, caution must be used when comparing one estimate to another or when comparing estimates over time. Although one estimate may be larger than another, estimates based on a sample have some degree of sampling error. Te sampling error of an estimate depends on several factors, including the amount of variation in the responses and the size of the sample. When the sampling error around an estimate is taken into account, estimates that appear diferent may not be statistically diferent. One measure of the sampling error associated with an estimate is the standard error. Te standard error may vary from one estimate to the next. Generally, SEXUAL VICTIMIZATION REPORTED BY ADULT CORRECTIONAL AUTHORITIES, 2012-15 | JULY 2018 15 an estimate with a small standard error provides a more reliable approximation of the true value than an estimate with a large standard error. Estimates with relatively large standard errors are associated with less precision and reliability and should be interpreted with caution. Estimates and standard errors were calculated using SUDAAN.6 For summary-level statistics, the 2012, 2013, 2014, and 2015 data fles were treated separately. Standard errors are included in the appendix tables. Tese standard errors may be used to construct confdence intervals around survey estimates (e.g., numbers, rates, and percentages), and diferences between estimates. For example, table 1 shows an estimated 24,661 allegations in 2015; appendix table 3 shows a standard error of 206 for that estimate. Te 95% confdence interval around the number of allegations is 24,661 ± 1.96 × 206, resulting in a confdence interval of 24,257 to 25,065. Test of statistical signifcance BJS conducted statistical tests to determine whether diferences in estimated numbers, percentages, and rates in this report were statistically signifcant once sampling error was taken into account. To facilitate the analysis, diferences in estimates of sexual victimization for subgroups have been tested at the 95% signifcance level. For example, the diference between the total number of allegations of sexual victimization in 2015 (24,661 allegations) and 2014 (18,891 allegations) is statistically signifcant at the 95% confdence level (see table 1). In all tables providing detailed comparisons, diferences that are signifcant at the 95% confdence level have been designated with a dagger (†). Te comparison group has been designated with one asterisk (*). 6See Research Triangle Institute (June 2013). SUDAAN Release 11.0.1. Research Triangle Park, NC. SEXUAL VICTIMIZATION REPORTED BY ADULT CORRECTIONAL AUTHORITIES, 2012-15 | JULY 2018 16 APPENDIX TABLE 1 Estimates and standard errors for fgure 1: National estimates of allegations and substantiated incidents of sexual victimization in adult correctional facilities, 2005–15 Allegations Estimate Standard error 24,661 206 18,891 † 214 13,568 † 215 10,047 † 106 8,768 † 90 8,404 † 115 7,855 † 87 7,457 † 212 7,374 † 198 6,528 † 169 6,241 † 179 Year 2015* 2014 2013 2012 2011 2010 2009 2008 2007 2006 2005 Substantiated incidents Estimate Standard error 1,473 40 1,522 61 1,239 † 44 953 † 27 902 † 30 856 † 29 851 † 40 931 † 38 1,001 † 57 967 † 76 885 † 90 *Comparison year. †Diference with comparison year is signifcant at the 95% confdence level. Source: Bureau of Justice Statistics, Survey of Sexual Victimization, 2005–15. APPENDIX TABLE 2 Estimates and standard errors for fgure 2: National estimates of outcomes of alleged sexual victimization in adult correctional facilities, 2010–15 Year 2015* 2014 2013 2012 2011 2010 Substantiated Estimate Standard error 1,473 40 1,522 61 1,239 † 44 953 † 27 902 † 30 856 † 29 Unsubstantiated Estimate Standard error 10,313 88 7,783 † 105 6,122 † 83 5,124 † 64 4,611 † 50 4,489 † 70 Unfounded Estimate Standard error 10,142 148 8,372 † 129 5,158 † 145 3,115 † 53 2,338 † 51 2,293 † 72 Under investigation Estimate Standard error 2,733 12 1,213 † 12 1,045 † 20 856 † 7 919 † 18 766 † 17 *Comparison year. †Diference with comparison year is signifcant at the 95% confdence level. Source: Bureau of Justice Statistics, Survey of Sexual Victimization, 2010–15. APPENDIX TABLE 3 Standard errors for table 1: National estimates of allegations of sexual victimization, by type of facility, 2005 and 2010–15 Type of facility Total Prisons Jails Other adult facilities Indian country jails 2015 206 75 192 0 2014 214 51 208 3 2013 215 55 208 0 2012 106 14 105 0 2011 90 16 88 2010 115 56 100 2005 179 52 171 ^ ^ 13 ^Too few cases to provide a reliable estimate. Source: Bureau of Justice Statistics, Survey of Sexual Victimization, 2005 and 2010–15. SEXUAL VICTIMIZATION REPORTED BY ADULT CORRECTIONAL AUTHORITIES, 2012-15 | JULY 2018 17 APPENDIX TABLE 4 Standard errors for table 2: Rates per 1,000 inmates of allegations of sexual victimization, by type of facility, 2005 and 2010–15 Type of facility Total Prisons Jails Other adult facilities Indian country jails 2015 0.10 0.06 0.27 2014 0.09 0.04 0.27 2013 0.09 0.04 0.26 2012 0.05 0.01 0.14 2011 0.04 0.02 0.12 2010 0.06 0.03 0.14 2005 0.09 0.03 0.23 0.00 1.05 0.00 0.00 ^ ^ ^ ^Too few cases to provide a reliable estimate. Source: Bureau of Justice Statistics, Survey of Sexual Victimization, 2005 and 2010–15. APPENDIX TABLE 5 Estimates and standard errors for fgure 3: National estimates of allegations of sexual victimization in adult correctional facilities, by type of victimization, 2010–15 2015 Standard Type of incident Estimate error Inmate-oninmate Nonconsensual sexual acts 5,992 107 Abusive sexual contact 4,320 63 Staf-on-inmate Sexual misconduct 8,151 90 Sexual harassment 6,197 67 2014 Standard Estimate error 2013 Standard Estimate error 2012 Standard Estimate error 2011 Standard Estimate error 2010 Standard Estimate error 5,057 104 3,931 82 3,255 54 2,986 45 2,660 49 3,433 71 2,743 123 1,860 34 1,480 34 1,360 37 6,449 106 4,345 75 3,322 53 2,800 42 2,692 60 3,953 48 2,549 35 1,611 30 1,502 36 1,692 38 Source: Bureau of Justice Statistics, Survey of Sexual Victimization, 2010–15. SEXUAL VICTIMIZATION REPORTED BY ADULT CORRECTIONAL AUTHORITIES, 2012-15 | JULY 2018 18 APPENDIX TABLE 6 Standard errors for table 3: National estimates of outcomes of investigations into allegations of sexual victimization, by type of facility, 2012–15 Type of victimization and outcome Inmate-on-inmate Substantiated Unsubstantiated Unfounded Under investigation Nonconsensual sexual acts Substantiated Unsubstantiated Unfounded Under investigation Abusive sexual contact Substantiated Unsubstantiated Unfounded Under investigation Staf-on-inmate Substantiated Unsubstantiated Unfounded Under investigation Sexual misconduct Substantiated Unsubstantiated Unfounded Under investigation Sexual harassment Substantiated Unsubstantiated Unfounded Under investigation Total Number of allegations All facilities Local jails 258 253 65 60 120 117 169 168 20 20 179 177 35 35 96 93 115 115 19 19 159 155 54 48 63 63 101 100 4 4 212 191 58 45 102 90 147 132 16 15 167 153 53 39 83 75 109 100 15 14 94 82 19 19 48 41 73 61 2 2 382 364 Source: Bureau of Justice Statistics, Survey of Sexual Victimization, 2012–15. APPENDIX TABLE 7 Standard errors for table 4: Outcomes of completed investigations of sexual victimization, by type of facility, 2012–15 Percent by outcome Type of victimization and outcome All facilities Local jails Inmate-on-inmate Substantiated 0.21% 0.60% Unsubstantiated 0.33 0.91 Unfounded 0.37 1.07 Number of completed investigations 255 250 Nonconsensual sexual acts Substantiated 0.19% 0.56% Unsubstantiated 0.42 1.18 Unfounded 0.44 1.24 Number of completed investigations 175 173 Abusive sexual contact Substantiated 0.39% 1.24% Unsubstantiated 0.46 1.21 Unfounded 0.55 1.74 Number of completed investigations 158 155 Staf-on-inmate Substantiated 0.17% 0.67% Unsubstantiated 0.24 1.05 Unfounded 0.26 1.17 Number of completed investigations 210 189 Sexual misconduct Substantiated 0.25% 0.83% Unsubstantiated 0.31 1.27 Unfounded 0.34 1.38 Number of completed investigations 165 151 Sexual harassment Substantiated 0.14% 0.93% Unsubstantiated 0.33 1.68 Unfounded 0.35 1.83 Number of completed investigations 94 82 Source: Bureau of Justice Statistics, Survey of Sexual Victimization, 2012–15. APPENDIX TABLE 8 Standard errors for table 5: National estimates of substantiated incidents of sexual victimization, by type of facility, 2005 and 2010–15 Type of facility 2015 2014 2013 2012 2011 2010 2005 Total 40 61 44 27 30 30 90 Prisons 0 37 21 9 11 11 9 Jails 40 48 39 25 28 27 90 Other adult facilities Indian country jails 0 ^ 0 0 ^ ^ ^ ^Too few cases to provide a reliable estimate. Source: Bureau of Justice Statistics, Survey of Sexual Victimization, 2005 and 2010–15. SEXUAL VICTIMIZATION REPORTED BY ADULT CORRECTIONAL AUTHORITIES, 2012-15 | JULY 2018 19 APPENDIX TABLE 9 Standard errors for table 6: Rates per 1,000 inmates of substantiated incidents of sexual victimization, by type of facility, 2005 and 2010–15 Type of facility Total Prisons Jails Other adult facilities Indian country jails 2015 0.02 0.00 0.06 2014 0.03 0.02 0.06 2013 0.02 0.01 0.05 2012 0.01 0.01 0.03 2011 0.01 0.01 0.04 2010 0.01 0.01 0.04 2005 0.04 0.01 0.12 0.00 ^ 0.00 0.00 ^ ^ ^ ^Too few cases to provide a reliable estimate. Source: Bureau of Justice Statistics, Survey of Sexual Victimization, 2005 and 2010–15. APPENDIX TABLE 10 Standard errors for table 7: National estimates of substantiated incidents of sexual victimization, by type of victimization, 2005 and 2010–15 Type of victimization Total Inmate-on-inmate Nonconsensual sexual acts Abusive sexual contact Staf-on-inmate Sexual misconduct Sexual harassment 2015 40 35 18 29 19 17 7 2014 61 37 18 32 46 44 10 2013 44 37 18 31 23 16 12 2012 27 17 15 8 20 18 8 2011 30 17 13 11 23 17 13 2010 30 16 8 15 23 20 11 2005 90 … 79 29 … 30 5 …Not available. Source: Bureau of Justice Statistics, Survey of Sexual Victimization, 2005 and 2010–15. APPENDIX TABLE 11 Standard errors for table 8: National estimates of allegations, substantiated incidents, and rates per 1,000 of inmate-on-inmate sexual harassment, by type of facility, 2013–15 Type of facility Total Prisons Jails Other adult facilities Indian country jails Number 285 40 283 ^ Allegations Rate per 1,000 0.04 0.01 0.13 ^ Substantiated incidents Number Rate per 1,000 89 0.01 16 0.00 87 0.04 ^ ^ ^Too few cases to provide a reliable estimate. Source: Bureau of Justice Statistics, Survey of Sexual Victimization, 2013–15. APPENDIX TABLE 12 Standard errors for table 9: National estimates of outcomes of investigations into allegations of inmate-on-inmate sexual harassment, by type of facility, 2013–15 Outcome Total Substantiated Unsubstantiated Unfounded Under investigation Number of allegations All facilities Local jails 285 282 89 87 127 124 131 131 9 9 Percent by outcome All facilities Local jails 0.43% 0.48 0.44 1.15% 1.18 1.18 Source: Bureau of Justice Statistics, Survey of Sexual Victimization, 2013–15. SEXUAL VICTIMIZATION REPORTED BY ADULT CORRECTIONAL AUTHORITIES, 2012-15 | JULY 2018 20 Te Bureau of Justice Statistics of the U.S. Department of Justice is the principal federal agency responsible for measuring crime, criminal victimization, criminal ofenders, victims of crime, correlates of crime, and the operation of criminal and civil justice systems at the federal, state, tribal, and local levels. BJS collects, analyzes, and disseminates reliable statistics on crime and justice systems in the United States, supports improvements to state and local criminal justice information systems, and participates with national and international organizations to develop and recommend national standards for justice statistics. Jefrey H. Anderson is director. Tis report was written by Ramona R. Rantala. Jessica Stroop contributed to the production of the report. Mark Motivans and Stephanie Mueller verifed the report. Brigitte Coulton and Jill Tomas edited the report. Steve Grudziecki and Tina Dorsey produced the report. July 2018, NCJ 251146 NCJ251146 Ofce of Justice Programs Building Solutions • Supporting Communities • Advancing Justice www.ojp.usdoj.gov