
US DOJ-Bureau of Justice Statistics-Statistical Tables, March 2022
Download original document:
Document text
Document text
This text is machine-read, and may contain errors. Check the original document to verify accuracy.
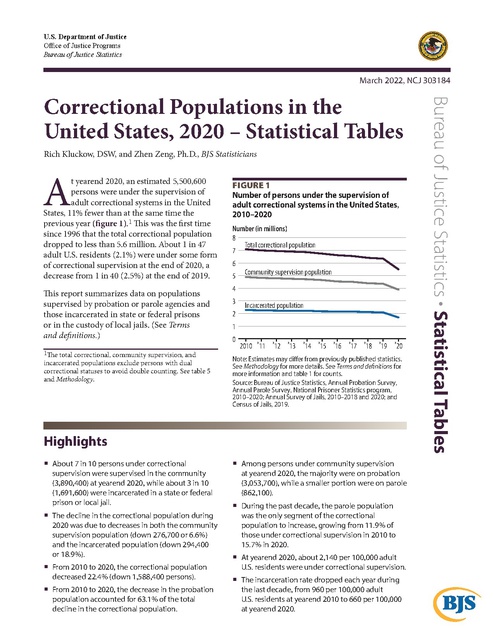
U.S. Department of Justice Office of Justice Programs Bureau of Justice Statistics March 2022, NCJ 303184 Rich Kluckow, DSW, and Zhen Zeng, Ph.D., BJS Statisticians A t yearend 2020, an estimated 5,500,600 persons were under the supervision of adult correctional systems in the United States, 11% fewer than at the same time the previous year (figure 1).1 This was the first time since 1996 that the total correctional population dropped to less than 5.6 million. About 1 in 47 adult U.S. residents (2.1%) were under some form of correctional supervision at the end of 2020, a decrease from 1 in 40 (2.5%) at the end of 2019. This report summarizes data on populations supervised by probation or parole agencies and those incarcerated in state or federal prisons or in the custody of local jails. (See Terms and definitions.) 1The total correctional, community supervision, and incarcerated populations exclude persons with dual correctional statuses to avoid double counting. See table 5 and Methodology. FIGURE 1 Number of persons under the supervision of adult correctional systems in the United States, 2010–2020 Number (in millions) 8 Total correctional population 7 6 5 Community supervision population 4 3 2 Incarcerated population 1 0 2010 ’11 ’12 ’13 ’14 ’15 ’16 ’17 ’18 ’19 ’20 Note: Estimates may differ from previously published statistics. See Methodology for more details. See Terms and definitions for more information and table 1 for counts. Source: Bureau of Justice Statistics, Annual Probation Survey, Annual Parole Survey, National Prisoner Statistics program, 2010–2020; Annual Survey of Jails, 2010–2018 and 2020; and Census of Jails, 2019. Highlights About 7 in 10 persons under correctional supervision were supervised in the community (3,890,400) at yearend 2020, while about 3 in 10 (1,691,600) were incarcerated in a state or federal prison or local jail. The decline in the correctional population during 2020 was due to decreases in both the community supervision population (down 276,700 or 6.6%) and the incarcerated population (down 294,400 or 18.9%). From 2010 to 2020, the correctional population decreased 22.4% (down 1,588,400 persons). From 2010 to 2020, the decrease in the probation population accounted for 63.1% of the total decline in the correctional population. Among persons under community supervision at yearend 2020, the majority were on probation (3,053,700), while a smaller portion were on parole (862,100). During the past decade, the parole population was the only segment of the correctional population to increase, growing from 11.9% of those under correctional supervision in 2010 to 15.7% in 2020. At yearend 2020, about 2,140 per 100,000 adult U.S. residents were under correctional supervision. The incarceration rate dropped each year during the last decade, from 960 per 100,000 adult U.S. residents at yearend 2010 to 660 per 100,000 at yearend 2020. Bureau of Justice Statistics · Statistical Tables Correctional Populations in the United States, 2020 – Statistical Tables Terms and definitions Adult—A person subject to the jurisdiction of an adult criminal court or correctional agency. Adults are age 18 or older in most jurisdictions. Persons age 17 or younger who were prosecuted in criminal court as if they were adults are counted as adults, but persons age 17 or younger who were under the jurisdiction of a juvenile court or agency are excluded. Local jails, however, may hold persons age 17 or younger before or after they are adjudicated. (See Methodology for more details on prisoners and local jail inmates age 17 or younger.) inmates in the custody of local jails per 100,000 U.S. residents of all ages (i.e., total incarceration rate) or U.S. residents age 18 or older (i.e., adult incarceration rate). Average annual percent change—The compound annual growth rate, calculated by taking the natural log of the ratio of current year population to base year population, divided by elapsed time in years, and multiplied by 100. Local jail population—Estimated number of inmates held in confinement facilities operated under the authority of a sheriff, police chief, or city or county administrator. Facilities are intended for adults but may hold juveniles before or after they are adjudicated. Facilities include jails, detention centers, city or county correctional centers, special jail facilities (such as medical or treatment centers and prerelease centers), and temporary holding or lockup facilities that are part of the jail’s combined function. Inmates sentenced to jail facilities usually have a sentence of 1 year or less. Community supervision population—Estimated number of adults living in the community while supervised on probation or parole. Community supervision rate—Estimated number of adults living in the community while supervised on probation or parole per 100,000 U.S. residents of all ages (i.e., total community supervision rate) or U.S. residents age 18 or older (i.e., adult community supervision rate). Correctional population—Estimated number of adults living in the community while supervised on probation or parole and adults under the jurisdiction of state or federal prisons or in the custody of local jails. Correctional supervision rate—Estimated number of adults supervised in the community on probation or parole and adults under the jurisdiction of state or federal prisons or in the custody of local jails per 100,000 U.S. residents of all ages (i.e., total correctional supervision rate) or U.S. residents age 18 or older (i.e., adult correctional supervision rate). Dual correctional statuses—Estimated number of persons on probation or parole who were held in prisons or local jails, persons on parole who were also on probation, or persons in prison who were held in local jails. Imprisonment rate—Estimated number of prisoners under state or federal jurisdiction sentenced to more than 1 year per 100,000 U.S. residents of all ages (i.e., total imprisonment rate) or U.S. residents age 18 or older (i.e., adult imprisonment rate). This statistic does not appear in this report. (See Prisoners in 2020 – Statistical Tables, NCJ 302776, BJS, December 2021.) Incarcerated population—Estimated number of prisoners under the jurisdiction of state or federal prisons and inmates in the custody of local jails. Incarceration rate—Estimated number of prisoners under the jurisdiction of state or federal prisons and Indian country jail population—Estimated number of inmates held in correctional facilities operated by tribal authorities or the Bureau of Indian Affairs (BIA), U.S. Department of the Interior. These facilities include confinement facilities, detention centers, jails, and other facilities operated by tribal authorities or the BIA. (See appendix table 1.) Military prison population—Estimated number of service personnel incarcerated under the jurisdiction of U.S. military correctional authorities. (See appendix table 1.) Parole population—Estimated number of persons on parole who are on conditional release in the community following a prison term while under the control, supervision, or care of a state or federal correctional agency. Violations of the conditions of supervision during this period may result in a new sentence of confinement or a return to confinement for a technical violation. Persons on parole include adults released through discretionary or mandatory supervised release from prison. Prison population—Estimated number of prisoners incarcerated in a long-term confinement facility run by a state or the federal government and typically holding felons and other persons with sentences of more than 1 year, although sentence length may vary by jurisdiction. Prison jurisdiction population—Estimated number of prisoners under the jurisdiction or legal authority of state or federal correctional officials, regardless of where the prisoner is held. This population represents the Bureau of Justice Statistics’ official measure of the prison population and includes prisoners held in public or private prisons, penitentiaries, correctional facilities, halfway houses, boot camps, farms, training or treatment centers, and hospitals. Counts also Correctional Populations in the United States, 2020 – Statistical Tables | March 2022 Continued on next page 2 ■ Terms and definitions (continued) include prisoners who were temporarily absent (less than 30 days); in court or on work release; housed in privately operated facilities, local jails, or other state or federal facilities; and serving concurrent sentences for more than one correctional authority. Prison custody population—Estimated number of prisoners held in the physical custody of state or federal prisons regardless of sentence length or the authority having jurisdiction. This population includes prisoners housed for other correctional facilities but excludes prisoners in the custody of local jails, held in other jurisdictions, out to court, or in transit from one jurisdiction of legal authority to the custody of a confinement facility outside that jurisdiction. Prisoners held in private facilities are excluded from custody counts unless otherwise specified. (See appendix table 2.) Probation population—Estimated number of persons on probation who are on a court-ordered period of supervision in the community while under the control, supervision, or care of a correctional agency. The probation conditions form a contract with the court by which the person must abide to remain in the community, generally in lieu of incarceration. In some cases, probation may be a combined sentence of incarceration followed by a period of community supervision. Often, probation entails monitoring or surveillance by a correctional agency. In some instances, probation may not involve any reporting requirements. Territorial prison population—Estimated number of prisoners in the custody of correctional facilities operated by departments of corrections in U.S. territories (American Samoa, Guam, and the U.S. Virgin Islands) and U.S. commonwealths (the Northern Mariana Islands and Puerto Rico). (See appendix table 1.) List of tables List of figures Table 1. Number of persons supervised by adult correctional systems in the United States, by correctional status, 2010–2020 Figure 1. Number of persons under the supervision of adult correctional systems in the United States, 2010–2020 Table 2. Change in the number of persons supervised by adult correctional systems in the United States, 2010–20 List of appendix tables Table 3. Composition of the adult correctional system in the United States, by correctional status, 2010 and 2020 Table 4. Rate of persons supervised by adult correctional systems in the United States, by correctional status, 2010–2020 Table 5. Number of persons with dual correctional statuses at yearend, 2010–2020 Appendix table 1. Number of persons incarcerated by other adult correctional systems, 2010, 2019, and 2020 Appendix table 2. Custody counts of adults in state or federal prisons or local jails, 2010, 2019, and 2020 Appendix table 3. Standard errors for local jail inmates at midyear, 2010–2020 Correctional Populations in the United States, 2020 – Statistical Tables | March 2022 3 ■ TablE 1 Number of persons supervised by adult correctional systems in the United States, by correctional status, 2010–2020 Year 2010 2011 2012 2013 2014 2015 2016 2017 2018 2019 2020f* January 1 December 31 Average annual percent change, 2010–2020 Percent change 2010–2020 2019–2020g 2,279,100 2,252,500 2,231,300 2,222,500 2,225,100 2,172,800 2,165,100 2,153,600 2,122,300 2,086,000 Incarcerateda Prison 1,613,800 1,599,000 1,570,400 1,577,000 1,562,300 1,526,600 1,508,100 1,489,200 1,464,400 1,430,200 Local jaile 748,700 † 735,600 † 744,500 † 731,200 † 744,600 † 727,400 † 740,700 † 745,200 † 738,400 † 734,500 † 851,000 862,100 ~ 1,691,600 ~ 1,215,800 ~ 549,100e -2.8% 0.3% -3.0% -2.8% -3.1% -24.7% -8.3 2.5% 1.3 -25.8% -18.9 -24.7% -15.0 -26.7% -25.2 Community supervision Probation 4,888,500 4,055,900 4,818,300 3,973,800 4,790,700 3,944,900 4,749,800 3,912,900 4,713,200 3,868,400 4,650,900 3,789,800 4,537,100 3,673,100 4,508,900 3,647,200 4,399,000 3,540,000 4,357,700 3,492,900 Parole 840,800 855,500 858,400 849,500 857,700 870,500 874,800 875,000 878,000 878,900 6,152,800 5,500,600 4,167,100 3,890,400 3,330,200 3,053,700 -2.5% -2.3% -22.4% -10.6 -20.4% -6.6 Total correctional populationb 7,089,000 6,994,500 6,949,800 6,899,700 6,856,900 6,740,300 6,616,200 6,549,700 6,409,200 6,343,300 Totalc Totald Note: Counts are rounded to the nearest 100 and include estimates for nonresponding jurisdictions. Estimates for 2019 and earlier may have been revised based on updated reporting and may differ from previously published statistics. Probation, parole, and prison counts for 2019 and earlier are for December 31. Details may not sum to totals due to rounding and because estimates were adjusted to exclude persons with dual correctional statuses (persons on probation or parole who were held in prisons or local jails, persons on parole who were also on probation, or persons in prison who were held in local jails). See table 5 and Methodology for more details. Significance testing was conducted for local jail estimates because counts are based on a sample of jails in the Annual Survey of Jails from 2010 through 2018 and 2020. The 2019 local jails count is based on a full census of the population. *Comparison year for local jail inmates only. †Difference with comparison year is significant at the 95% confidence level. ~Not applicable. aPersons who were under the jurisdiction of state or federal prisons or were held in local jails. bEstimates were adjusted to exclude persons with dual correctional statuses. See table 5 and Methodology for more details. cEstimates were adjusted to exclude persons on parole who were also on probation. See table 5 and Methodology for more details. dEstimates were adjusted to exclude prisoners who were held in local jails. See table 5 and Methodology for more details. eAll jail counts are for the last weekday in June. See appendix table 3 for standard errors. fThe total correctional population for January 1, 2020 is the sum of the total community supervision population for January 1, 2020, the total prison population for December 31, 2019, and the total jail population on the last weekday in June 2019, adjusted for the number of persons with dual correctional statuses as of December 31, 2019. The counts reported by community supervision agencies showed a decrease of 162,700 persons on probation and 27,900 persons on parole between December 31, 2019 and January 1, 2020. gThe 2019–2020 change for the community supervision population was calculated as the difference between January 1, 2020 and December 31, 2020. The change for the prison population was calculated as the difference between December 31, 2019 and December 31, 2020. The change for the jail population was calculated as the difference between the last weekday in June 2019 and the last weekday in June 2020. Source: Bureau of Justice Statistics, Annual Probation Survey, Annual Parole Survey, National Prisoner Statistics program, 2010–2020; Annual Survey of Jails, 2010–2018 and 2020; and Census of Jails, 2019. Correctional Populations in the United States, 2020 – Statistical Tables | March 2022 4 ■ TablE 2 Change in the number of persons supervised by adult correctional systems in the United States, 2010–20 Correctional population Total changeb Probationc Prisonc,d Parolec Local jaile 2010–20 Change in population Percent of total changea -1,588,400 --1,002,200 63.1% -398,000 25.1 21,300 -1.3 -199,600 12.6 2019–20 Change in population Percent of total changea -652,200 --276,500 42.4% -214,300 32.9 11,100 -1.7 -185,400 28.4 Note: Counts are rounded to the nearest 100 and include estimates for nonresponding jurisdictions. Details may not sum to totals due to rounding and because counts used to calculate change in each correctional population included persons with dual correctional statuses (persons on probation or parole who were held in prisons or local jails, persons on parole who were also on probation, or persons in prison who were held in local jails). See table 5 and Methodology for more details. --Not calculated. aDetails do not sum to 100% because the number of persons with dual correctional statuses was excluded from the total change to avoid double counting. See Methodology for more details. bReflects the change in probation, prison, parole, and local jail populations minus the change in persons with dual correctional statuses to avoid double counting. From 2010 to 2020, the number of persons with dual correctional statuses increased by 9,800. See table 5 and Methodology for more details. cPopulation as of December 31, except for 2019–20, when the probation and parole changes were calculated as the difference between January 1, 2020 and December 31, 2020. dIncludes persons who were under the jurisdiction of state or federal prisons. ePopulation as of the last weekday in June. Source: Bureau of Justice Statistics, Annual Probation Survey, Annual Parole Survey, National Prisoner Statistics program, 2010 and 2019–20; Annual Survey of Jails 2010 and 2020; and Census of Jails, 2019. TablE 3 Composition of the adult correctional system in the United States, by correctional status, 2010 and 2020 Correctional population Totala Probationb Prisonb,c Paroleb Local jaild 2010 Percent of total Population population 7,089,000 100% 4,055,900 57.2 1,613,800 22.8 840,800 11.9 748,700 10.6 2020 Percent of total Population population 5,500,600 100% 3,053,700 55.5 1,215,800 22.1 862,100 15.7 549,100 10.0 Note: Counts are rounded to the nearest 100 and include estimates for nonresponding jurisdictions. Details may not sum to totals due to rounding and because estimates were adjusted to exclude persons with dual correctional statuses (persons on probation or parole who were held in prisons or local jails, persons on parole who were also on probation, or persons in prison who were held in local jails). See table 5 and Methodology for more details. aReflects probation, prison, parole, and local jail counts minus persons with dual correctional statuses to avoid double counting. There were 170,300 persons in 2010 and 180,100 persons in 2020 with dual correctional statuses. See table 5 and Methodology for more details. bPopulation as of December 31. cPersons who were under the jurisdiction of state or federal prisons. dPopulation as of the last weekday in June. Source: Bureau of Justice Statistics, Annual Probation Survey, Annual Parole Survey, Annual Survey of Jails, and National Prisoner Statistics program, 2010 and 2020. Correctional Populations in the United States, 2020 – Statistical Tables | March 2022 5 ■ TablE 4 Rate of persons supervised by adult correctional systems in the United States, by correctional status, 2010–2020 Year 2010 2011 2012 2013 2014 2015 2016 2017 2018 2019 2020 Total correctional populationa Number Number Adult U.S. supervised per supervised per residents under 100,000 U.S. 100,000 adult correctional residents of U.S. residentsc supervision all agesd 3,000 1 in 33 2,280 2,930 1 in 34 2,240 2,880 1 in 35 2,210 2,830 1 in 35 2,170 2,790 1 in 36 2,140 2,720 1 in 37 2,090 2,640 1 in 38 2,040 2,590 1 in 39 2,010 2,520 1 in 40 1,960 2,480 1 in 40 1,930 2,140 1 in 47 1,670 Community supervision population Number on Number on probation/ probation/parole parole per per 100,000 100,000 adult U.S. residents of U.S. residentsc all agesd 2,070 1,570 2,020 1,540 1,980 1,520 1,950 1,500 1,920 1,470 1,870 1,440 1,810 1,400 1,790 1,380 1,730 1,340 1,700 1,320 1,510 1,180 Incarcerated populationb Number in Number in prison/local prison/local jail jail per per 100,000 100,000 adult U.S. residents U.S. residentsc of all agesd 960 730 940 720 920 710 910 700 900 700 880 680 860 670 850 660 830 650 810 630 660 510 Note: Rates are rounded to the nearest 10. Rates include a small number of persons age 17 or younger who were under adult correctional supervision. Estimates may have been revised based on updated reporting and may differ from numbers in past reports. aPersons who were supervised in the community by probation or parole agencies, were under the jurisdiction of state or federal prisons, or were in the custody of local jails. bPersons who were under the jurisdiction of state or federal prisons or were held in local jails. cRates were calculated using U.S. Census Bureau estimates of the U.S. resident population of persons age 18 or older for January 1 of the following year. dRates were calculated using U.S. Census Bureau estimates of the U.S. resident population of persons of all ages for January 1 of the following year. Source: Bureau of Justice Statistics, Annual Probation Survey, Annual Parole Survey, National Prisoner Statistics program, 2010–2020; Annual Survey of Jails, 2010–2018 and 2020; Census of Jails, 2019; and U.S. Census Bureau, postcensal estimated resident populations for January 1 of each year, 2010–2020. Correctional Populations in the United States, 2020 – Statistical Tables | March 2022 6 ■ Methodology Sources of data The statistics presented in this report include data from several of the Bureau of Justice Statistics’ (BJS) data collections. Each collection relies on the voluntary participation of federal, state, and local respondents. For more information about the following data collections, see the Data Collections page on the BJS website at https://bjs.ojp.gov/data/data-collections/search. Annual Probation Survey and Annual Parole Survey. BJS’s Annual Probation Survey and Annual Parole Survey, which began in 1980, collect data from probation and parole agencies in the United States that supervise adults. These data collections define adults as persons subject to the jurisdiction of an adult court or correctional agency. Juveniles sentenced as adults in a criminal court are considered adults. Juveniles under the jurisdiction of a juvenile court or correctional agency are excluded. The two surveys collect data on the number of adults supervised in the community on January 1 and December 31 each year, the number of entries to and exits from supervision during the reporting year, and characteristics of the population at yearend. Both surveys cover the 50 states, the District of Columbia, and the federal system. BJS depends on the voluntary participation of state central reporters and separate state, county, and court agencies for these data. For more statistics and information, see the Probation and Parole Populations series on the BJS website at https:// bjs.ojp.gov/data-collection/annual-probation-surveyand-annual-parole-survey. In each collection year, respondents are asked to provide both the January 1 and December 31 population counts for the previous year. Therefore, while the December 31, 2019 count was collected in 2020, the January 1, 2020 count was not collected until 2021. At times, the January 1 count from a given year may differ from the December 31 count of the prior year, given the normal daily flow of entries and exits. Additionally, the difference reported may have resulted from administrative changes, such as— implementing new information systems, leading to data review and cleanup reconciling records of persons on probation reclassifying individuals, including those on probation to parole and those with dual community supervision statuses including certain probation populations not previously reported (e.g., persons supervised for DUI or DWI, some persons on probation who had absconded, and some on an inactive status). The probation counts decreased by 162,700 between December 31, 2019 and January 1, 2020. (See tables 1 and 2.) The difference between the parole population counts for December 31, 2019 and January 1, 2020 was a decrease of 27,900. Estimating change in population counts In theory, the change in probation and parole populations from the beginning to the end of the year should equal the difference between entries and exits during the year. In practice, those numbers may not be equal. Some probation and parole information systems track the number of cases that enter and exit community supervision, not the number of persons, while January 1 and yearend populations represent persons. Some persons are being supervised for more than one charge or case simultaneously. Additionally, all data on entries and exits may not have been logged into the respondents’ information systems, or the information systems may not have fully processed all data before submission to BJS. Annual Survey of Jails. The Annual Survey of Jails (ASJ) has collected data from a nationally representative sample of local jails each year since 1982, except for 1983, 1988, 1993, 1999, 2005, and 2019, when complete censuses of local jails in the United States were conducted. The 2020 ASJ used a stratified probability sample of 897 active jail jurisdictions nationwide to produce national estimates. The tables and figures in this report are based on ASJ estimates from the last weekday in June for the local jail population from 2010 through 2020. The ASJ estimates for the local jail population include inmates age 17 or younger who were held either before or after they were adjudicated (about 2,300 at midyear 2020). For more statistics and information, see the Prison and Jail Inmates at Midyear series on the BJS website at https://bjs.ojp.gov/data-collection/annual-surveyjails-asj. Taylor Series Linearization (TSL) methods were used to estimate the standard errors for the ASJ counts in this report. (See appendix table 3.) The TSL method directly Correctional Populations in the United States, 2020 – Statistical Tables | March 2022 7 ■ estimates variances through a linearized function by combining variance estimates from strata used to sample jail jurisdictions. Standard errors were produced using a stratified without replacement design. Census of Jails. The Census of Jails (COJ) began in 1970 and was conducted in 1972, 1978, 1983, 1988, 1993, 1999, 2005/2006, 2013, and 2019. The census is designed to produce national and state-level estimates of the number and characteristics of local jail inmates through a complete enumeration of jail facilities in the United States. The 2019 estimates on the local jail population are based on COJ data for the last weekday in June. The 2019 local jail population includes inmates age 17 or younger who were held either before or after they were adjudicated. For more statistics and information, see the Census of Jails series on the BJS website at https://bjs.ojp.gov/data-collection/censusjails-coj. National Prisoner Statistics program. The National Prisoner Statistics (NPS) program began in 1926 under a mandate from Congress and is conducted annually. It collects data from the nation’s 50 state departments of corrections (DOCs) and the Federal Bureau of Prisons (BOP). The NPS distinguishes between prisoners in custody and prisoners under the jurisdiction of correctional authorities. To have custody of a prisoner, a state or the BOP must physically hold that prisoner in one of its facilities. To have jurisdiction over a prisoner, the state or the BOP must have legal authority over that prisoner, regardless of where the prisoner is incarcerated or supervised. Some states were unable to provide counts that distinguish between custody and jurisdiction.2 For more statistics and information, see the Prisoners series on the BJS website at https:// bjs.ojp.gov/data-collection/national-prisonerstatistics-nps-program. The NPS prisoner counts and rates included in figure 1 and tables 1 through 4 are based on a December 31 reference date and are consistent with the jurisdiction counts and findings reported in Prisoners in 2020 – Statistical Tables (NCJ 302776, BJS, December 2021). The NPS jurisdiction counts represent BJS’s official measure of the prison population and include persons held in prisons, penitentiaries, correctional facilities, halfway houses, boot camps, farms, training or treatment centers, and hospitals. Jurisdiction counts 2To determine which states did not distinguish between custody and jurisdiction counts, see the Jurisdiction notes for Prisoners in 2020 (NCJ 302776, BJS, December 2021) at https://bjs.ojp.gov/ library/publications/prisoners-2020-statistical-tables. include prisoners who were temporarily absent (less than 30 days), in court, or on work release; housed in privately operated facilities, local jails, or other state or federal facilities; or serving concurrent sentences for more than one correctional authority. The NPS prisoner custody counts are based on a December 31 reference and are reported only in appendix table 2. The prisoner custody counts in appendix table 2 include all prisoners held within state and federal facilities, including those housed for other correctional facilities, prisoners held in privately operated facilities, and prisoners age 17 or younger who were serving time in a publicly or privately operated state or federal correctional facility after being sentenced in criminal court as if they were adults. Also, the prisoner custody counts in appendix table 2 include persons in the six states in which prisons and jails form an integrated system, including persons age 17 or younger who may have been held before or after adjudication. Through the annual NPS collection, BJS has obtained yearend counts of prisoners in the custody of U.S. military authorities from the Department of Defense Corrections Council since 1994. In 1994, the council, consisting of representatives from each branch of military service, adopted a standardized form (DD Form 2720) that obtains data on prisoners held in U.S. military confinement facilities inside and outside of the continental United States. (See appendix table 1.) See Prisoners in 2020 – Statistical Tables (NCJ 302776, BJS, December 2021) for more statistics and information. Since 1995, through the annual NPS collection, BJS has collected yearend counts of prisoners from DOCs in the U.S. territories (American Samoa, Guam, and the U.S. Virgin Islands) and U.S. commonwealths (the Northern Mariana Islands and Puerto Rico). These data represent all prisoners in the custody of prison facilities in the U.S. territories and commonwealths. (See appendix table 1.) See Prisoners in 2020 – Statistical Tables (NCJ 302776, BJS, December 2021) for more statistics and information, including nonresponse. Survey of Jails in Indian Country. The Annual Survey of Jails in Indian Country (SJIC) has been conducted annually since 1998, except in 2005 and 2006. The SJIC collects detailed information on all adult and juvenile confinement facilities, detention centers, jails, and other facilities operated by tribal authorities or the U.S. Department of the Interior’s Bureau of Indian Affairs. The 2020 estimate of jail inmates in Indian Correctional Populations in the United States, 2020 – Statistical Tables | March 2022 8 ■ country presented in appendix table 1 is based on data from the last weekday in June. For more statistics and information, see the Jails in Indian Country series on the BJS website at https://bjs.ojp.gov/data-collection/ annual-survey-jails-indian-country-sjic. Counts adjusted for persons with dual correctional statuses Persons under correctional supervision may have dual correctional statuses for several reasons: Probation and parole agencies may not always be notified immediately of new arrests, jail admissions, or prison admissions. Absconders included in a probation or parole agency’s population in one jurisdiction may actually be incarcerated in another jurisdiction. Persons may be admitted to jail or prison before formal revocation hearings and potential discharge by a probation or parole agency. Persons may be serving separate probation and parole sentences concurrently. State and federal prisons may hold prisoners in county facilities or local jails to reduce crowding in their prisons. In 1998, through the Annual Probation Survey and Annual Parole Survey, BJS began collecting data on the number of persons on probation or parole with dual correctional statuses. In 1999, BJS began collecting data through the NPS on the number of prisoners under the jurisdiction of state or federal prisons who were held in county facilities or local jails (table 5). Table 5 includes adjustments that were made to the total correctional population, the total community supervision population, and all estimates of the total incarcerated population presented in this report to exclude persons with dual correctional statuses to avoid double counting. The estimates for the Annual Probation Survey and Annual Parole Survey are based on data from probation and parole agencies that provided information for the reporting year. As some probation and parole agencies did not provide data on individuals with dual statuses, the total number of persons who had dual correctional statuses may be underestimated. Due to this adjustment, the sum of correctional statuses in figure 1 and tables 1 through 4 does not equal the total correctional population without subtracting out the persons with dual correctional statuses. In addition, the sum of the probation and parole populations does not yield the total community supervision population because the total was adjusted for persons on parole who were also on probation. Also, the sum of the prison and local jail populations does not equal the total incarcerated population because prisoners held in local jails were excluded from the total. TablE 5 Number of persons with dual correctional statuses at yearend, 2010–2020 Year 2010 2011 2012 2013 2014 2015 2016 2017 2018 2019 2020 Total 170,300 169,300 168,400 170,800 176,100 174,000 180,500 206,800 211,500 193,000 180,100 Prisoners in local jail 83,400 82,100 83,600 85,700 81,800 81,200 83,700 80,800 80,500 78,600 73,300 Persons on probation— In state/ In local jail federal prison 21,300 21,500 21,100 22,300 21,200 21,700 22,400 16,700 23,500 24,600 24,400 28,200 24,400 24,000 37,100 34,900 38,700 34,900 40,700 22,300 32,200 16,100 Persons on parole— In state/ In local jail federal prison On probation 21,400 14,400 8,300 18,000 14,900 11,000 18,500 10,700 12,700 21,800 11,800 12,500 21,800 11,600 12,900 19,600 11,200 9,400 24,500 13,000 10,800 26,400 14,400 13,300 24,500 14,100 18,900 23,400 14,000 14,100 21,500 11,500 25,400 Note: Counts are rounded to the nearest 100. Estimates for 2019 and earlier may have been revised based on updated reporting and may differ from previously published statistics. Details may not sum to totals due to rounding. Source: Bureau of Justice Statistics, Annual Probation Survey, Annual Parole Survey, National Prisoner Statistics program, 2010–2020; Annual Survey of Jails, 2010–2018 and 2020; and Census of Jails, 2019. Correctional Populations in the United States, 2020 – Statistical Tables | March 2022 9 ■ Nonresponse adjustments to estimated population counts Probation, parole, prison, and jail population counts were adjusted to account for nonresponse across data collections. The methods varied and depended on the type of collection, type of respondent, and availability of information. For more information on the nonresponse adjustments implemented to generate national and jurisdiction-level estimates of all four correctional populations in 2020, see Methodology in Probation and Parole in the United States, 2020 at https://bjs.ojp.gov/content/pub/pdf/ppus20.pdf, Prisoners in 2020 – Statistical Tables at https://bjs.ojp. gov/content/pub/pdf/p20st.pdf, and Jail Inmates in 2020 – Statistical Tables at https://bjs.ojp.gov/content/ pub/pdf/ji20st.pdf. For nonresponse adjustments for 2019 estimates and prior years, see Methodology in these source reports for each particular reference year. Comparability of jurisdiction-level estimates over time All jurisdiction-level estimates included in this report are based on data reported within the reference year. Some jurisdictions update their population counts after submitting their data to BJS. Updated population counts usually include data that were not entered into the information system before the survey was submitted or data that were not fully processed by yearend. Also, some jurisdictions have experienced reporting changes for one or more correctional population collections over time. These changes may result from making administrative changes (such as consolidating databases or implementing new information systems that result in data review and cleanup), reconciling individual records, reclassifying persons (including changes from probation to parole and persons with dual community supervision statuses), and including certain subpopulations that were not previously reported. For these reasons, comparisons between jurisdictions and comparisons between years for the same jurisdiction over time may not be valid. More detailed information about updates and reporting changes that affect the ability to make jurisdiction-level comparisons over time may be found in the source reports listed above in Nonresponse adjustments to estimated population counts and on the BJS website for particular source collections, including the Probation and Parole Populations series and the Prisoners series for each particular reference year. Correctional Populations in the United States, 2020 – Statistical Tables | March 2022 10 ■ Appe Other adult correctional systems Total Territorial prisonsa Jails in Indian countryb Military facilitiesc 2010 15,800 12,410 1,910 1,480 Number of persons 2019 13,970 10,010 2,750 1,210 2020 12,730 9,660 1,890 1,180 Average annual percent change, 2010–2020 -2.2% -2.5 -0.1 -2.3 Note: Counts of persons in these facilities are excluded from estimates of the incarcerated populations in figure 1 and tables 1 through 4, as these persons are not under the jurisdiction of state or federal prisons or held in confinement facilities operated under the authority of a sheriff, local police chief, or local city or county administrator. Details may not sum to totals due to rounding. Estimates may have been revised based on updated reporting and may differ from previously published statistics. aThe 2019 and 2020 totals include population counts that were estimated for some territories due to nonresponse. Estimates are based on the number of persons held on December 31 and are rounded to the nearest 10. See Prisoners in 2020 – Statistical Tables (NCJ 302776, BJS, December 2021) for more details. bEstimates are based on the number of persons held on the last weekday in June and are rounded to the nearest 10. See Jails in Indian Country, 2019–2020 and the Impact of COVID-19 on the Tribal Jail Population (NCJ 300801, BJS, October 2021) for more details. cEstimates are based on the number of persons held on December 31 and are rounded to the nearest 10. See Prisoners in 2020 – Statistical Tables (NCJ 302776, BJS, December 2021) for more details. Source: Bureau of Justice Statistics, National Prisoner Statistics program, 2010, 2019, and 2020, Survey of Jails in Indian Country, 2010, 2019, and 2020; and U.S. Department of Defense, Office of the Under Secretary for Defense for Personnel and Readiness, 2010, 2019, and 2020. Correctional Populations in the United States, 2020 – Statistical Tables | March 2022 11 ■ Appe Type of facility Total custody populationa Federalb Prisons Federal facilities Privately operated facilities Community Corrections Centersc State prisoners State facilitiesd Privately operated facilities Local jails Incarceration ratee Adult incarceration ratef Number of persons in custody 2010 2019 2020* 2,266,500 2,068,800 1,675,400 207,000 174,400 151,300 198,300 166,600 145,500 173,100 147,000 123,500 25,200 19,600 22,100 8,600 7,800 5,700 1,310,800 1,159,900 975,000 1,216,700 1,071,300 902,600 94,100 88,500 72,300 748,700 † 734,500 † 549,100 730 960 630 810 Average annual percent change, 2010–2020 -3.0% -3.1% -3.1 -3.4 -1.3 -4.1 -3.0% -3.0 -2.6 -3.1% 510 660 -3.6% -3.7 Note: Custody counts of incarcerated persons are presented in this table and differ from the jurisdiction counts presented in other tables in this report. Counts are rounded to the nearest 100 and include estimates for nonresponding jurisdictions. Estimates may have been revised based on updated reporting and may differ from previously published statistics. See Methodology for more details. Rates are rounded to the nearest 10. Details may not to sum to totals due to rounding. Prison counts are for December 31, while jail counts are for the last weekday in June. See Methodology for sources of incarceration data and Terms and definitions for an explanation of the differences between the custody prison population reported in this table and jurisdiction prison population reported in all other tables and figures in this report. Significance testing was conducted for local jail estimates because the 2010 and 2020 counts are based on a sample of jails from the Annual Survey of Jails. The 2019 local jails count is based on a full census of the population. *Comparison year for local jail inmates only. †Difference with comparison year is significant at the 95% confidence level. aAll persons in the custody of state or federal prisons, privately operated facilities, or local jails. Excludes persons held in U.S. territories (appendix table 1), military facilities (appendix table 1), U.S. Immigration and Customs Enforcement facilities, jails in Indian country (appendix table 1), or juvenile facilities. bAfter 2001, responsibility for sentenced prisoners from the District of Columbia was transferred to the Federal Bureau of Prisons. cNonsecure, privately operated community corrections centers. dExcludes prisoners held in local jails in Georgia for 2010, 2019, and 2020 to avoid double counting. eRates are based on the total number of persons in the custody of state or federal prisons, privately operated facilities, or local jails and were calculated using U.S. Census Bureau estimates of the U.S. resident population of persons of all ages for January 1 of the following year. fRates are based on the total number of persons in the custody of state or federal prisons, privately operated facilities, or local jails and were calculated using U.S. Census Bureau estimates of the U.S. resident population of persons age 18 or older for January 1 of the following year. An estimated 9,855 persons age 17 or younger were in the custody of state prisons or local jails in 2010; 3,511 in 2019; and 2,613 in 2020. Source: Bureau of Justice Statistics, National Prisoner Statistics program, 2010, 2019, and 2020, Annual Survey of Jails, 2010 and 2020, Census of Jails, 2019; and U.S. Census Bureau, postcensal estimated resident populations for January 1 of each year, 2010, 2019, and 2020. Correctional Populations in the United States, 2020 – Statistical Tables | March 2022 12 ■ Appe Year 2010 2011 2012 2013 2014 2015 2016 2017 2018 2019 2020 Standard error 5,430 6,010 7,680 8,040 8,380 7,190 5,940 6,610 7,120 ~ 5,120 Note: Standard errors are rounded to the nearest 10. See table 1 for counts of local jail inmates. ~Not applicable. Data are based on a full census of the population. Source: Bureau of Justice Statistics, Annual Survey of Jails, 2010–2018 and 2020; and Census of Jails, 2019. Correctional Populations in the United States, 2020 – Statistical Tables | March 2022 13 ■ The Bureau of Justice Statistics of the U.S. Department of Justice is the principal federal agency responsible for measuring crime, criminal victimization, criminal offenders, victims of crime, correlates of crime, and the operation of criminal and civil justice systems at the federal, state, tribal, and local levels. BJS collects, analyzes, and disseminates reliable statistics on crime and justice systems in the United States, supports improvements to state and local criminal justice information systems, and participates with national and international organizations to develop and recommend national standards for justice statistics. Doris J. James is the acting director. This report was written by Rich Kluckow and Zhen Zeng. Tracy Snell and Danielle Kaeble verified the report. Eric Hendrixson edited the report. Carrie Epps-Carey produced the report. March 2022, NCJ 303184 1111111111111111111111111111111! NCJ 303 184 Office of Justice Programs Building Solutions • Supporting Communities • Advancing Justice www.ojp.gov