
Us Doj Report Veterans in State and Federal Prisons in 2004 2007
Download original document:
Document text
Document text
This text is machine-read, and may contain errors. Check the original document to verify accuracy.
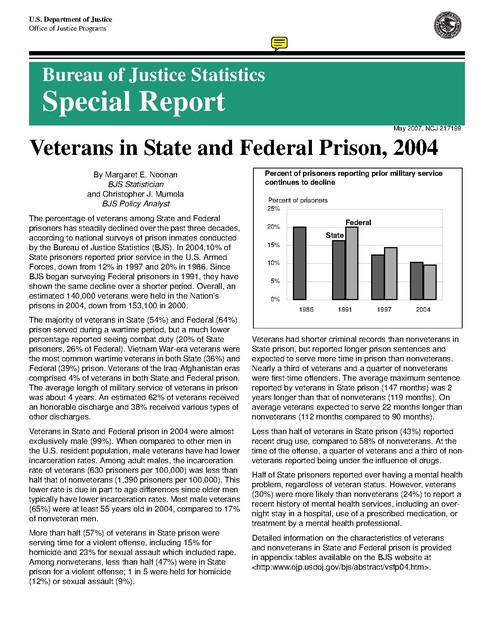
U.S. Department of Justice
Office of Justice Programs

Bureau of Justice Statistics

Special Report
May 2007, NCJ 217199

Veterans in State and Federal Prison, 2004
By Margaret E. Noonan
BJS Statistician
and Christopher J. Mumola
BJS Policy Analyst
The percentage of veterans among State and Federal
prisoners has steadily declined over the past three decades,
according to national surveys of prison inmates conducted
by the Bureau of Justice Statistics (BJS). In 2004,10% of
State prisoners reported prior service in the U.S. Armed
Forces, down from 12% in 1997 and 20% in 1986. Since
BJS began surveying Federal prisoners in 1991, they have
shown the same decline over a shorter period. Overall, an
estimated 140,000 veterans were held in the Nation’s
prisons in 2004, down from 153,100 in 2000.
The majority of veterans in State (54%) and Federal (64%)
prison served during a wartime period, but a much lower
percentage reported seeing combat duty (20% of State
prisoners, 26% of Federal). Vietnam War-era veterans were
the most common wartime veterans in both State (36%) and
Federal (39%) prison. Veterans of the Iraq-Afghanistan eras
comprised 4% of veterans in both State and Federal prison.
The average length of military service of veterans in prison
was about 4 years. An estimated 62% of veterans received
an honorable discharge and 38% received various types of
other discharges.
Veterans in State and Federal prison in 2004 were almost
exclusively male (99%). When compared to other men in
the U.S. resident population, male veterans have had lower
incarceration rates. Among adult males, the incarceration
rate of veterans (630 prisoners per 100,000) was less than
half that of nonveterans (1,390 prisoners per 100,000). This
lower rate is due in part to age differences since older men
typically have lower incarceration rates. Most male veterans
(65%) were at least 55 years old in 2004, compared to 17%
of nonveteran men.
More than half (57%) of veterans in State prison were
serving time for a violent offense, including 15% for
homicide and 23% for sexual assault which included rape.
Among nonveterans, less than half (47%) were in State
prison for a violent offense; 1 in 5 were held for homicide
(12%) or sexual assault (9%).

Percent of prisoners reporting prior military service
continues to decline
Percent of prisoners
25%

Federal

20%

State
15%
10%
5%
0%
1986

1991

1997

2004

Veterans had shorter criminal records than nonveterans in
State prison, but reported longer prison sentences and
expected to serve more time in prison than nonveterans.
Nearly a third of veterans and a quarter of nonveterans
were first-time offenders. The average maximum sentence
reported by veterans in State prison (147 months) was 2
years longer than that of nonveterans (119 months). On
average veterans expected to serve 22 months longer than
nonveterans (112 months compared to 90 months).
Less than half of veterans in State prison (43%) reported
recent drug use, compared to 58% of nonveterans. At the
time of the offense, a quarter of veterans and a third of nonveterans reported being under the influence of drugs.
Half of State prisoners reported ever having a mental health
problem, regardless of veteran status. However, veterans
(30%) were more likely than nonveterans (24%) to report a
recent history of mental health services, including an overnight stay in a hospital, use of a prescribed medication, or
treatment by a mental health professional.
Detailed information on the characteristics of veterans
and nonveterans in State and Federal prison is provided
in appendix tables available on the BJS website at
<http:www.ojp.usdoj.gov/bjs/abstract/vsfp04.htm>.

After rising for two decades, number of veterans
dropped since 2000
Between 1985 and 2000, the estimated number of veterans
in State and Federal prison rose by more than 50,000, or
53%. During the same period, the overall State and Federal
prisoner growth was three times greater. Since 2000, the
annual prisoner growth has slowed dramatically, and the
number of veterans in prison fell by 13,100 or 9%.
Number of veterans in State and Federal prison
160,000

The gap between these groups has grown over time. In
1985 the prison incarceration rate of male veterans (368
prisoners per 100,000 veterans) was just over half that of
nonveteran men (646 per 100,000). By 2004 the
incarceration rates of each group had risen sharply, but
more so among nonveterans (115%) than veterans (71%).
Male veterans (630 prisoners per 100,000) were less than
half as likely as nonveteran men (1,390 prisoners per
100,000) to be in prison in 2004.
Prison incarceration rate,
per 100,000 adult males
Veterans Nonveterans

Age

140,000

All adults
18-24
25-34
35-44
45-54
55-64
65 or older

120,000
100,000
80,000
60,000
40,000
20,000
0
1985

1990

1995

2000

2004

Figure 1

The decline in the percentage and number of veterans in
the Nation’s prisons reflects in part the declining number of
veterans in the U.S. resident population. According to the
U.S. Department of Veterans Affairs (VA), there were an
estimated 24,523,300 veterans in the United States resident
population in 2004.* Since 1985 the number of veterans
living in the U.S. has declined by nearly 3.5 million persons,
dropping from 16% of the adult U.S. resident population to
11%. During the same period, active-duty personnel in the
U.S. Armed Forces dropped by 34%, a decline of over
700,000 active-duty personnel.
Male veterans were half as likely as other men to be
held in prison; the gap increasing since the 1980s
Over 90% of veterans in the U.S. population were men, and
veterans in both State and Federal prison in 2004 were
almost exclusively male (99%). When compared to other
men in the U.S. resident population, veterans have had
consistently lower incarceration rates.

630
1,391
1,232
1,861
1,314
345
76

1,390
1,446
2,260
1,763
846
451
105

The difference in male incarceration rates by veteran status
is largely explained by age. Veterans were older than other
men in the U.S. population. In 2004 two-thirds of all male
veterans were age 55 or older, compared to 17% of nonveteran men. The incarceration rate of these older male veterans (182 per 100,000) was far lower than for those under
age 55 (1,483 per 100,000). Veterans also had a much
lower incarceration rate among men age 25 to 34, which is
the largest age group of State prisoners. If veteran men had
the same age distribution as nonveteran men, the incarceration rates would be similar. The age-controlled incarceration rate for veteran men (1,253 prisoners per 100,000)
would be 10% lower than that of nonveteran men (1,390 per
100,000).

Age distribution of adult male U.S. residents,
by veteran status, 2004
Percent
50%

Veterans

40%

30%

Nonveterans

*See Methodology for veteran population estimates. In this report, veteran
refers to any person who served in the U.S. Armed Forces.
20%

10%

0%

18-24

25-34

35-44

45-54
Age

Figure 2

2 Veterans in State and Federal Prison, 2004

55-64

65 or
older

U.S. Army accounted for 46% of veterans living in the
U.S., but 56% of veterans in State prison in 2004

Half of incarcerated veterans performed wartime
military service; 1 in 5 reported combat duty

While veterans held in State prison in 2004 represented all
branches of the U.S. Armed Forces, Army veterans were
over-represented in prison. The VA estimated that 46% of
veterans living in the U.S. during 2004 had served in the
Army, but 56% of veterans in State prison were Army veterans. By contrast, Air Force veterans accounted for 18% of
all veterans in the U.S., but 9% of veterans in State prison.

Although a majority of incarcerated veterans served during
a wartime period, a much lower percentage reported seeing
combat duty. In 2004 most State prison veterans (54%)
reported service during a wartime era, while 20% saw combat duty. In Federal prison two-thirds of veterans had served
during wartime, and a quarter had seen combat.

Branch of service
Army
Navy
Air Force
Marine Corps
Other*

Percent of veterans, 2004
U.S. residents
State prisoners
46%
23
18
10
3

56%
22
9
14
2

Note: State prison estimates sum to more than 100%
because some inmates served in more than one branch.
See Appendix table 1 for data on Federal prisoners.
*Includes Coast Guard veterans and reservists without
active duty service in regular military.

Vietnam-era veterans were the largest group of wartime
service veterans in both State (36%) and Federal prison
(39%). These percentages have been nearly stable since
1997. The percentage of veterans reporting service during
the Persian Gulf War-era (1990 to 1991) was stable in State
prison (14% in 2004, 12% in 1997), but grew from 13% to
21% of veterans in Federal prison over this period.
Service during either World War II or the Korean conflict
was reported by 2% of State and 3% of Federal prison
veterans in 2004, compared to 4% and 6%, respectively in
1997. Fewer than 5% of veterans held in either State or
Federal prison in 2004 reported service during the
Afghanistan and Iraq War-era (2002 to 2004).

Number of active-duty personnel held in military prison declining; sexual assault most common offense
According to data reported by the U.S. Department of
Defense (DoD), the number of active-duty military
personnel held in military correctional facilities fell
22% between 1994 and 2004. These facilities hold
military personnel whose offenses fell under the
Uniform Code of Military Justice rather than civilian
jurisdiction. These counts do not include prisoners of
war or enemy combatants captured during military
operations.
The drop in military prisoners outpaced the decline in
the number of active-duty personnel. As a result, the
military incarceration rate declined from 174 prisoners
per 100,000 active-duty personnel in 1994 to 153 per
100,000 in 2004. The rate of incarceration varied
widely by branch of service. The Navy and Air Force
had the lowest rates over this period, while the Marine
Corps had the highest rate. By 2004 the Marine
Corps’ incarceration rate had dropped 34% from its
2000 peak, but remained the highest of all the
services.
Rape or sexual assault (29%) was the most common
offense for which active-duty personnel were held in
DoD custody. Violent offenses accounted for half
(46%) of all inmates, followed by drug (22%) and
military offenses (14%).

Number of prisoners Incarceration rate, per 100,000 personnel
in military custody,
Marine Air
at yearend
Total
Army
Navy Corps Force

Year
1994
1996
1998
2000
2002
2004

2,800
2,747
2,426
2,420
2,377
2,177

174
187
172
175
168
153

/
225
178
164
177
171

/
109
102
127
127
110

/
392
394
421
325
279

/
125
132
116
122
106

/Not reported.
Source: U.S. Department of Defense. See Methodology for details.

Prisoners in military custody, by most serious offense, 2004
Offense type
Violent*
Sexual assault
Homicide
Property
Military
Drugs
Public-order/other
0%

10%

20%

30%

40%

50%

Percent of prisoners
*Violent is comprised of sexual assault,
homicide, and other categories not shown.

Veterans in State and Federal Prison, 2004 3

Veterans were older, better educated than other State
and Federal prison inmates
Veterans differed from nonveteran prisoners on a variety of
measures. Half of veterans in State prison were white nonHispanics, compared to a third of nonveteran inmates. The
median age (45) of veterans in State prison was 12 years
older than that of nonveterans (33). Nonveteran inmates
(55%) were nearly 4 times more likely than veterans (14%)
to be under the age of 35.
Veterans in State prison were more likely to have been married at one time (74%) than nonveterans (40%), although
the percentage of currently married inmates was much
more similar (22% of veterans, 16% of nonveterans). Veterans (43%) were over twice as likely as other State prisoners
(17%) to be divorced.
Veterans were also much better educated than other prisoners. Nearly all veterans in State prison (91%) reported at
least a high school diploma or GED. An estimated 40% of
nonveterans lacked either. The rate of college attendance
among veterans in State prison (1 in 3) was triple that of
nonveterans (1 in 10).
Veterans and nonveterans in Federal prison differed on
many of the same measures as State prisoners. Veterans in
Federal prison were twice as likely as nonveterans to be
white non-Hispanics or to have attended college. Nearly
80% of veterans in Federal prison had been married at one
time, compared to half of nonveterans.
Selected
characteristics
White, non-Hispanic
Divorced
Attended college
Median age

Percent of Federal
prisoners, 2004
Veterans Nonveterans
49%
43
42
46 yrs.

24%
18
20
34 yrs.

Note: See Appendix table 3 for more detail.

Nearly 1 in 4 veterans in State prison were sex
offenders, compared to 1 in 10 nonveterans
While veterans had lower prison incarceration rates than
nonveterans, veterans were more likely than other prisoners
to report serving time for a violent offense. A majority of veterans in State prison (57%) were serving time for violent
offenses, including over a third who were serving sentences
for homicide (15%) or rape/sexual assault (23%). Fewer
than half of nonveterans in State prison (47%) were violent
offenders, with 1 in 5 held for homicide (12%) or rape/sexual
assault (9%). Veterans (15%) were also less likely to be
drug offenders than other State prisoners (22%).

4 Veterans in State and Federal Prison, 2004

A fifth of veterans in Federal prison (19%) were serving time
for a violent offense, compared to 14% of nonveterans. The
percentage serving time for rape/sexual assault was 3% of
veterans and 1% of nonveterans. Most nonveterans in Federal prison (56%) were drug offenders; 46% of veterans in
Federal prison were serving drug sentences.
Veterans were more likely than other violent offenders
in State prison to have victimized females and minors
Among violent offenders, 60% of veterans reported
victimizing only females during their current crime,
compared to 41% of nonveterans. Veterans were also more
likely than other violent offenders in State prison to report
victimizing a minor. A quarter of violent offenders without
prior military service said that at least one of their victims
was under age 17. Among veterans the percentage was
40%. In particular, veterans (20%) were twice as likely as
nonveterans (10%) to report a victim under age 13.
Percent of violent State
prisoners, 2004
Veterans
Nonveterans
Only female victim(s)
Minor victim(s)
Knew victim(s)
Relative
Used a weapon

60%
40
71
25
29

Estimated number of
inmates

73,200

41%
24
54
11
38
514,200

Note: See Appendix table 6 for more detail.

Over two-thirds of veterans reported that they knew the
victim of their violent crime. Among nonveterans, half knew
their victim. While veterans were no more likely than other
violent offenders in State prison to have victimized an
intimate partner, friend or acquaintance, the percentage
who said they victimized a relative (25%) was twice that
reported by nonveterans (11%).
Veterans had shorter criminal histories than
nonveterans in State prison
Veterans in State prison had shorter criminal histories than
their nonveteran counterparts. Nearly a third of veterans
and a quarter of nonveterans were first-time offenders. At
the time of arrest, 33% of veterans were on probation or
parole, while 44% of nonveterans had some type of prior
criminal justice status. Fewer veterans (35%) than nonveterans (44%) reported at least 3 prior sentences to incarceration or probation.

More than a third of veterans in State prison had
maximum sentences of at least 20 years, life, or death

Veterans were less likely than nonveteran prisoners to
have used drugs

On average veterans reported longer prison sentences and
expected to serve more time than nonveterans. The average maximum sentence reported by veterans in State
prison (147 months) was at least 2 years longer than that of
nonveterans (119 months). A quarter of veterans (24%) in
State prison reported a maximum sentence of at least 20
years, and 13% received a life or death sentence. Nonveterans were less likely to report a sentence of at least 20 years
(17%) or a life or death sentence (8%).

Veterans (75%) in State prison reported past drug use less
often than nonveterans (84%). Recent drug use showed
greater differences — 42% of veterans used drugs in the
month before their offense, compared to 58% of nonveterans. At the time of the offense, a quarter of veterans and a
third of nonveterans were under the influence of drugs. The
types of drugs used most commonly by each group were
the same. Marijuana use was reported most often, followed
by cocaine (including crack) and stimulants (including methamphetamines).

Veterans in State prison expected to serve an average of 22
months longer than nonveterans (112 months compared to
90 months). On average both veterans and nonveterans
expected to serve three-quarters of their maximum sentence in prison.

Reported prior drug use

Veterans reported longer average sentences than nonveterans, regardless of offense type
The longer sentences reported by veterans were not
entirely the result of violent offenses. Veterans of all offense
types reported longer sentences than nonveterans. The difference was largest among violent offenders (on average,
28 months), but among property and public-order offenders,
veterans’ sentences averaged nearly 2 years longer than
nonveterans.

Most serious offense

Mean maximum sentence length,
State prisoners, 2004
Veterans
Nonveterans

Violent
Homicide
Rape/sexual assault
Robbery
Assault
Property
Drug
Public-order

232 mos.
326
236
221
164
122
100
96

204 mos.
308
208
198
138
100
88
74

Note: Excludes inmates sentenced to life or death.

Federal inmates reported less variation in sentencing based
on veteran status. On average sentences reported by veterans were less than a year longer than nonveterans. The
percentage of veterans (22%) who reported a sentence of
at least 20 years, life or death was similar to that reported by
nonveterans (17%). The average total time expected to be
served by veterans and nonveterans differed by 6 months.
Federal prisoners, 2004
Veterans Nonveterans
Mean maximum sentence
Mean time to be served*

138 mos.
112

127 mos.
106

Note: See Appendix table 8 for more detail.
*Expected time to be served on current sentence.

Ever

In month
before offense
Nonveterans

At time
of offense

Veterans

0%

20%
40%
60%
80%
Percent of State prisoners

100%

Figure 3

Drug use reported by Federal prisoners showed less variation by veteran status. Forty-three percent of veterans and
51% of nonveterans reported drug use in the month before
the offense. A quarter of each group reported using drugs at
the time of the offense.
While veterans generally reported lower rates of prior drug
use, they were more likely than nonveterans to report having used intravenous (IV) drugs at some time. Among State
prisoners, 24% of veterans and 17% of nonveterans
reported past IV drug use. In Federal prison, 17% of veterans and 11% of nonveterans reported intravenous drug use.
No relationship between veteran status and alcohol
dependence or abuse
The 2004 survey included an alcohol and drug use assessment tool which was based on criteria defined in the Diagnostic and Statistical Manual of Mental Disorders, fourth edition (DSM-IV). Using this tool, no relationship between
veteran status and alcohol dependence or abuse was
found. Nearly equal percentages of veterans (43%) and
nonveterans (44%) in State prison met the DSM-IV criteria
for alcohol dependence or abuse in the 12 months prior to
their prison admission. Based on DSM-IV criteria for drug
use, veterans (43%) were less likely than other State prisoners (55%) to be dependent on or abusing illicit drugs.

Veterans in State and Federal Prison, 2004 5

Among Federal prisoners veteran status was unrelated to
both alcohol and drug dependence or abuse. Equal percentages of veterans and nonveterans met the DSM-IV criteria
for either alcohol or drug abuse or dependence.
Percent of prisoners meeting
criteria for dependence or abuse
Alcohol
Drug
Any substance
State prisoners
Veterans
Nonveterans
Federal prisoners
Veterans
Nonveterans

43%
44

43%
55

61%
67

36%
36

46%
45

57%
56

Veteran status unrelated to inmate reports of mental
health problems
Similar percentages of veteran (54%) and nonveterans
(56%) in State prison met one of two criteria for a recent
mental health problem — a recent history of mental health
services or a report of recently experiencing symptoms of a
mental health disorder. The symptoms were measured
according to criteria defined in the DSM-IV.

Veterans in State prison (45%) were slightly less likely than
nonveterans (50%) to report symptoms of mental health disorders in the last 12 months. These disorders included
mania and psychotic disorders, as well as a major depressive episode. Among Federal prisoners, 35% of veterans
and 40% of nonveterans reported these symptoms.
Despite experiencing fewer symptoms of mental health disorders, veterans (30%) were more likely than other State
prisoners (24%) to report a recent history of mental health
services. These services included an overnight hospital stay
for a mental health problem, the use of prescribed medications, a diagnosis by a mental health professional, and participation in mental health therapy.
Veterans may be more likely to have received mental health
services for a variety of reasons. This difference may be
partially explained by veterans’ access to VA services in the
community which are not available to nonveterans. However, VA services may not be available to those veterans
who failed to receive an honorable discharge (38% of veterans in State prison). It may also be that the symptoms
reported by veteran inmates were more severe than those
experienced by nonveterans. Given that veterans had a
median age 12 years older than nonveterans, it is also possible that they have had more opportunities for a diagnosis.

Despite generational differences, Vietnam-era and post-Cold War veterans in prison had similar backgrounds
Despite a median age gap of nearly 20 years, there
was little measurable difference between State
prisoners who served in the military during the
Vietnam-era and those who enlisted after the close of
the Cold War (1990 or later).
While Vietnam-era veterans outnumbered post-Cold
War veterans by 2-to-1, they were in State prison for
the same types of crimes. Nearly equal percentages of
Vietnam-era veterans (61%) and post-Cold War
veterans (57%) were serving a sentence for a violent
offense. The percentage serving sentences for drug
crimes were also nearly identical (13% of Vietnam-era
veterans, 12% of post-Cold War veterans).
Drug use patterns were also similar for both
generations of military veterans. Around 40% of each
group reported using drugs in the month before their
offense, while a fifth of each group said they committed
their current offense while under the influence of drugs.
The overall level of substance abuse or dependence
(about 60%) was similar among each groups of
veterans.
While a majority post-Cold War veterans in State
prison (57%) reported indications of a recent mental
health problem, compared to 48% of Vietnam-era
veterans, this difference was not statistically
significant.

6 Veterans in State and Federal Prison, 2004

Percent of veterans in State
prison, by service era, 2004
Vietnam-era Post-Cold War
(1964-1973) (1990-2004)

Selected
characteristics
Age (median)

53 yrs.

35 yrs.

Current offense
Violent
Property
Drug
Public-order

60.7%
13.0
12.6
13.7

57.4%
17.0
11.9
13.7

Prior drug use
Ever used
Used in the month before the offense
Under influence at time of the offense

71.7%
37.1
21.0

72.0%
44.2
19.9

Prior alcohol abuse
Regularly used
Under influence at time of the offense

70.4%
32.6

66.4%
24.6

Substance dependent or abusinga

58.7%

62.1%

47.9%

56.7%

b

Any mental health problem

Estimated number of prisoners
aMeasures

43,400

20,200

are shown in detail in Substance Dependence, Abuse, and
Treatment of Jail Inmates, 2002 <http://www.ojp.usdoj.gov/bjs/abstract/
sdatji02.htm>.
b
Measures are shown in detail in Appendix table 12. Also, see Mental
Health Problems of Prison and Jail Inmates <http://www.ojp.usdoj.gov/
bjs/abstract/mhppji.htm>.

Combat service not related to prevalence of recent
mental health problems
In terms of mental health histories, there was little difference
between combat veterans and noncombat veterans in State
prison. Just over half of both combat and noncombat veterans reported any history of mental health problems. A third
of both groups had a recent history of mental health services, of which therapy was the most common (20% of combat veterans, 22% of other veterans). Reports of recent
symptoms of mental health disorders were also similar for
both groups (40% of combat veterans, 45% of other veterans). Mania disorder was the most commonly reported disorder among both combat (33%) and noncombat (40%) veterans.
Percent of veterans
in State prison, 2004
Combat Noncombat
Any mental health problem

52%

55%

Recent history of mental health servicesa
Mental health therapy in year before arrest
Symptoms of mental health disordersb
Mania disorder

31%
20
40%
33

30%
22
45%
40

Estimated number of inmates

25,400

102,100

Note: See Appendix table 12 for details on these measures.
aIn 12 months before arrest or at any time since admission.
b
In 12 months prior to interview.

Methodology
Data in this report were based on personal interviews with
prisoners, conducted through the Survey of Inmates in State
and Federal Correctional Facilities, 2004. Conducted every
5 or 6 years since 1974 (Federal facilities were added for
the first time in 1991), the inmate surveys are the only
national source of detailed information on criminal offenders, including special populations such as military veterans.
Detailed descriptions of the methodology and sample
design of the surveys can be found in: Drug Use and
Dependence, State and Federal Prisoners, 2004 <http://
www.ojp.usdoj.gov/bjs/abstract/dudsfp04.htm>, and Mental
Health Problems of Prison and Jail Inmates <http://
www.ojp.usdoj.gov/bjs/abstract/mhppji.htm>. For generalized standard errors for the survey estimates presented in
this report, see Appendix tables 13 and 14, available on the
BJS website at <http:www.ojp.usdoj.gov/bjs/abstract/
vsfp04.htm>.
Estimates of the veteran population in the United States

Center (DMDC), and projections of separations from activeduty service generated by DoD’s Office of the Actuary.
Incarceration rates for 1985 include veterans residing in
Puerto Rico. (In 1990 VA estimated that 5.5% of veterans
lived in Puerto Rico; in 2000 the estimate was 5.4%.) For
more information on veteran population estimates and projections, see the VA Office of Policy veteran data web page
<http://www1.va.gov/vetdata/>.
The U.S. Department of Labor also estimates the number of
veterans living in the U.S. based on its Current Population
Survey (CPS), which is a monthly household survey of
about 60,000 U.S. households. Data on veteran status was
collected in a biannual supplement to the August CPS collection, most recently collected in 2005. In August 2005 the
CPS produced an estimate of 23,402,000 veterans in the
U.S. resident population which was 3% lower than the VA
estimate of 24,128,000 for September 2005.
The VA and CPS estimates also differ slightly in their definition of the term veteran. The VA estimates exclude persons
who were dishonorably discharged from their military service. CPS estimates of veterans include all persons reporting active-duty service in the U.S. Armed Forces, regardless
of discharge type. Both the VA and CPS estimates only
include reservists who were called to active-duty. BJS
defines veterans the same way as the CPS, and include all
reserve-duty veterans.
Military prison statistics
In 1994 the DoD Corrections Council established an annual
military confinement report. The council, comprising representatives from each branch of military service, adopted a
standardized questionnaire with a common set of definitions. With the Corrections Council, BJS produced a series
of tables that provide a unified profile of U.S. military personnel under the custody of U.S. military authorities. These
counts include all U.S. military correctional facilities, including those located outside of the United States. Prisoners of
war or enemy combatants held in U.S. military custody are
not included in this collection.
Until 1998 these tables were included in Correctional Populations in the United States, a discontinued series. For the
1998 edition of this report please see <http://
www.ojp.usdoj.gov/bjs/abstract/cpusst.htm>. Since 1999
the counts of U.S. military personnel held in military facilities
have been presented in the annual Prisoners bulletin series.
See Prisoners in 2005 <http://www.ojp.usdoj.gov/bjs/
abstract/p05.htm>.

This report includes incarceration rates for veteran and nonveteran adults in the U.S. population. These rates were calculated based on estimates of the veteran population generated by the VA Office of Policy, Planning and Preparedness.
To estimate the size of the veteran population in the U.S.,
the VA uses the Veteran Population Model which incorporates data on military service from the decennial U.S. Census, discharge data from the DoD Defense Manpower Data
Veterans in State and Federal Prison, 2004 7

U.S. Department of Justice
Office of Justice Programs
Bureau of Justice Statistics

*NCJ~217199*

PRESORTED STANDARD
POSTAGE & FEES PAID
DOJ/BJS
Permit No. G-91

Washington, DC 20531

Official Business
Penalty for Private Use $300

This report in portable document
format and in ASCII and its related
statistical data and tables are
available at the BJS World Wide
Web Internet site: <http://
www.ojp.usdoj.gov/bjs/abstract/
vsfp04.htm>

Office of Justice Programs
Innovation • Partnerships • Safer
Neighborhoods

8 Veterans in State and Federal Prison, 2004

The Bureau of Justice Statistics is
the statistical agency of the U.S.
Department of Justice. Jeffrey L.
Sedgwick is director.
This Special Report was written by
Margaret E. Noonan and
Christopher J. Mumola, under the
supervision of William J. Sabol.
Laura M. Maruschak, Lauren E.
Glaze, Tracy L. Snell and William
J. Sabol verified the report. Tina
Dorsey and Carolyn C. Williams of
BJS produced and edited the
report, assisted by Joanna
Bradford. Jayne Robinson
prepared the report for final
printing, under the supervision of
Doris J. James.

Tracy L. Snell, under the
supervision of Allen J. Beck, was
project manager for the Survey of
Inmates in State and Federal
Correctional Facilities. For a listing
of U.S. Census Bureau offices and
staff responsible for carrying out
the Survey, see Drug Use and
Dependence, State and Federal
Prisoners, 2004 <http://www.ojp.
usdoj.gov/bjs/abstract/dudsfp04.
htm>.
May 2007, NCJ 217199

Appendix table 1. Military service of veterans in State and Federal prison
Percent of veterans in prison
State
Federal
2004
1997
2004
1997
In which branch of the U.S.
Armed Forces did you serve?a
Army
Navy
Marine Corps
Air Force
Coast Guard
Otherb

56.1%
21.9
14.3
8.6
1.0
0.9

58.6%
17.2
15.6
8.9
0.9
1.3

56.2%
17.3
17.5
10.6
0.5
0

58.4%
14.0
16.2
11.9
0.5
1.2

During your service, did you see
combat in a combat or line unit?
Yes
No

19.9%
80.1

20.1%
79.9

25.7%
74.3

20.2%
79.8

Length of military service
12 months or less
13-24 months
25-36 months
37-60 months
61 months or longer

15.4%
21.5
21.5
20.1
21.5

14.6%
19.2
25.0
21.1
20.0

9.0%
19.8
20.7
25.1
25.4

10.3%
19.5
25.7
24.4
20.0

Mean length of service
Type of discharge
Honorable
General, honorable conditions
General, without honorable
conditions
Other than honorablec
Bad conduct
Dishonorable
Otherd
Estimated number of veterans

46 mos.

45 mos.

53 mos.

48 mos.

61.6%
16.9

59.0%
17.0

65.3%
15.9

65.4%
15.3

3.1
8.8
3.0
2.8
3.7

7.3
4.4
2.9
2.8
6.6

1.9
6.4
2.5
5.6
2.4

5.7
5.6
1.4
2.2
4.5

127,500

134,400

12,500

14,800

aDetail

adds to more than 100% because veterans may have served in more than one branch of
the U.S. Armed Forces.
b
Includes National Guard or reserve service in an unspecified branch of the U.S. Armed Forces.
cIncludes discharges listed as “undesirable.”
d
Includes cases where the nature of the discharge was known, such as entry-level and medical
separations, but the type of discharge was unknown.

Appendix table 2. Wartime service of veteran inmates

Time of military service
Peacetime
Wartime
World War II (1941-45) or Korean conflict era (1950-53)
Vietnam War era (1964-1973)
Persian Gulf War (1990-1991)
Afghanistan/Iraq (2002-2004)

Percent of veterans inmates
State
Federal
2004
1997
2004
1997
45.8%
54.2

50.3%
49.7

35.5%
64.5

39.0%
61.0

2.4
35.6
14.0
3.7

4.2
35.3
11.7
~

3.4
39.4
20.9
4.5

5.8
43.3
12.9
~

Note: Veterans may have served during more than one period of wartime.
~Not applicable.

Veterans in State and Federal Prison, 2004 9

Appendix table 3. Selected characteristics of State and Federal prisoners,
by veteran status, 2004
Percent of veterans in prison, 2004
State
Federal
Veterans
Nonveterans
Veterans
Nonveterans
Gender
Male
Female

99.0%
1.0

92.6%
7.4

98.8%
1.2

92.4%
7.6

Race/Hispanic origin
White non-Hispanic
Black non-Hispanic
Hispanic
Other*

54.1%
32.1
6.2
7.7

33.1%
41.5
19.6
5.8

49.0%
37.6
5.3
8.0

23.6%
44.1
27.3
5.1

Age
24 or younger
25-34
35-44
45-54
55 or older

2.7%
11.0
35.0
33.1
18.2

19.0%
35.6
30.0
11.9
3.5

1.2%
19.1
24.3
32.9
22.4

9.9%
40.5
29.4
15.4
4.8

Median

45 yrs.

33 yrs.

46 yrs.

34 yrs.

Marital status
Married
Widowed
Divorced
Separated
Never married

22.1%
3.6
42.7
6.1
25.5

15.8%
1.8
17.0
5.0
60.4

25.0%
3.6
43.5
5.5
22.4

26.1%
0.9
17.7
5.1
50.2

Education completed
8th grade or less
Some high school
GED
High school graduate
Some college or more

2.6%
6.3
29.8
28.6
32.6

13.3%
26.9
34.6
15.6
9.7

1.9%
4.5
21.6
30.4
41.6

11.3%
17.6
34.1
17.4
19.6

*Excludes persons of Hispanic origin. Includes Asians, American Indians, Alaska Natives,
Native Hawaiians, other Pacific Islanders, and inmates who specified more than one race.

10 Veterans in State and Federal Prison, 2004

Appendix table 4. Current offense of State and Federal prisoners,
by veteran status, 2004
Percent of veterans in prison, 2004
State
Federal
Veterans
Nonveterans
Veterans
Nonveterans

Current offense
Violent offenses
Homicidea
Sexual assaultb
Robbery
Assault
Other violent

57.4%
14.9
22.5
8.4
9.0
2.6

46.8%
11.8
9.4
13.1
10.3
2.2

19.0%
3.2
3.3
10.3
2.0
0.4

14.1%
2.3
0.6
8.3
2.0
0.8

Property offenses
Burglary
Larceny
Motor vehicle theft
Fraud
Other propertyc

15.6%
6.4
3.9
1.2
2.7
1.3

19.1%
8.4
3.9
1.8
2.9
2.2

10.5%
0
0.6
0
9.0
0.9

6.1%
0.5
0.4
0.4
4.2
0.6

Drug offenses
Possession
Trafficking
Other drug

15.0%
5.6
9.0
0.4

22.1%
6.0
15.5
0.6

46.3%
0.9
44.8
0.6

56.2%
3.2
51.1
2.0

Public-order offenses
Weapons
Other public-order

12.0%
0.9
11.1

11.8%
2.7
9.2

22.9%
12.2
10.7

20.2%
10.8
9.4

0.0%

0.2%

1.3%

3.4%

Other/unspecified

Note: Details may not add to total due to rounding.
aIncludes murder and manslaughter.
b
Includes rape and other sexual assault.
cIncludes stolen property and arson.

Appendix table 5. Offenders in military
correctional facilities, 1997 and 2004

Type of offense

Percent of prisoners in
military facilities
2004
1997

Violent
Homicidea
Rape
Other sexual assault
Robbery
Assault
Other violentb

46.2%
7.6
12.5
16.6
0.9
7.2
1.4

52.2%
11.1
15.8
14.8
1.7
8.6
0.3

Property
Drug
Public-order
Military offensesc
Other

13.1%
21.7
1.6
14.4
3.0

17.2%
20.2
1.7
7.6
1.2

Number of prisonersd

1,916

2,466

aIncludes

negligent and other types of manslaughter.
b
Includes kidnapping.
c
Includes desertion, AWOL, disrespect,
insubordination, failure to obey, false offense
statement, conduct unbecoming an officer,
and other infractions.
d
Excludes unconvicted inmates.
Source: U.S. Department of Defense Corrections Council.

Veterans in State and Federal Prison, 2004

11

Appendix table 6. Victim characteristics and use of weapon,
by veteran status of violent State prisoners, 2004
Percent of violent State prisoners
Veterans
Nonveterans
Gender of victim(s)
Male
Female
Both males and females

33.3%
60.4
6.3

48.6%
40.9
10.5

Age of youngest victim
12 or younger
13-17
18-24
25-34
35-54
55 or older

19.9%
20.2
12.8
20.5
22.6
4.0

10.1%
14.3
20.1
25.9
24.5
5.2

Victim-offender relationship
Knew victima
Relative
Intimateb
Friend/acquaintance
Otherc
Knew none of the victims

70.9%
25.1
12.0
24.9
5.8
29.1

54.3%
10.9
10.2
24.1
6.1
45.7

Use of a weapon
Yes
29.5%
No
70.5
Note: Details may not add to total due to rounding.
a
More than one victim may have been reported.
bIncludes (ex-)spouse, (ex-)boyfriend, and (ex-)girlfriend.
c
Includes those known by sight only.

37.8%
62.2

Appendix table 7. Criminal history of State and Federal prisoners,
by veteran status, 2004
Percent of veterans in prison, 2004
State
Federal
Veterans
Nonveterans
Veterans Nonveterans
Status at time of current arrest
None
Status
On parole
On probation
Escape

67.2%
32.8
16.6
15.8
0.3

55.7%
44.3
18.9
24.9
0.4

75.6%
24.4
11.4
12.6
0.5

72.8%
27.2
12.5
14.3
0.4

Criminal history
None
Prior
Violent recidivistsa
Drug recidivists only
Other recidivistsb

29.8%
70.2
42.6
2.0
25.6

22.8%
77.2
44.0
3.6
29.7

40.0%
60.0
23.1
7.4
29.5

34.7%
65.3
25.6
8.5
31.1

Number of prior probation/
incarceration sentences
0
1
2
3-5
6-10
11 or more

31.7%
16.1
17.5
18.3
11.2
5.4

24.8%
15.4
15.7
25.9
12.5
5.7

41.7%
17.6
13.7
19.6
6.0
1.4

36.0%
15.6
15.3
20.9
8.6
3.7

Note: Details may not add to total due to rounding.
with at least one current or past violent offense.
b
Includes recidivists with unknown offense types.
aRecidivists

12 Veterans in State and Federal Prison, 2004

Appendix table 8. Maximum sentence length and time to be served until release,
by veteran status, State and Federal prisoners, 2004
Percent of veterans in prison, 2004
State
Federal
Veterans
Nonveterans
Veterans
Nonveterans
Maximum sentence length
Less than 12 months
12-35 months
36-59 months
60-119 months
120-179 months
180-239 months
240 or longer months
Life/death
Meana
Total time to be served on current sentenceb
Less than 24 months
24-47 months
48-71 months
72-119 months
120-179 months
180-239 months
240 or longer months
No release expected
Don't know
Meanc

2.9%
9.8
9.6
20.1
12.1
8.3
24.0
13.2
147 mos.

10.9%
13.8
20.1
15.0
11.7
6.0
12.0
5.4
5.2
112 mos.

3.5%
14.8
14.1
23.2
11.9
7.8
16.7
8.1
119 mos.

16.7%
18.7
18.6
14.0
9.4
5.2
7.4
3.1
6.8
90 mos.

0.9%
16.4
9.3
22.9
18.7
9.6
19.1
3.1

1.6%
10.5
13.7
26.6
20.2
9.9
14.7
2.8

138 mos.

127 mos.

9.0%
9.9
11.5
22.1
14.4
6.7
6.8
2.4
17.1

5.9%
13.7
16.7
18.3
13.5
5.8
6.6
1.6
17.9

112 mos.

106 mos.

aExcludes

sentences to life or death.
on time served when interviewed, plus time remaining to be served until the expected
date of release.
c
Excludes inmates who do not expect to be released.
bBased

Veterans in State and Federal Prison, 2004

13

Appendix table 9. Drug use of State and Federal prisoners, by type of drug
and veteran status, 2004
Percent of inmates who reported
Using drugs in the month
Using drugs at the time
Ever using drugs
before offense
of the offense
Veterans Nonveterans
Veterans Nonveterans
Veterans Nonveterans
State prisoners
Any druga
Marijuana/hashish
Cocaine/crack
Heroin/opiates
Depressantsb
Stimulantsc
Methamphetamines
Hallucinogensd
Inhalants

74.5%
69.9
46.6
25.5
25.8
34.5
26.6
32.8
14.8

84.3%
78.5
46.9
23.2
20.8
27.9
23.1
32.9
13.5

42.5%
25.7
18.7
7.2
4.8
11.9
10.4
2.6
1.0

57.6%
42.0
21.8
8.3
5.4
12.2
10.9
6.3
1.0

23.6%
8.3
10.9
3.4
1.7
6.0
5.0
1.1
/

33.1%
16.2
11.9
4.5
2.1
6.8
6.2
2.1
/

Federal prisoners
Any druga
Marijuana/hashish
Cocaine/crack
Heroin/opiates
Depressantsb
Stimulantsc
Methamphetamines
Hallucinogensd
Inhalants

75.5%
71.8
46.4
20.8
21.0
26.5
20.4
24.7
9.2

79.2%
71.2
43.0
17.6
16.4
20.4
17.6
26.0
7.3

42.6%
29.0
15.8
4.8
1.1
13.8
12.6
2.3
0.8

51.1%
37.1
18.2
5.9
4.8
10.5
9.8
6.2
0.9

24.2%
9.5
6.6
4.2
0.6
7.9
7.9
0.8
/

26.7%
14.4
7.5
3.1
1.5
7.4
7.1
2.0
/

/Not reported.
aOther unspecified drugs are included in the totals.
b
Includes barbiturates, tranquilizers, and quaaludes.
cIncludes amphetamine and methamphetamine.
dIncludes LSD, PCP, and ecstasy.

Appendix table 10. Alcohol use histories of State and Federal prisoners,
by veteran status, 2004

Self-report of alcohol use
Regularly used alcohol
Used alcohol at time of offense
Binge drinking*

Percent of prisoners, 2004
State
Federal
Veterans
Nonveterans
Veterans
Nonveterans
69.7%
31.1
38.8

63.0%
31.1
37.2

66.3%
18.5
34.3

60.9%
17.9
30.6

*Binge drinking is defined as having consumed as much as a fifth of liquor in a single day, equivalent to 20 drinks, 3 bottles of wine, or as many as 3 six-packs of beer.

14 Veterans in State and Federal Prison, 2004

Appendix table 11. Substance abuse treatment history of State and Federal
prisoners, by veteran status, 2004
Percent of substance abuse treatment in prison
State
Federal
Veterans
Nonveterans
Veterans Nonveterans
Ever any treatment or programs
Any treatment
Other alcohol/drug programs

55.3%
30.4
46.3

57.4%
31.1
46.2

51.5%
26.7
40.4

51.7%
24.2
42.3

Participation while under correctional
supervision
Any treatment
Other alcohol/drug programs

46.8%
21.6
40.4

49.9%
24.4
41.1

43.5%
19.1
34.0

45.7%
19.5
39.0

Participated since admission
Any treatment
Residential facility or unit
Counseling by a professional
Detoxification unit
Maintenance drug

32.4%
10.2
5.8
5.2
0.5
0.3

34.3%
11.2
7.2
4.8
0.7
0.2

30.5%
9.8
5.2
4.7
0.0
0.0

34.2%
10.3
5.7
4.9
0.6
0.2

Other alcohol/drug programs
Self-help group/peer counseling
Education program

28.9%
22.6
14.5

29.9%
23.7
14.1

24.4%
12.3
16.1

29.9%
16.1
21.0

Appendix table 12. Recent history and symptoms of mental health problems
among State and Federal prisoners, by veteran status, 2004
Percent of inmates in prison
State
Federal
Veterans Nonveterans Veterans Nonveterans

Mental health problem
Any mental health problem

54.4%

56.5%

42.9%

45.0%

Recent history of mental health
Told had disorder by mental health professional
Had overnight hospital stay
Used prescribed medications
Had professional mental health therapy

29.9%
11.6
8.5
23.0
21.1

23.6%
9.2
5.1
17.4
14.4

20.7%
9.6
3.6
16.1
11.4

13.0%
4.9
1.9
9.6
8.0

Symptoms of mental health disordersb
Major depressive episode
Mania disorder
Psychotic disorder

44.7%
23.3
38.1
13.6

49.7%
23.6
43.8
15.6

35.0%
17.0
31.2
5.7

40.2%
15.9
35.5
10.6

servicesa

Note: Measures of recent mental health problems were based on criteria defined in the Diagnostic
and Statistical Manual of Mental Disorders, fourth edition (DSM-IV). See Mental Health Problems of
Prison and Jail Inmates <http://www.ojp.usdoj.gov/bjs/abstract/mhppji.htm>.
a
In year before arrest or at any time since admission.
b
In 12 months prior to interview.

Veterans in State and Federal Prison, 2004

15

Appendix table 14. Standard errors of the estimated
percentages, Federal prison inmates, 2004

Appendix table 13. Standard errors of the estimated
percentages, State prison inmates, 2004
Base of the
estimate

98 or 2

1,000
2,000
2,500
5,000
10,000
20,000
30,000
50,000
100,000
127,522a
200,000
400,000
600,000
800,000
1,098,649b
1,226,200

7.14
5.05
4.52
3.20
2.26
1.60
1.30
1.01
0.71
0.63
0.51
0.36
0.29
0.25
0.22
0.20

Estimated percentages
90 or 10 80 or 20 70 or 30 60 or 40
15.31
10.83
9.68
6.85
4.84
3.42
2.80
2.17
1.53
1.36
1.08
0.77
0.63
0.54
0.46
0.44

20.41
14.43
12.91
9.13
6.46
4.56
3.73
2.89
2.04
1.81
1.44
1.02
0.83
0.72
0.62
0.58

23.39
16.54
14.79
10.46
7.40
5.23
4.27
3.31
2.34
2.07
1.65
1.17
0.95
0.83
0.71
0.67

25.00
17.68
15.81
11.18
7.91
5.59
4.56
3.54
2.50
2.21
1.77
1.25
1.02
0.88
0.75
0.71

50
25.52
18.04
16.14
11.41
8.07
5.71
4.66
3.61
2.55
2.26
1.80
1.28
1.04
0.90
0.77
0.73

Base of the
estimate
200
500
1,000
2,000
5,000
7,500
9,063
12,500a
15,000
25,000
40,000
50,000
75,000
100,000
116,796b
129,300

98 or 2
10.01
6.33
4.47
3.16
2.00
1.63
1.49
1.27
1.16
0.89
0.71
0.63
0.52
0.45
0.41
0.39

Estimated percentages
90 or 10 80 or 20 70 or 30 60 or 40
21.44
13.56
9.59
6.78
4.29
3.50
3.19
2.71
2.48
1.92
1.52
1.36
1.11
0.96
0.89
0.84

28.59
18.08
12.79
9.04
5.72
4.67
4.25
3.62
3.30
2.56
2.02
1.81
1.48
1.28
1.18
1.12

32.75
20.71
14.65
10.36
6.55
5.35
4.87
4.14
3.78
2.93
2.32
2.07
1.69
1.46
1.36
1.29

35.01
22.14
15.66
11.07
7.00
5.72
5.20
4.43
4.04
3.13
2.48
2.21
1.81
1.57
1.45
1.38

50
35.74
22.60
15.98
11.30
7.15
5.84
5.31
4.52
4.13
3.20
2.53
2.26
1.85
1.60
1.48
1.41

aThe

total weighted estimate of veteran State prisoners, 2004.

aThe

total weighted estimate of veteran Federal prisoners, 2004.

bThe

total weighted estimate of nonveteran State prisoners, 2004.

bThe

total weighted estimate of nonveteran Federal prisoners, 2004.

16 Veterans in State and Federal Prison, 2004