
Vera Institute of Justice, People in Jail and Prison in Spring 2021
Download original document:
Document text
Document text
This text is machine-read, and may contain errors. Check the original document to verify accuracy.
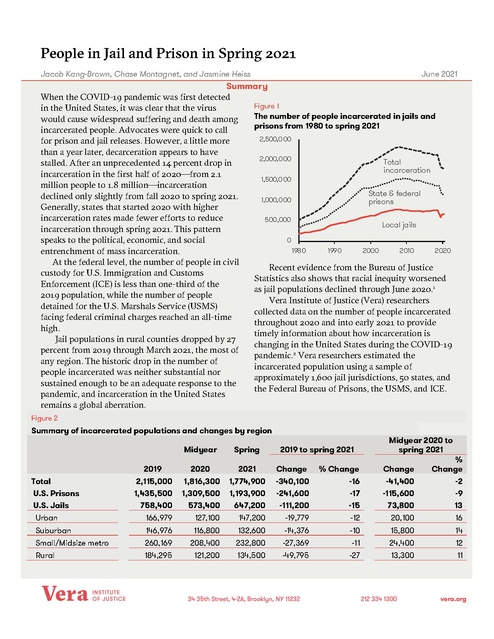
People in Jail and Prison in Spring 2021
Jacob Kang-Brown, Chase Montagnet, and Jasmine Heiss

June 2021

Summary
When the COVID-19 pandemic was first detected
Figure 1
in the United States, it was clear that the virus
The number of people incarcerated in jails and
would cause widespread suffering and death among
prisons from 1980 to spring 2021
incarcerated people. Advocates were quick to call
2,500,000
for prison and jail releases. However, a little more
than a year later, decarceration appears to have
2,000,000
Total
stalled. After an unprecedented 14 percent drop in
incarceration
incarceration in the first half of 2020—from 2.1
1,500,000
million people to 1.8 million—incarceration
State & federal
declined only slightly from fall 2020 to spring 2021.
1,000,000
prisons
Generally, states that started 2020 with higher
incarceration rates made fewer efforts to reduce
500,000
Local jails
incarceration through spring 2021. This pattern
0
speaks to the political, economic, and social
198 0
1990
2000
2010
2020
entrenchment of mass incarceration.
At the federal level, the number of people in civil
Recent evidence from the Bureau of Justice
custody for U.S. Immigration and Customs
Statistics also shows that racial inequity worsened
Enforcement (ICE) is less than one-third of the
as jail populations declined through June 2020.1
2019 population, while the number of people
Vera Institute of Justice (Vera) researchers
detained for the U.S. Marshals Service (USMS)
collected data on the number of people incarcerated
facing federal criminal charges reached an all-time
throughout 2020 and into early 2021 to provide
high.
timely information about how incarceration is
Jail populations in rural counties dropped by 27
changing in the United States during the COVID-19
percent from 2019 through March 2021, the most of
pandemic.2 Vera researchers estimated the
any region. The historic drop in the number of
incarcerated population using a sample of
people incarcerated was neither substantial nor
approximately 1,600 jail jurisdictions, 50 states, and
sustained enough to be an adequate response to the
the Federal Bureau of Prisons, the USMS, and ICE.
pandemic, and incarceration in the United States
remains a global aberration.
Figure 2

Summary of incarcerated populations and changes by region
Spring

2019
2,115,000
1,435,500
758,400

2020
1,816,300
1,309,500
573,400

2021
1,774,900
1,193,900
647,200

Change
-340,100
-241,600
-111,200

% Change
-16
-17
-15

Change
-41,400
-115,600
73,800

%
Change
-2
-9
13

Urban

166,979

127,100

147,200

-19,779

-12

20,100

16

Suburban

146,976

116,800

132,600

-14,376

-10

15,800

14

Small/Midsize metro

260,169

208,400

232,800

-27,369

-11

24,400

12

Rural

184,295

121,200

134,500

-49,795

-27

13,300

11

Total
U.S. Prisons
U.S. Jails

Vera

INSTITUTE
OF JUSTICE

2019 to spring 2021

Midyear 2020 to
spring 2021

Midyear

34 35th Street, 4-2A, Brooklyn, NY 11232

212 3341300

vera.org

Figure 2 note: Total incarceration numbers are adjusted downward slightly to avoid double counting people held in local jails under contract
for state prisons. See “Methodology and Source Notes” at www.vera.org/publications/people-in-jail-and-prison-in-spring-2021.
Figure 1 source note: The 2019, 2020, and 2021 jail and prison population estimates are based on data collected by Vera, while 1983 through
2018 estimates are from the Bureau of Justice Statistics (BJS) Census of Jails, Annual Survey of Jails, and National Prisoner Statistics. See
generally BJS, “Data Collection: Census of Jails,” https://perma.cc/P992-8N2G; BJS, “Data Collection: Annual Survey of Jails (ASJ),”
https://perma.cc/N5UQ-DSQQ; and BJS, “Data Collection: National Prisoner Statistics (NPS) Program,” https://perma.cc/4JJU-KLFC. The
1980 jail estimates are from the U.S. Census, see Margaret Werner Cahalan, Historical Corrections Statistics in the United States, 1850-1984
(Washington, DC: BJS, 1986), https://perma.cc/WDP7-35AA.

incarceration—or maintain their reductions—
through spring 2021.

Introduction
It has been more than a year since the first calls to
release people from jails, prisons, and detention
centers during the COVID-19 pandemic. At the
end of March 2021, there were nearly 1.8 million
people still incarcerated in the United States,
down only 2 percent since June 2020—there was
a 9 percent decrease in the prison population, but
that was offset by a 13 percent increase in the jail
population. In the face of continued demands for
change, most politicians and policymakers failed
or refused to do more. Instead they have tolerated
widespread COVID-19 outbreaks in jails and
prisons across the United States.
New data collected by Vera and detailed in
this report reveals that, after the unprecedented
drop in the total incarcerated population in the
United States that occurred in the first half of
2020, the second half of 2020 looked different.
Some places sustained their reduced incarcerated
populations, and some even pushed for further
reductions. Other states, however, began
incarcerating more people as states reopened and
returned to previous practices.
In early 2021, incarceration in the United
States looks like a patchwork of big changes in the
use of jail and prison, varying from state to state
and city to city. Some states are reducing prison
populations at the expense of refilling jails, as
people sit behind bars waiting for court dates or
transfers. Some states made less substantial
changes in early 2020 but continued to reduce
incarceration throughout the fall and winter—
even as other states returned to “normal” in ways
that have increased incarceration. Generally,
however, states that started 2020 with higher
incarceration rates made fewer efforts to reduce

Widening racial disparities
States and localities rarely publish data on
incarceration by race, ethnicity, or gender. As a
result, this report focuses on overall incarceration
numbers. The Bureau of Justice Statistics (BJS)
publishes annual reports that provide national
estimates of the number of people in jail and
prison using data collected through the Annual
Survey of Jails, Census of Jails, and National
Prisoner Statistics data series. These reports
provide statistics on jail populations, including
more detailed breakdowns by race and gender.
The most recent BJS report for jails, which
provides 2020 data, was released in March 2021.
The report for 2019 prison data was released in
October 2020, meaning it is too early to know
whether racial disparities in prison changed
during the pandemic.3
The BJS report on the 2020 jail population
found that the national jail incarceration rate of
Black people declined 22 percent between 2019
and 2020, while the jail incarceration rate of
white people declined 28 percent.4 The same
report also found that incarceration rate of Latinx
people had declined 23 percent and the jail
incarceration rate of Asian American people had
declined 21 percent.5 These changes widened
existing racial disparities in jail incarceration that
see people of color targeted for incarceration at
greater rates than white people.
The historic changes in prison and jail
populations triggered by the COVID-19 pandemic
came during a national wave of global

2

demonstrations led by Black Lives Matter and
accompanying demands to reckon with racism
and police violence and fundamentally change the
criminal legal system in the United States.6 As a
result, there was far more pressure on officials in
some states and counties to release people from
prison and jail in 2020 and 2021 than in prior
years.

the number of people under the jurisdiction of
state and federal prison systems and, thus, include
people held in private prisons or local jails on a
contract basis as well as people held in workrelease and medical facilities who are not free to
leave and are still serving a prison sentence.
Generally, Vera obtained data from the official
websites of local jails and state corrections
departments or from third parties that have been
collecting data directly from jails. In instances in
which this data was not available online, Vera
requested the information from local jails or state
corrections agencies by telephone or through
public information requests.

This report
In order to provide the public with timely
information on how jail and prison populations
are changing due to the COVID-19 pandemic,
Vera collected midyear 2020, fall 2020 (on or
around September 30), end of 2020 (on or around
December 31), and spring 2021 (on or around
March 31) jail and prison population data directly
from a sample of local jails, state oversight
agencies, state prison systems, and the Federal
Bureau of Prisons (BOP). Vera also collected data
on people detained by ICE who were held in local
jails, private prisons, and dedicated immigration
detention facilities.7 This report focuses on the
changes from June 2020 to March 2021, but
additional data for September 2020 and December
2020 is available in a data file online.8
Vera’s national prison statistics are estimates
based on data from 50 states and the BOP, which
together held 95 percent of the people
incarcerated in prison in 2019 (jurisdictional data
from Virginia and Wyoming was not available for
spring 2021 and was estimated). Jail statistics are
derived from a sample of about 1,600 jails. These
include all county jails in 13 states and a sample of
jails in the remaining states. Vera researchers used
these counts to estimate the national total. The
jails in Vera’s sample held almost three out of
every four people incarcerated in jails in 2013,
which was the last time the BJS reported
information for all jails in the United States.
All jail population counts in this report are
estimates of the number of people in the custody
of the local jail, not the number of people in the
local jail’s jurisdiction. (See “Methodology and
Source Notes” for a definition of these terms and a
detailed description of Vera’s methods.) Prison
population counts in this report are estimates of

Incarcerated population
The total number of people incarcerated in state
and federal prisons and local jails in the United
States dropped 14 percent from around 2.1 million
in 2019 to 1.8 million by June 2020, declining a
further 2 percent by March 2021. This represents
a 23 percent decline from a peak of 2.3 million
people in 2008. The incarceration rate in the
United States, including state and federal prisons
and local jails, was 537 people behind bars per
100,000 residents in early 2021. This is down
from a peak of 760 per 100,000 in 2008. (See
Appendix Figure 1 for full rate information.)
Looking only at state and federal prisons,
there was a 17 percent total decline between yearend 2019 and spring 2021, from approximately
1.44 million people to 1.19 million people. The
majority of the prison decline occurred during the
first phase of the coronavirus pandemic, with the
prison population dropping to 1.3 million people
at midyear 2020—a 9 percent decrease from the
end of 2019—and continuing at a slower pace
through spring 2021.9
In contrast, during the first phase of the
coronavirus pandemic, local jails saw steep
population declines. The total jail population
dropped 24 percent, from an estimated 758,400
people in local jails in midyear 2019 to 573,400 in
midyear 2020. However, from June 2020 to
March 2021, local jail populations increased by
73,800 to 647,200 people—an increase of 13

3

percent in nine months.
Overall, the total number of people
incarcerated in prisons and jails was relatively
constant between June 2020 and March 2021, as
jail increases counterbalanced prison declines.

n

n

n

Jail populations in rural areas
decreased more than in cities, then
quickly rebounded

(See Appendix Figure 2 for comparison of
midyear 2010 and 2020 jail populations and for
growth between June and March 2021 for a range
of cities.)

In the first part of 2020, the largest jail population
declines were in rural areas. The rural jail
population declined by 63,100 people between
midyear 2019 and 2020—a 34 percent reduction.
However, from midyear 2020 to early 2021, the
number of people in rural jails grew by 13,300
people, a 11 percent increase. This brought the
total rural jail population decline to 27 percent
between midyear 2019 and early 2021. The large
decline through the first part of 2020 shows that
dramatic decarceration is possible in rural areas.
Conversely, the quick growth demonstrates the
broad capacity and political will to incarcerate
people in rural counties. In March 2021, rural jail
incarceration rates were more than twice as high
as urban jail incarceration rates.
Urban areas and small and midsized metro
areas did not initially reduce jail incarceration as
much as other areas and had more growth from
June 2020 to March 2021. The total decline from
mid-2019 to early 2021 in urban counties was
only 12 percent, while the suburbs saw a 10
percent decline.10 (See Figure 2.)
In contrast to rural counties, jail populations
in many large cities have been decreasing for
several years. Cities in which jail populations had
already decreased significantly from 2010 to 2019
saw further declines through June 2020.
However, most big city jail populations increased
from June 2020 to March 2021, including
n

Philadelphia (56 percent decrease followed
by a 20 percent increase);
New York City (70 percent decrease
followed by a 40 percent increase); and
Oakland (58 percent decrease followed by a
21 percent increase).

Decreases in prison populations were
offset by increases in jail populations in
late 2020
A number of factors caused these simultaneous
increases in jail populations and decreases in state
prison populations. In some jurisdictions, state
prisons refused to accept people who had been
sentenced to serve state prison time, suspending
transfers from local jails due to COVID-19. Courts
also paused jury trials or suspended other
operations, while refusing to release many people
who were detained before trial.11 These policies
are institutional sleight of hand, akin to a shell
game, in that they do not reduce incarceration but
merely change its geography and jurisdiction. For
example, the Los Angeles County jail population
decreased by 30 percent between midyear 2019
and 2020, but then grew by 27 percent to 15,223
by the end of March 2021. At that point 3,900
people—more than one in four people held in the
jail—were awaiting transfer to California state
prisons.12 In West Virginia, jail populations in the
state declined only 3 percent through June 2020
and then rose 21 percent by the end of March
2021. West Virginia state prison populations
declined by 29 percent by the end of June 2020,
followed by a further 19 percent through the end
of March 2021. Overall, incarceration increased 1
percent in West Virginia between June 2020 and
March 2021. (See Figure 3.)

Chicago (52 percent decrease from 2010 to
2020, followed by a 24 percent increase
from June 2020 to March 2021);

4

Figure 3

State-level comparison of prisons and local jail trends
Percent change
Year-end
2019/early
2020

Midyear
2020

Spring
2021

2019 to
midyear
2020

Midyear
2020 to
spring 2021

2019 to
spring
2021

County jails
State prisons

195,289
69,782
125,507
32,282
12,568
19,714

166,472
51,506
114,966
24,320
6,879
17,441

158,159
61,660
96,499
24,815
9,145
15,670

-15
-26
-8
-25
-45
-12

-5
20
-16
2
33
-10

-19
-12
-23
-23
-27
-21

County jails
State prisons

148,644
52,635
96,009

135,545
46,163
89,382

133,615
52,447
81,168

-9
-12
-7

-1
14
-9

-10
0
-15

County jails
State prisons

92,375
36,819
55,556

79,596
28,705
50,891

79,759
33,444
46,315

-14
-22
-8

0
17
-9

-14
-9
-17

County jails-local
County jails-state prisoners
State prisons
Massachusetts
County jails
State prisons
New Mexico
County jails
State prisons
New York
County jails
State prisons
Ohio
County jails
State prisons
Tennessee
County jails local
County jails-state prisoners
State prisons

36,368
12,932
10,774
12,662
17,501
9,296
8,205
13,037
6,314
6,723
61,156
16,890
44,284
70,323
20,561
49,762
51,127
24,588
4,801
21,738

28,628
8,329
8,751
11,548
12,889
5,577
7,312
10,678
4,350
6,328
49,648
11,258
38,390
60,046
13,695
46,351
42,123
17,557
4,670
19,896

29,393
10,711
8,850
9,832
12,501
5,837
6,664
10,465
4,588
5,877
46,971
15,559
31,412
43,537
41,284
18,290
3,307
19,687

-21
-36
-19
-9
-26
-40
-11
-18
-31
-6
-19
-33
-13
-15
-33
-7
-18
-29
-3
-8

3
29
1
-15
-3
5
-9
-2
5
-7
-5
38
-18
-6
-2
4
-29
-1

-19
-17
-18
-22
-29
-37
-19
-20
-27
-13
-23
-8
-29
-13
-19
-26
-31
-9

207,374
65,825

188,086
61,496

180,663
63,172

-9
-7

-4
3

-13
-4

141,549
11,894
5,094
6,800

126,590
9,751
4,933
4,818

117,491
9,897
5,992
3,905

-11
-18
-3
-29

-7
1
21
-19

-17
-17
18
-43

California
County jails
State prisons
Colorado

Florida

Georgia

Kentucky

Texas
County jails
State prisons on-hand
West Virginia
Regional jails
State prisons

Note: The states included in this table were selected because they were the only states for which complete information on the
changes in county jail populations during 2020 was available at the time of writing.

5

ICE

I

!

,!

;'

.,·

\
Jun 2019

By spring 2021, the number of people in civil
custody for ICE had declined to around 15,000—
less than a third of the 2019 population. However,
in December 2020, Congress approved a budget
funding an average daily population of 34,000
people to be held in ICE detention for fiscal year
2021. This indicates federal support for increased

Source: USMS data reported directly to Vera by the USMS
press office; ICE data compiled by Vera from annual
reports and ICE website.

0

10,000

20,000

30,000

40,000

....
..
. ,.•··

Sep 2019

I
Dec 2019

/
Mar 2020

50,000

·•'

•'·•""

Sep 2020

60,000

_,,,,i'

Jun 2020

/
l
/
Dec 2020

USMS

:
Mar 2021

70,000

The number of people incarcerated by federal
agencies from year-end 2019 to spring 2021

Figure 4

Another factor leading to reduced jail populations
is the decreased use of jails by ICE for the
detention of immigrants. Agencies like ICE and
the USMS are responsible for incarcerating large
numbers of people in local jails via contracts that
allow them to rent jail cells in many
jurisdictions.13 Although people detained by ICE
are facing civil charges and are not being
prosecuted in a criminal court, most are held in
private prisons and other facilities operated by
for-profit companies, with a substantial and
growing number of people held in a network of
contracted jail beds.14

Federal agencies detain large numbers
of people in local jails

!
t

6

Total incarceration information—accounting for
both state prisons and local jails—is available for
18 states. (See Figure 5.)19 These states fit a general
pattern of steeper declines in the first part of the
pandemic—between 2019 and midyear 2020—
than in subsequent months.

Regional variation

Arkansas (down 9.4 percent), Mississippi
(down 9.1 percent), and Nebraska (down 6
percent) were the only states to reduce their
prison populations by less than 10 percent from
the end of 2019 through March 2021. The
Nebraska Department of Correctional Services
has been seeking to build a new prison, and the
governor vetoed legislation to make many people
eligible for parole sooner.17 (Although there is
scant data for the jails in the state, the three
largest jails—in Omaha, Lincoln, and Grand
Island—have been refilled to approximately prepandemic levels.) Alabama’s prison population
declined 11 percent in that time period, but the
governor is currently planning for three new
prisons. The legislature previously failed to pass
proposed sentencing reforms that could have
reduced long-standing overcrowding.18

All prison systems have fewer people
incarcerated now than before the
pandemic

immigrant detention, a substantial share of which
will likely continue to take place in jails.15
More than half of all people detained pretrial
by the USMS while facing federal criminal
charges are held in local jails—and many in rural
jails.16 In contrast to the large declines in ICE
detention, the total number of people detained by
USMS (in jails and other detention settings)
continued to increase and reach new highs in
early 2021. (See Figure 4.) The number of people
detained for the USMS declined by only 10
percent from 2019 to June 2020 (from 61,489 to
56,400 people). It subsequently reached a record
level of 64,400 in March 2021.

Figure 5

Total state prison and local jail rates and changes for select states
Percent change
Midyear
2020 to
spring
2021

2019 to
spring 2021

2019

Midyear
2020

Spring
2021

2019 to
midyear
2020

Alaska

612

590

581

-4

-1

-5

California

494

421

400

-15

-5

-19

Colorado

561

422

431

-25

2

-23

Connecticut

345

279

251

-19

-10

-27

Delaware

585

494

471

-15

-5

-19

Florida

692

631

622

-9

-1

-10

Georgia

870

750

751

-14

0

-14

Hawaii

366

314

290

-14

-8

-21

Kentucky

784

641

658

-18

3

-16

Massachusetts

254

187

181

-26

-3

-29

New Mexico

622

509

499

-18

-2

-20

New York

314

255

241

-19

-5

-23

Ohio

602

514

-

-15

-

-

Rhode Island

259

219

215

-15

-2

-17

Tennessee

749

617

605

-18

-2

-19

Texas

712

649

623

-9

-4

-13

Vermont

258

227

198

-12

-13

-23

West Virginia

664

544

552

-18

1

-17

From midyear 2020 through spring 2021, only
Vermont and Connecticut had double-digit
percentage decreases. In contrast, some states had
overall incarceration increases through that
period, with Kentucky, Colorado, and West
Virginia increasing 3, 2, and 1 percent,
respectively. Comparing spring 2021
incarceration to 2019 reveals wider variation, and
states that started the pandemic with higher
incarceration rates generally did less to reduce
incarceration. From 2019 to March 2021, Alaska
decreased by 5 percent and Florida 10 percent. In
contrast, Massachusetts was down 29 percent,
Connecticut was down 27 percent, and Colorado,
Vermont, and New York were down 23 percent.

Prison incarceration rates remain the
highest in the South
By early 2021, Southern states had prison
incarceration rates of 408 people in prison per
100,000 residents, compared to 300 in the
Midwest, 282 in the West, and 188 in the
Northeast.
From the end of 2019 to March 2021, prison
incarceration rates declined the most in the
Northeast, (down 26 percent) and the least in the
South and Midwest (down only 16 and 17 percent,
respectively). The West was down 20 percent.
(See Appendix Figures 3, 4, and 5 on pages 11 to
16).

7

Figure 6

The rural/urban divide in incarceration
is visible across the country

Jail incarceration rate, spring 2021
■ Ru ral

High rates of rural jail incarceration are apparent
in many states for which Vera researchers had
comprehensive data. (See Figure 6.) Relatively
high rates of jail incarceration were apparent in
rural areas in both lower incarceration rate states
like New York and in higher incarceration rate
states like Kentucky. Growth from June 2020 to
March 2021 was also especially pronounced in
many rural areas. (See Appendix Figure 6 on page
17). This is particularly troubling given the limited
health care resources in rural counties as all jails,
large and small, remain at risk of COVID-19
outbreaks. The impact of the pandemic on rural
communities underscores the need to reinvest in
community-based services and resources that
promote community well-being and safety.20

California

■ Urban

I

Colorado

I

Florida

I

Georgia

I

Kentucky
Massachusetts
New York

I

I_ __J
I~

Tennessee

I

Texas
0

200

400

600

Note: For simplicity, suburban counties and small to
midsized metropolitan areas are not depicted. (See
Appendix Figure 5.)

population changes have reflected a deepening of
preexisting political, economic, and social
orientations toward punishment and detention.
Racial inequalities in incarceration rates increased,
and states and counties with high incarceration
rates prior to the pandemic tended toward relative
inaction during the pandemic.
At minimum, states should be looking to close
prisons and reduce budgets to match the much
lower prison populations. States ranging from
California to Texas, New York, and New Jersey
have all proposed prison closures, but this policy
agenda also needs to be pursed elsewhere. At the
federal level, neither the Biden administration nor
Congress has taken action that reflects a
commitment toward sustained decarceration. As
jails have been refilling, especially in rural areas,
statewide pretrial reform and state and local
efforts to reduce criminalization are also urgently
needed.

Conclusion
A year ago, many jurisdictions started responding
to the urgent call to decarcerate jails and
prisons—an imperative step to save lives and
protect the health of incarcerated people, staff,
and their communities. Today, that sense of
urgency has been lost, even as the pandemic still
rages and the country continues to lead the world
in incarceration. Nonetheless, by late March 2021,
the outlines of a “new normal” in incarceration
had emerged that includes sustained overall
reductions in the number of people in prisons and
jails—albeit with jail incarceration continuing to
trend upward. The relative stasis in incarceration
since late 2020 is the result of a refilling of many
jails and a small, further decrease in prison
populations.
In many ways, however, jail and prison

8

Appendix Table 1

Summary of incarceration rates and changes by region
Rates per 100,000 Residents

2019 to Spring '21
%
Change
Change

Midyear 2020 to
spring 2021
%
Change
Change

2019

Midyear
2020

Spring
2021

644
437
237

551
397
178

537
361
201

-107
-76
-36

-17
-17
-15

-13
-36
23

-2
-9
13

Urban

168

127

147

-21

-12

20

16

Suburban

181

143

162

-19

-10

19

13

Small/Midsize metro

276

220

245

-31

-11

25

12

Rural

410

268

297

-113

-27

29

11

Total
U.S. Prisons
U.S. Jails

9

Appendix Figure 2

Jail incarceration counts in select large jurisdictions, 2010 to 2021
Between midyear
2020 and spring
2021

Between 2010 and
2020
Midyear
2010

Midyear
2020

Change

%
Change

Spring
2021

Change

%
Change

Los Angeles County, Calif.

18,036

11,948

-6,088

-34

15,223

3,275

27

Harris County, Texas

10,242

8,201

-2,041

-20

8,508

307

4

Maricopa County, Ariz.

8,055

4,468

-3,587

-45

5,710

1,242

28

Cook County, Ill.

9,586

4,589

-4,997

-52

5,690

1,101

24

Dallas County, Texas

6,865

5,090

-1,775

-26

5,575

485

10

New York City, N.Y.

13,049

3,876

-9,173

-70

5,408

1,532

40

Philadelphia, Penn.

8,804

3,874

-4,930

-56

4,644

770

20

San Diego, Calif.

4,762

3,655

-1,107

-23

4,334

679

19

Tarrant County, Texas

3,248

3,988

740

23

4,046

58

1

Miami-Dade County, Fla.

5,770

3,378

-2,392

-41

3,904

526

16

Bexar County, Texas

4,169

3,370

-799

-19

3,682

312

9

Jacksonville County, Fla.

3,835

3,290

-545

-14

3,663

373

11

Shelby County, Tenn.

5,766

3,627

-2,139

-37

3,596

-31

-1

Riverside County, Calif.

3,410

3,178

-232

-7

3,531

353

11

Sacramento County, Calif.

4,199

2,504

-1,695

-40

3,368

864

35

Orange County, Calif.

5,134

3,057

-2,077

-40

3,257

200

7

Fulton County, Ga.

2,488

2,493

5

0

2,950

457

18

Hillsborough County, Fla.

3,340

2,470

-870

-26

2,870

400

16

Orange County, Fla.

3,604

2,140

-1,464

-41

2,773

633

30

Pinellas County, Fla.

3,225

2,196

-1,029

-32

2,676

480

22

Santa Clara County, Calif.

3,587

2,093

-1,494

-42

2,357

264

13

Alameda County, Calif.

4,305

1,805

-2,500

-58

2,186

381

21

Allegheny County, Penn.

3,233

1,736

-1,497

-46

1,744

8

0

Milwaukee County, Wis.

2,710

1,492

-1,218

-45

1,604

112

8

Orleans Parish, La.

3,522

850

-2,672

-76

889

39

5

10

Appendix Figure 3

Change in prison incarceration from highest year to spring 2021
From high year to spring
2021

Highest prison pop.
Year

Count

Spring
2021

2009
2012
2009

1,615,487
217,815
1,407,369

1,193,934
152,259
1,041,675

-421,553
-65,556
-365,694

-26
-30
-26

Connecticut (a)
Maine
Massachusetts
New Hampshire
New Jersey
New York
Pennsylvania
Rhode Island (a)
Vermont (a)
Midwest

2007
2018
1997
2013
1999
1999
2011
2008
2009

20,924
2,425
11,947
3,018
31,493
72,899
51,578
4,045
2,220

8,961
1,666
6,664
2,189
12,538
31,412
38,262
2,275
1,238

-11,963
-759
-5,283
-829
-18,955
-41,487
-13,316
-1,770
-982

-57
-31
-44
-27
-60
-57
-26
-44
-44

Illinois
Indiana
Iowa
Kansas
Michigan
Minnesota
Missouri
Nebraska
North Dakota
Ohio
South Dakota

2012
2013
2010
2018
2006
2015
2017
2019
2015
2015
2017

49,348
29,913
9,455
10,218
51,577
10,798
32,601
5,682
1,795
52,233
3,970

27,503
24,296
7,625
8,749
32,962
7,455
22,939
5,319
1,538
43,537
3,252

-21,845
-5,617
-1,830
-1,469
-18,615
-3,343
-9,662
-363
-257
-8,696
-718

-44
-19
-19
-14
-36
-31
-30
-6
-14
-17
-18

Wisconsin

2018

24,064

20,161

-3,903

-16

U.S. Prisons Total
Federal
States

Change

% Change

Northeast

(a) Prisons and jails form one unified system.

11

Appendix Figure 3

Change in prison incarceration from highest year to spring 2021,
continued
Highest prison pop.
Year

Count

Spring
2021

From high year to spring
2021
Change

% Change

South
Alabama
Arkansas
Delaware (a)
Florida
Georgia
Kentucky
Louisiana
Maryland
Mississippi
North Carolina
Oklahoma
South Carolina
Tennessee
Texas (b)
Virginia (b)
West Virginia
West

2012
2017
2007
2010
2009
2017
2012
2002
2008
2010
2016
2008
2017
2010
2015
2016

32,431
18,070
7,257
104,306
56,986
23,543
40,172
24,162
22,754
40,382
29,916
24,326
28,980
173,649
38,403
7,162

25,105
16,085
4,586
81,168
46,315
18,686
26,543
14,963
17,701
29,192
22,625
16,069
22,994
133,024
31,548
3,905

-7,326
-1,985
-2,671
-23,138
-10,671
-4,857
-13,629
-9,199
-5,053
-11,190
-7,291
-8,257
-5,986
-40,625
-6,855
-3,257

-23
-11
-37
-22
-19
-21
-34
-38
-22
-28
-24
-34
-21
-23
-18
-45

Alaska (a)
Arizona
California
Colorado
Hawaii (a)
Idaho
Montana (c)
Nevada
New Mexico
Oregon
Utah
Washington
Wyoming (d)

2014
2015
2006
2008
2005
2019
2016
2016
2017
2013
2013
2017
2018

5,794
42,719
175,512
23,274
6,146
9,437
3,814
13,757
7,276
15,517
7,077
19,656
2,543

4,250
36,704
96,499
15,670
4,099
8,226
2,477
11,222
5,877
13,433
5,602
15,067
1,880

-1,544
-6,015
-79,013
-7,604
-2,047
-1,211
-1,337
-2,535
-1,399
-2,084
-1,475
-4,589
-663

-27
-14
-45
-33
-33
-13
-35
-18
-19
-13
-21
-23
-26

(a) Prisons and jails form one unified system.
(b) Spring 2021 estimates based on people in DOC custody and the estimated number of people held in local jails.
(c) Spring 2021 not fully comparable with prior years due to change in how Montana counts people in work release.
(d) Spring 2021 estimate based on last known value and rate of change in states within region.

12

Appendix Figure 4

Prison population from 2019 to 2021
Percent change
Year-end 2019
to midyear Midyear 2020
2020
to early 2021

Year-end
2019 to early
2021

Year-end
2019

Midyear
2020

Spring
2021

1,435,500
175,116
1,260,393

1,309,485
161,640
1,147,845

1,193,934
152,259
1,041,675

-9
-8
-9

-9
-6
-9

-17
-13
-17

138,445

122,915

105,205

-11

-14

-24

Connecticut (a)

12,293

9,963

8,961

-19

-10

-27

Maine

2,205

1,834

1,666

-17

-9

-24

Massachusetts

8,205

7,332

6,664

-11

-9

-19

New Hampshire

2,622

2,426

2,189

-7

-10

-17

New Jersey

18,613

17,132

12,538

-8

-27

-33

New York

44,284

38,390

31,412

-13

-18

-29

Pennsylvania

45,875

42,101

38,262

-8

-9

-17

Rhode Island (a)

2,740

2,320

2,275

-15

-2

-17

Vermont (a)

1,608

1,417

1,238

-12

-13

-23

244,032

221,232

205,336

-9

-7

-16

Illinois

38,259

32,167

27,503

-16

-14

-28

Indiana

27,268

25,884

24,296

-5

-6

-11

Iowa

9,282

7,931

7,625

-15

-4

-18

Kansas

10,177

9,189

8,749

-10

-5

-14

38,053

35,425

32,962

-7

-7

-13

9,982

8,330

7,455

-17

-11

-25

26,044

24,027

22,939

-8

-5

-12

Nebraska

5,651

5,402

5,319

-4

-2

-6

North Dakota

1,794

1,247

1,538

-30

23

-14

49,762

46351

43,537

-7

-6

-13

3,804

3,478

3,252

-9

-6

-15

23,956

21,801

20,161

-9

-8

-16

U.S. Prisons Total
Federal
State

Northeast

Midwest

Michigan
Minnesota
Missouri

Ohio
South Dakota
Wisconsin

(a) Prisons and jails form one unified system.

13

Appendix Figure 4

Prison population from 2019 to 2021, continued
Percent change
Year-end
2019

Midyear
2020

Spring
2021

Year-end 2019 to
midyear 2020

Midyear 2020
to late 2020

Year-end
2019 to
late 2020

603,562

553,380

510,509

-8

-8

-15

Alabama

28,266

26,890

25,105

-5

-7

-11

Arkansas

17,759

16,552

16,085

-7

-3

-9

Delaware (a)

5,692

4,812

4,586

-15

-5

-19

Florida

96,009

89,382

81,168

-7

-9

-15

Georgia

55,556

50,891

46,315

-8

-9

-17

Kentucky

23,436

20,299

18,686

-13

-8

-20

Louisiana

31,609

28,213

26,543

-11

-6

-16

Maryland

18,686

17,038

14,963

-9

-12

-20

Mississippi

19,469

18,026

17,701

-7

-2

-9

North Carolina

34,510

31,506

29,192

-9

-7

-15

Oklahoma

25,712

24,039

22,625

-7

-6

-12

South Carolina

18,608

17,318

16,069

-7

-7

-14

Tennessee

26,539

24,566

22,994

-7

-6

-13

Texas (b)

158,820

145,579

133,024

-8

-9

-16

Virginia (b)

36,091

33,451

31,548

-7

-6

-13

West Virginia

6,800

4,818

3,905

-29

-19

-43

274,354

250,318

220,625

-9

-12

-20

4,475

4,313

4,250

-4

-1

-5

42,441

40,151

36,704

-5

-9

-14

California

125,507

114,966

96,499

-8

-16

-23

Colorado

19,714

17,441

15,670

-12

-10

-21

Hawaii (a)

5,179

4,449

4,099

-14

-8

-21

9,437
3,811
12,942
6,723
15,755
6,731
19,160
2,479

8,775
3,937
11,231
6,303
14,055
5,993
16,703
2,001

8,226
2,477
10,841
5,877
13,433
5,602
15,067
1,880

-7
3
-13
-6
-11
-11
-13
-19

-6
-37
-3
-7
-4
-7
-10
-6

-13
-35
-16
-13
-15
-17
-21
-24

South

West
Alaska (a)
Arizona

Idaho
Montana (c)
Nevada
New Mexico
Oregon
Utah
Washington
Wyoming (d)

(a) Prisons and jails form one unified system.
(b) Spring 2021 estimates based on people in DOC custody and the estimated number of people held in local jails.
(c) Spring 2021 not fully comparable with prior years due to change in how Montana counts people in work release.
(d) Spring 2021 estimate based on last known value and rate of change in states within region.

14

Appendix Figure 5

Prison incarceration rates from 2019 to 2021

Yearend
2019

Percent change
YearYearend Midyear
end
2019 to 2020 to
2019 to
midyear
spring
spring
2020
2021
2021

Midyear
2020

Spring
2021

437
53
385

391
48
343

361
45
315

-11
-9
-11

-8
-6
-8

-17
-15
-18

247

213

183

-14

-14

-26

345
164
119
193
210
228
358
259
258
357

276
135
104
176
184
190
324
211
220
321

249
122
95
159
135
155
294
207
193
298

-20
-18
-12
-9
-12
-17
-10
-18
-14
-10

-10
-9
-9
-10
-27
-18
-9
-2
-13
-7

-28
-25
-20
-18
-36
-32
-18
-20
-25
-17

Illinois
Indiana

302
405

251
381

215
358

-17
-6

-14
-6

-29
-12

Iowa
Kansas

294
349

249
313

239
298

-16
-10

-4
-5

-19
-15

Michigan
Minnesota

381
177

352
146

330
131

-8
-18

-6
-11

-13
-26

Missouri
Nebraska
North Dakota
Ohio
South Dakota
Wisconsin

424
292
235
426
430
411

390
275
160
393
392
370

373
271
197
369
367
342

-8
-6
-32
-8
-9
-10

-5
-2
23
-6
-6
-8

-12
-7
-16
-13
-15
-17

U.S. Prisons Total
Federal
States

Northeast
Connecticut (a)
Maine
Massachusetts
New Hampshire
New Jersey
New York
Pennsylvania
Rhode Island (a)
Vermont (a)

Midwest

(a) Prisons and jails form one unified system.

15

Appendix Figure 5

Prison incarceration rates from 2019 to 2021, continued
Percent change
YearYearend Midyear
end
2019 to
2020 to
2019 to
midyear
spring
spring
2020
2021
2021

Yearend
2019

Midyear
2020

Spring
2021

483

440

407

-9

-8

-16

576
588
585
447
523
525
680
309
654
329
650
361
389
548
423
379
350

535
550
486
415
475
451
606
309
609
302
607
338
355
499
388
269
319

500
534
463
377
432
415
570
242
598
280
571
314
333
456
365
218
281

-7
-7
-17
-7
-9
-14
-11
0
-7
-8
-7
-6
-9
-9
-8
-29
-9

-7
-3
-5
-9
-9
-8
-6
-22
-2
-7
-6
-7
-6
-9
-6
-19
-12

-13
-9
-21
-16
-17
-21
-16
-22
-9
-15
-12
-13
-14
-17
-14
-43
-20

Alaska (a)
Arizona
California
Colorado
Hawaii (a)
Idaho

612
583
318
342
366
528

588
561
291
302
306
477

579
513
244
271
282
447

-4
-4
-8
-12
-16
-10

-1
-9
-16
-10
-8
-6

-5
-12
-23
-21
-23
-15

Montana (c)
Nevada
New Mexico
Oregon
Utah
Washington
Wyoming (d)

357
420
321
374
210
252
428

363
362
298
332
183
217
347

228
352
278
317
171
196
325

2
-14
-7
-11
-13
-14
-19

-37
-3
-7
-4
-7
-10
-6

-36
-16
-13
-15
-18
-22
-24

South
Alabama
Arkansas
Delaware (a)
Florida
Georgia
Kentucky
Louisiana
Maryland
Mississippi
North Carolina
Oklahoma
South Carolina
Tennessee
Texas (b)
Virginia (b)
West Virginia

West

(a) Prisons and jails form one unified system.
(b) Spring 2021 estimates based on people in DOC custody and the estimated number of people held in local jails.
(c) Spring 2021 not fully comparable with prior years due to change in how Montana counts people in work release.
(d) Spring 2021 estimate based on last known value and rate of change in states within region.

16

Appendix Figure 6

Spring 2021 jail incarceration rates and percent changes since mid-2020, select states
Urban

Small/Midsized
metro

Suburban

Rural

Total

Rate

%
Change

Rate

%
Change

Rate

%
Change

Rate

%
Change

Rate

%
Change

California

140

21

165

24

192

16

225

16

156

20

Colorado

190

42

123

19

181

24

211

35

163

27

Florida

211

18

180

9

309

14

477

10

244

14

Georgia

277

18

249

20

372

13

432

16

315

17

Kentucky

180

15

346

15

450

21

576

16

439

17

117

9

73

2

94

10

149

9

85

5

-

-

-

-

190

-1

277

4

219

1

New York

69

38

66

34

124

43

133

39

80

38

Tennessee

304

-6

252

-4

307

-3

401

1

316

-3

176

4

153

2

297

3

361

0

218

3

Massachusetts
New Mexico

Texas

17

Endnotes
1

2

See Todd Minton, Zhen Zeng, and Laura Maruschak,
Impact of COVID-19 on the Local Jail Population,
January-June 2020, (Washington, DC: Bureau of
Justice Statistics, 2021) https://perma.cc/AK2J-88XS.
See also Daniel Downs and Christian Henrichson, The
Impact of COVID-19 on Jail Populations: A Closer Look
At Bookings And Releases (Louisville, KY: Appriss
Insights, 2020), https://perma.cc/USG5-G44P.
All 2019, 2020, and 2021 jail and prison population
estimates in this report are based on data collected by
Vera, while 1970 through 1978 and 1983 through 2018
estimates are from the Bureau of Justice Statistics
(BJS) Census of Jails, Annual Survey of Jails, and
National Prisoner Statistics. See generally BJS, “Data
Collection: Census of Jails,” https://perma.cc/P9928N2G; BJS, “Data Collection: Annual Survey of Jails
(ASJ),” https://perma.cc/N5UQ-DSQQ; and BJS,
“Data Collection: National Prisoner Statistics (NPS)
Program,” https://perma.cc/4JJU-KLFC. The 1960 and
1980 jail estimates are from the U.S. Census; see
Margaret Cahalan, Historical Corrections Statistics in
the United States, 1850-1984 (Washington, DC: BJS,
1986), https://perma.cc/WDP7-35AA. Numbers in the
body text may not sum due to rounding. For more
detail on incarceration numbers in late 2020, see
Jacob Kang-Brown, Chase Montagnet, and Jasmine
Heiss, “People in Jail and Prison in 2020” (New York:
The Vera Institute of Justice, 2021),
https://perma.cc/RYZ5-PQGB.

3

Minton, Zeng, and Maruschak, Impact of COVID-19 on
the Local Jail Population, January-June 2020, 2021;
and E. Ann Carson, Prisoners in 2019 (Washington, DC:
Bureau of Justice Statistics, 2020),
https://perma.cc/N7PA-LJNU.

4

Minton, Zeng, and Maruschak, Impact of COVID-19 on
the Local Jail Population, January-June 2020, 2021, 1314.

5

Ibid.

6

See e.g., Mariame Kaba, “Yes, We Mean Literally
Abolish the Police,” New York Times, June 12, 2020,
https://perma.cc/RS52-Z932. For the extent of Black
Lives Matter protests, see estimates of geographic
range and number of participants in Larry Buchanan,
Quoctrung Bui, and Jugal K. Patel, “Black Lives Matter
May Be the Largest Movement in U.S. History,” New
York Times, July 3, 2020, https://perma.cc/JVJ8WAM3.

7

For a detailed look at this data, including information
on COVID-19 cases, see Noelle Smart and Adam
Garcia, “Tracking COVID-19 in Immigration Detention:
A Dashboard of ICE Data,” database (New York: Vera
Institute of Justice), https://perma.cc/8H4B-R97L.

8

Additional data and tables are available at
www.vera.org/publications/people-in-jail-and-prisonin-spring-2021.

9

Midyear refers to late June or early July, and late year
refers to the end of September or beginning of
October.

10 These estimates are drawn from a large sample of
local jails that, together, house approximately threequarters of the country’s jail population. Nevertheless,
this is not a census and does not contain data on
every local jail. It is possible that the populations in
those missing jails could have changed in different
ways than estimated by Vera. For instance, some
unsampled rural areas may have seen less steep
decarceration, and unsampled urban areas might
have released a larger share of their populations.
Dramatic differences, if they exist, might alter the
reported estimates presented here.
Vera’s analysis of the urban-rural continuum changes
the six categories defined by the National Center for
Health Statistics Urban-Rural Classification Scheme
for Counties to four. A county is labeled “urban” if it is
one of the core counties of a metropolitan area with
one million or more people and is labeled “suburban”
if it is within the surrounding metropolitan area. Vera
turns the remaining four categories into two by
combining small and medium-sized metropolitan areas
(“small and midsize metro”) and micropolitan and
noncore areas (“rural”).
11 See e.g., events in St. Louis, Kiara Alfonseca, “St. Louis
Inmates Protest Again Over Long Trial Wait Times,
COVID-19 Fears,” ABC News, April 6, 2021,
https://perma.cc/3974-EMS8; Shawn Arrajj, “Backlog
of Felony Court Cases Grows as Officials Explore
Options to Lower Jail Population,” Community Impact
Newspaper (Houston, Texas), August 2, 2020,
https://perma.cc/789H-JR57.
12 See Custody Division COVID-19 Factsheet at
“Coronavirus Updates,” Los Angeles County Sheriff’s
Department, archived October 2, 2020, https://web
.archive.org/web/20201002164008/https://lasd.org/co
vid19updates/; see also data available at Vera Institute

18

Wessler, “Inside the US Marshals’ Secretive, Deadly
Detention Empire,” Mother Jones, Nov/Dec 2019,
https://perma.cc/5GS5-KGXF.

of Justice, “Care First L.A.: Tracking Jail
Decarceration,” May 18, 2021, https://perma.cc/DA79C4ZR.

17 See e.g., Editorial, “Nebraska Should Pause on New
Prison and Plan for Broad Criminal Justice Reform,”
Omaha World-Herald, February 28, 2021,
https://perma.cc/R47D-8KU3; Fred Knapp,
“Lawmakers Advance Planning, But Not Building, A
New Prison,” NET Nebraska, April 9, 2021,
https://perma.cc/4QYR-C6GP.

13 See Oliver Hinds and Jack Norton, “No Chance
Alamance: Immigrant Detention and Jail Expansion in
the North Carolina Piedmont,” Vera Institute of
Justice, July 28, 2020, https://perma.cc/2FY6-4P8N;
and Jacob Kang-Brown and Jack Norton, “More than
a Jail: Immigrant Detention and the Smell of Money,”
Vera Institute of Justice, July 5, 2018,
https://perma.cc/H8DC-CGRP.

18 See Brian Lyman, “Alabama Legislative Leaders See
Possibility of Special Session on Prisons,” Montgomery
Advertiser, May 19, 2021,
https://perma.cc/VM7C-SD6X.

14 For more information on the use of local jails as
immigrant detention facilities, see Kang-Brown and
Norton, “More Than a Jail,” 2018.

19 This includes the six states—Alaska, Connecticut,
Delaware, Hawaii, Rhode Island, and Vermont—with
state-operated, unified prison and jail systems.

15 See Public Law 116-260, https://perma.cc/4FC4-LMUF.
16 See Jack Norton and Jacob Kang-Brown, “If You Build
It: How the Federal Government Fuels Rural Jail
Expansion,” Vera Institute of Justice, January 10, 2020,
https://perma.cc/WZ2A-VAJD; and Seth Freed

20 Jacob Kang-Brown and Jasmine Heiss, “COVID-19
Imperils People in Rural Jails,” Vera Institute of Justice,
April 1, 2020, https://perma.cc/BRK2-XPQC.

19

Acknowledgments
Thank you to Léon Digard and Abbi Leman for editorial support, Kica Matos and Cindy Reed for their
review and feedback, and Jack Norton for research support. Thank you to the team from the New York
University Public Safety Lab’s Jail Data Initiative for sharing data. Thank you to the ACLU and especially
state chapters that shared jail data in Ohio. Thank you to the Indiana Public Defenders Council. Thank
you to Grace Phillips at the New Mexico Association of Counties. This work would not be possible
without the excellent work of researchers at the Bureau of Justice Statistics who maintain the National
Jail Census and Annual Survey of Jails programs, especially Zhen Zeng.

About citations
As researchers and readers alike rely more and more on public knowledge made available through the
Internet, “link rot” has become a widely acknowledged problem with creating useful and sustainable
citations. To address this issue, the Vera Institute of Justice is experimenting with the use of Perma.cc
(https://perma.cc/), a service that helps scholars, journals, and courts create permanent links to the
online sources cited in their work.

Credits
© Vera Institute of Justice 2021. All rights reserved. An electronic version of this report is posted on Vera’s
website at https://www.vera.org/publications/people-in-jail-and-prison-in-spring-2021. For more
information about Vera, visit www.vera.org.
For more information about this report, contact Jacob Kang-Brown, senior research associate, at
jkangbrown@vera.org.

Suggested citation
Jacob Kang-Brown, Chase Montagnet, and Jasmine Heiss. People in Jail and Prison in Spring 2021. New
York: Vera Institute of Justice, 2021.

20