
Wsipp Stabilizing Prison Populations in Washington Interim Report 2006
Download original document:
Document text
Document text
This text is machine-read, and may contain errors. Check the original document to verify accuracy.
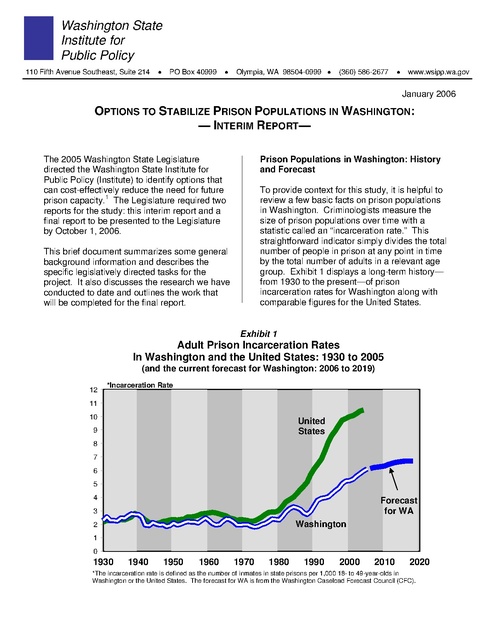
Washington State
Institute for
Public Policy
110 Fifth Avenue Southeast, Suite 214

•

PO Box 40999

•

Olympia, WA 98504-0999 •

(360) 586-2677

•

www.wsipp.wa.gov

January 2006

OPTIONS TO STABILIZE PRISON POPULATIONS IN WASHINGTON:
— INTERIM REPORT—
The 2005 Washington State Legislature
directed the Washington State Institute for
Public Policy (Institute) to identify options that
can cost-effectively reduce the need for future
1
prison capacity. The Legislature required two
reports for the study: this interim report and a
final report to be presented to the Legislature
by October 1, 2006.

Prison Populations in Washington: History
and Forecast
To provide context for this study, it is helpful to
review a few basic facts on prison populations
in Washington. Criminologists measure the
size of prison populations over time with a
statistic called an “incarceration rate.” This
straightforward indicator simply divides the total
number of people in prison at any point in time
by the total number of adults in a relevant age
group. Exhibit 1 displays a long-term history—
from 1930 to the present—of prison
incarceration rates for Washington along with
comparable figures for the United States.

This brief document summarizes some general
background information and describes the
specific legislatively directed tasks for the
project. It also discusses the research we have
conducted to date and outlines the work that
will be completed for the final report.

Exhibit 1

Adult Prison Incarceration Rates
In Washington and the United States: 1930 to 2005
(and the current forecast for Washington: 2006 to 2019)
12

*Incarceration Rate

11
10

United
States

9
8
7
6
5
4

Forecast
for WA

3

Washington

2
1
0

1930

1940

1950

1960

1970

1980

1990

2000

2010

2020

*The incarceration rate is defined as the number of inmates in state prisons per 1,000 18- to 49-year-olds in
Washington or the United States. The forecast for WA is from the Washington Caseload Forecast Council (CFC).

Three Trends in Prison Populations
Exhibit 1 reveals three important “big picture”
trends that provide a framework for the study.
1. Prison rates have roughly tripled in
Washington since the mid-1970s. The use of
prison in Washington was quite stable from 1930
to 1980. On any given day during this 50-year
period, roughly two persons were incarcerated in
a state prison out of every 1,000 people in
Washington between the ages of 18 and 49.2
Washington’s incarceration rate then began to
grow in the late 1970s and 1980s, and
accelerated further during the 1990s. Today,
Washington’s prison incarceration rate stands at
about 6 adults incarcerated per 1,000—nearly
three times the rate 30 years ago.3
2. Washington’s growth rate in prison
populations has been considerably less than
the national rate. Exhibit 1 also plots the
national incarceration rate. For several
decades—from 1930 until the mid-1970s—
Washington’s incarceration rate was quite similar
to the average rate across the United States.
Washington’s rate began to diverge slightly from
the national trend in the late 1970s, but then
went on a distinctively different path after
Washington enacted sentencing reform
legislation in the early 1980s. Washington’s rate
of growth in incarceration has been about 30
percent less than the national rate during the
years following Washington’s 1984 sentencing
reform.4
The fiscal implications of Washington’s path
are significant. Consider that today in
Washington there are about 17,600 people in
state prisons. If Washington’s incarceration
rate had kept pace with the national rate, there
would be about 23,800 people in prison today.
Thus, because Washington’s incarceration rate
diverged from the national trend over the
course of the last 30 years, there are 6,200
fewer people in prison today than there
otherwise would be. Since new prisons are
typically built to house about 1,300 inmates,
this means that Washington avoided
constructing and staffing of about five new
prisons in the last three decades because its
incarceration rate grew considerably slower
than the national rate.

3. Washington’s incarceration rate is
expected to increase by another 10 percent by
2019. Exhibit 1 also contains one other piece of
information particularly relevant for the Institute’s
study. The Exhibit includes the latest forecast of
Washington’s prison incarceration rate to the year
2019. In the mid-1990s, the legislature
established the Washington State Caseload
Forecast Council (CFC) to forecast key caseloads
that affect the state budget.5 The latest prison
forecast from the CFC shows continued increases
in adult incarceration rates although at a lesser
rate of growth. Assuming no changes to existing
laws or additional laws, the CFC currently sees
incarceration rates growing roughly another 10
percent by 2019.
Even with this slower rate of growth, however,
the current CFC forecast anticipates the need for
a substantial number of new prison beds. This is
due to two factors: the aforementioned 10
percent growth in the incarceration rate and the
expected increase in Washington’s population.
Exhibit 2 displays the key budget-driving
statistics. Absent any new policy shifts from the
legislature, the CFC’s forecast implies the need
for about 3,700 new prison beds by 2019.
Although the 2005 Legislature funded a new
1,280 bed facility, there remains roughly a twoprison gap between existing/authorized capacity
and future forecasted need. At about $27,000
per year per bed to operate a prison, and about
$11,000 per year per bed to amortize capital
costs, the financial implications of the forecast
for the state budget are significant.

Exhibit 2

Washington's Prison Populations:
Actual (2005) and Forecast (2019)
Average Daily Population
21,482
17,814

+3,668

2005

2019

change

Legislative Direction for the Study
The legislative language directing the Institute’s
study is shown verbatim in the accompanying
sidebar. In brief, the legislation requires the
Institute to study the net short-run and long-run
fiscal savings to state and local governments if
evidence-based prevention, intervention, and
sentencing alternatives are implemented in
Washington. In particular, the “bottom line”
research question for this study is whether
there are enough cost-beneficial alternatives
that would enable Washington to avoid
constructing the new prisons that are implied in
the current CFC forecast.
The Institute is directed to examine three broad
types of policy options the legislature could
consider to accomplish this goal.
1. Sentencing options. The legislation
directs the Institute to examine possible
changes that could be made to
Washington’s sentencing laws, including
sentencing alternatives and the use of risk
factors in sentencing. These options are to
be analyzed in conjunction with efforts
underway at the Washington State
Sentencing Guidelines Commission.
2. Prevention programs. The legislative
language instructs the Institute to estimate
whether investments in evidence-based
and cost-beneficial prevention programs
could help reduce the need for future prison
beds. Since most prevention programs are
for young children, effective evidencebased prevention resources can be
expected to affect adult prison use only in
the longer run. These programs can,
however, offer other near-term and longterm advantages, such as improved
educational outcomes. The Institute’s study
will consider these additional outcomes in
our benefit-cost analysis.6
3. Intervention programs. For offenders
already in Washington’s juvenile and adult
correctional systems, the study is to
estimate whether investments in evidencebased programs could cost-effectively lower
recidivism rates and, as a result, the need
for additional prison beds.

Study Language from the 2005
Legislature
ESSB 6094, Section 708, Chapter 488, Laws of
2005. The appropriation in this section is
subject to the following conditions and
limitations: The appropriation is provided solely
for the Washington state institute for public
policy to study options to stabilize future prison
populations. The legislature intends to examine
options that could stabilize the adult inmate
population growth at the projected 2007 level in
order to avoid construction of major prison
facilities after construction of the Coyote Ridge
correctional center. To do this, the legislature
finds that sentencing options need to be
examined in conjunction with prevention and
intervention programs. The legislature finds that
existing and current research underway by the
Washington state institute for public policy can
be synthesized to develop these options, in
conjunction with sentencing options that will be
developed by the sentencing guidelines
commission. The Washington state institute for
public policy shall build on the study required by
chapter . . . (Engrossed Substitute Senate Bill
No. 5763 (mental disorders treatment)), Laws of
2005, and study the net short-run and long-run
fiscal savings to state and local governments of
implementing evidence-based treatment human
service and corrections programs and policies,
including prevention and intervention programs,
sentencing alternatives, and the use of risk
factors in sentencing. The institute shall use the
results from its 2004 report on cost-beneficial
prevention and early intervention programs and
its work on effective adult corrections programs
to project total fiscal impacts under alternative
implementation scenarios. The institute shall
provide an interim report to the appropriate
committees of the legislature by January 1,
2006, and a final report by October 1, 2006.
The Institute received an appropriation of
$50,000 to conduct the study.

After analyzing the economics of each of these
options, the task for the study is to estimate the
total fiscal and prison bed impacts of “alternative
implementation scenarios.” The goal of these
policy choices is to allow the legislature to
consider options that have the ability to keep
crime rates under control while also lowering the
long-run fiscal cost of Washington’s state and
local criminal justice systems. In financial terms,
this means identifying portfolios of state crime
control options that replace lower rate-of-return
investments with strategies that produce higher
rates of return on the taxpayer’s dollar.

Research Approach
To develop the information for the final report,
the Institute is currently engaged in the
following three research tasks.
9 Task 1: Determine if there are evidencebased and cost-beneficial options. Are there
any prevention or intervention programs, or
sentencing alternatives, that work? More
specifically, has rigorous research
demonstrated specific approaches that have—
in the real world—the ability to reduce crime?
Further, do the benefits of these options
outweigh the costs?
To address these questions, we are conducting
a systematic review of all rigorous program
evaluations conducted over the last 40 years in
the United States and other English speaking
countries. Only a few of these evaluations are of
Washington State prevention and intervention
programs; rather, most evaluations in our review
are of programs conducted in other locations.
One primary purpose of our study is to take
advantage of all rigorous evaluations and,
thereby, learn whether there are conclusions that
can allow policymakers in Washington to
improve this state’s criminal justice system.
To complete this first task, we are using a
technique called “meta-analysis,” which is a
formal statistical procedure to test whether
existing evidence supports the questions posed
for this study. We are also estimating the
benefits and costs of each alternative using the
same methods we have employed in our earlier
reviews of criminal justice and social programs.
In addition, as described in the legislation
authorizing this study, we are working on similar
analytical work for ESSB 5763—a 2005 Act
pertaining to evidence-based services for
persons with co-occurring mental health and
substance abuse conditions. Our approach to
this phase of the study, along with the results we
have produced to date, is described in several
other Institute publications.7
9 Task 2: Calculate the impact these
evidence-based approaches could have on
state and local governmental costs and
prison capacity needs. The second major
task for this project involves estimating the
degree to which any identified evidence-based
approach could be implemented in
Washington. That is, if the results of Task 1
reveal that there are particular programs or

sentencing alternatives that can costbeneficially affect long-run crime rates and
prison use, then the question is: What impact
could the program have in Washington? To
answer this, we will estimate how many people
there are in Washington who could realistically
be expected to participate in a particular
program. For example, if the research
evidence indicates that a particular juvenile
justice program has the ability to affect adult
prison use in the long run, then we will estimate
how many juvenile offenders there are in
Washington who might be placed in the
program. Estimates of these factors will be
made during the spring and summer of 2006.
9 Task 3: Identify a “portfolio” of costbeneficial choices for consideration by the
Legislature. When Tasks 2 and 3 are
complete, we can assemble the information in
such a way that the legislature will be able to
consider a range of options (“portfolios”) that it
can implement to achieve the overall goal of
the project: to identify options to stabilize future
prison populations.
Final Report. The due date for the final report
for this project is October 1, 2006.

For information or comments, please contact
Steve Aos at: saos@wsipp.wa.gov; 360-586-2740.
Footnotes
1

ESSB 6094, Section 708, Chapter 4888, Laws of 2005.

2

Other age groups could be used as denominators in calculating
incarceration rates; the choice does not materially affect the results.
We used the 18- to 49-year-old group because that age cohort
encompasses the most crime prone ages for adult offenders.
3

None of the figures in this interim report includes local jail
populations. Jails are run by counties in Washington. Jail
incarceration rates have also increased over time and this will be
addressed in our final report. For more information on local jail
rates, see: S. Aos, The Criminal Justice System in Washington
State: Incarceration Rates, Taxpayer Costs, Crime Rates, and
Prison Economics. Olympia: Washington State Institute for Public
Policy, January, 2003.
4

Because of limitations in how the federal government reports
national prison rates, the national series includes prisoners in
federal prisons as well as inmates in state prisons. This does not
materially affect the comparisons presented here.
5

Information on the Washington State Caseload Forecast Council
is available at the Council’s website: http://www.cfc.wa.gov/
6

See: S. Aos, R. Lieb, J. Mayfield, M. Miller, A. Pennucci, Benefits
and Costs of Prevention and Early Intervention Programs for Youth.
Olympia: Washington State Institute for Public Policy, September,
2004.

7

In addition to the references in footnotes 3 and 6, see: S. Aos, M.
Miller, E. Drake, Evidence-Based Adult Corrections Programs.
Olympia: Washington State Institute for Public Policy, January
2006.

Document No. 06-01-1202